Introduction
Conduct disorder (CD) is a mental condition diagnosed in childhood or adolescence according to the Diagnostic and Statistical Manual of Mental Disorders, fourth edition, text revision (DSM-IV-TR). It presents a repetitive and persistent pattern of behavior whereby the basic rights of others, or major age-appropriate norms, are violated (APA, 2000). CD has been reported to occur in about 16% of otherwise healthy preadolescents (Olsson, Reference Olsson2009). According to developmental taxonomic theory (Moffitt et al. Reference Moffitt, Arseneault, Jaffee, Kim-Cohen, Koenen, Odgers, Slutske and Viding2008), adolescents with early-onset CD (EO-CD) (who exhibited initiated CD symptoms before 10 years) are more susceptible to persistent aggressive or antisocial behaviors in their adult life compared with adolescent-onset CD (AO-CD) subjects. Correspondingly, the former has been more extensively studied. Although less likely than their EO counterparts to show persistent antisocial problems into young adulthood, AO individuals are more likely to have antisocial problems and are also expected to experience more health burden in later adult life than their control counterparts (Odgers et al. Reference Odgers, Caspi, Broadbent, Dickson, Hancox, Harrington, Poulton, Sears, Thomson and Moffitt2007; Roisman et al. Reference Roisman, Monahan, Campbell, Steinberg and Cauffman2010). Some recent evidence also suggests differentiated phenotypic findings as well as task performances, such as reward sensitivity and facial recognition, between AO-CD and EO-CD patients (Fairchild et al. Reference Fairchild, Van Goozen, Calder, Stollery and Goodyer2009a , Reference Fairchild, van Goozen, Stollery, Aitken, Savage, Moore and Goodyer b ; Passamonti et al. Reference Passamonti, Fairchild, Goodyer, Hurford, Hagan, Rowe and Calder2010; Silberg et al. Reference Silberg, Moore and Rutter2014). In Fairchild et al. (Reference Fairchild, Passamonti, Hurford, Hagan, von dem Hagen, van Goozen, Goodyer and Calder2011), reduced volume of the right insula was only observed for AO-CD patients compared with healthy controls (HCs), while reduced volume of the amygdala was observed for both subtypes of CD relative to controls. Given the aforementioned findings, we expect to further explore the biological substrate of AO-CD, thereby providing conceivable evidence for the subtle distinction that may exist between the two subtypes.
To date, several studies have compared the gray matter structure of normally developing youths and adolescents with CD, especially those with EO-CD (Kruesi et al. Reference Kruesi, Casanova, Mannheim and Johnson-Bilder2004; Sterzer et al. Reference Sterzer, Stadler, Poustka and Kleinschmidt2007; Huebner et al. Reference Huebner, Vloet, Marx, Konrad, Fink, Herpertz and Herpertz-Dahlmann2008; Fairchild et al. Reference Fairchild, Passamonti, Hurford, Hagan, von dem Hagen, van Goozen, Goodyer and Calder2011; Hyatt et al. Reference Hyatt, Haney-Caron and Stevens2012; Wallace et al. Reference Wallace, White, Robustelli, Sinclair, Hwang, Martin and Blair2014). The abnormal structures identified most often included the orbitofrontal cortex (OFC) (Huebner et al. Reference Huebner, Vloet, Marx, Konrad, Fink, Herpertz and Herpertz-Dahlmann2008), the amygdala (Huebner et al. Reference Huebner, Vloet, Marx, Konrad, Fink, Herpertz and Herpertz-Dahlmann2008; Fairchild et al. Reference Fairchild, Passamonti, Hurford, Hagan, von dem Hagen, van Goozen, Goodyer and Calder2011; Wallace et al. Reference Wallace, White, Robustelli, Sinclair, Hwang, Martin and Blair2014), the insula (Sterzer et al. Reference Sterzer, Stadler, Poustka and Kleinschmidt2007; Fahim et al. Reference Fahim, He, Yoon, Chen, Evans and Pérusse2011; Fairchild et al. Reference Fairchild, Passamonti, Hurford, Hagan, von dem Hagen, van Goozen, Goodyer and Calder2011) and other temporal regions (Huebner et al. Reference Huebner, Vloet, Marx, Konrad, Fink, Herpertz and Herpertz-Dahlmann2008; Hyatt et al. Reference Hyatt, Haney-Caron and Stevens2012). Moreover, gray matter volume in the frontal and temporal areas has often been found to be inversely related to the CD symptoms manifested by a subject (Sterzer et al. Reference Sterzer, Stadler, Poustka and Kleinschmidt2007; Huebner et al. Reference Huebner, Vloet, Marx, Konrad, Fink, Herpertz and Herpertz-Dahlmann2008). It has been hypothesized that impairment of the aforementioned structures, which may affect emotional regulation and behavioral control (Blair, Reference Blair2004), is associated with the inappropriate behaviors exhibited by CD subjects (Rubia et al. Reference Rubia, Smith, Halari, Matsukura, Mohammad, Taylor and Brammer2009). Correspondingly, aggressive, antisocial individuals were also found to have structural deficits in the prefrontal cortex, the anterior cingulate cortex (ACC) and several other interconnected regions of the brain (Yang & Raine, Reference Yang and Raine2009).
Although the structural findings regarding EO-CD have been largely studied in heterogeneous samples and with different study designs, structural alterations of AO-CD have been less investigated and the neural basis of different task performances between the two subtypes of CD remains unknown. In addition, it is important to note that almost all the work conducted before did not exclude attention-deficit/hyperactivity disorder (ADHD) which was characterized by a delay in cortical maturation (Shaw et al. Reference Shaw, Eckstrand, Sharp, Blumenthal, Lerch, Greenstein, Clasen, Evans, Giedd and Rapoport2007). It indicates that the contribution of co-morbid ADHD features to structural abnormalities observed for CD should be differentiated. Another concern is the use of voxel-based morphometry (VBM); while this method combines both thickness and surface features to calculate gray matter volume (Winkler et al. Reference Winkler, Kochunov, Blangero, Almasy, Zilles, Fox, Duggirala and Glahn2010), it may obscure the degree to which each factor contributes to volume differences since these measures were found to be globally and regionally independent and stemmed from different genetic and cellular mechanisms in the brain (Armstrong et al. Reference Armstrong, Schleicher, Omran, Curtis and Zilles1995; Panizzon et al. Reference Panizzon, Fennema-Notestine, Eyler, Jernigan, Prom-Wormley, Neale, Jacobson, Lyons, Grant, Franz, Xian, Tsuang, Fischl, Seidman, Dale and Kremen2009). While the surface-based method (surface-based morphometry; SBM) enables separate measurement of cortical thickness and surface area as well as cortical folding based on the two-dimensional folded laminar structure of the cerebral cortex (Dale et al. Reference Dale, Fischl and Sereno1999; Winkler et al. Reference Winkler, Kochunov, Blangero, Almasy, Zilles, Fox, Duggirala and Glahn2010), it aids in understanding neural abnormalities beyond the basic volumetric abnormalities and has the potential to elucidate the underlying causes of brain structural alterations and the cognitive processes affected by these abnormalities. In addition, surface-based registration provides significantly higher accuracy than any form of volume-based registration (Ghosh et al. Reference Ghosh, Kakunoori, Augustinack, Nieto-Castanon, Kovelman, Gaab, Christodoulou, Triantafyllou, Gabrieli and Fischl2010). Three SBM studies in CD, however, recruited participants with an unspecified (Wallace et al. Reference Wallace, White, Robustelli, Sinclair, Hwang, Martin and Blair2014) or wide age range, i.e. 12–18 years in Hyatt et al. (Reference Hyatt, Haney-Caron and Stevens2012) and 16–21 years in Fairchild et al. (Reference Fairchild, Toschi, Hagan, Goodyer, Calder and Passamonti2015). Although they matched groups for age, the non-linear and region-specific manner of gray matter development from the ages of 4 to 20 years may confound group differences (Giedd et al. Reference Giedd, Blumenthal, Jeffries, Castellanos, Liu, Zijdenbos, Paus, Evans and Rapoport1999).
In the present study, we decided to set a cut-off of age 14 years for adolescence (Silberg et al. Reference Silberg, Moore and Rutter2014), after the time when puberty has begun in most children and after the patterns of genetic influences have mainly stabilized (Silberg et al. Reference Silberg, Rutter and Eaves2001). Additionally, onset of CD after 16 years is rare (APA, 2013), so AO-CD patients aged 14–16 years were recruited along with age-, intelligence quotient (IQ)- and gender-matched HCs. Based on previous literature, we hypothesized that cortical deficits (including thickness, surface area and cortical folding) would be observed in AO-CD patients, especially in the paralimbic regions as has been postulated (Rubia, Reference Rubia2011). Second, the detected cortical deficits were assumed to be correlated with the high-level impulsive as well as antisocial problems in CD.
Method
Samples
A total of 28 AO-CD participants aged 14–16 years (22 males and six females) were recruited from out-patient clinics affiliated with the Second Xiangya Hospital of Central South University (Changsha, Hunan, China). A diagnosis of CD was determined using the Structured Clinical Interview for DSM-IV-TR Axis I Disorders-Patient Edition (SCID-I/P) (First et al. Reference First, Spitzer, Gibbon and Williams2002) by two well-trained psychiatrists. According to DSM-IV-TR (APA, 2000), subjects fulfilling the criteria for AO-CD exhibited at least one symptom of CD after the age of 10 years. To improve the reliability of the diagnostic interview, information was collected from each participant and at least one corresponding parent. A psychiatrist made the final decision if the information offered was inconsistent.
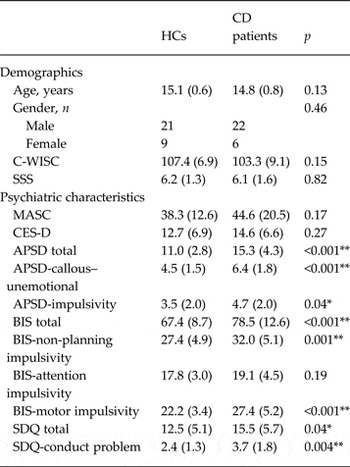
A HC group was randomly selected from local middle schools in the same region. The HC group was also subjected to the SCID-I/P by the same group of psychiatrists that evaluated the CD group. None of the HCs met the criteria for CD or any other psychiatric disorders, or had history of CD symptoms and aggression. Finally, 30 age-, gender- and IQ-matched individuals (21 males and nine females) comprised the HC group (Table 1), with the Chinese version of the Wechsler Intelligence Scale for Children (C-WISC) (Gong & Cai, Reference Gong and Cai1993) as the IQ measurement.
Demographics and psychiatric characteristics of adolescents with CD and HCs

Data are given as mean (standard deviation) unless otherwise indicated.
CD, Conduct disorder; HCs, healthy controls; C-WISC, Chinese Wechsler Intelligence Scale for Children; SSS, Subjective Socioeconomic Status Scale; MASC, Multidimensional Anxiety Scale for Children; CES-D, Center for Epidemiologic Studies Depression Scale; APSD, Antisocial Process Screening Device; BIS, Barratt Impulsiveness Scale; SDQ, Strengths and Difficulties Questionnaire.
* p < 0.05, ** p < 0.01.
Participants were excluded based on: a history of ADHD, oppositional defiant disorder, any psychiatric or emotional disorder, diagnosis of any pervasive developmental or chronic neurological disorder, Tourette's syndrome, post-traumatic stress disorder, obsessive–compulsive disorder, persistent headaches, head trauma, alcohol or substance abuse over the past year, contraindications to magnetic resonance imaging (MRI), or an IQ ⩽ 80 on the C-WISC. Participants were also required to be right-handed, according to the Edinburgh Handedness Inventory (Oldfield, Reference Oldfield1971).
This study was approved by each school's administration and the Ethics Committee of the Second Xiangya Hospital of Central South University. All subjects and their parents were informed of the purpose of this study and written informed consent of all of them was obtained.
Self-report assessments
All participants underwent the Chinese versions of the Center for Epidemiologic Studies Depression Scale (Radloff, Reference Radloff1977) and the Multidimensional Anxiety Scale for Children (Yao et al. Reference Yao, Zou, Zhu, Abela, Auerbach and Tong2007b ). These scales were used to assess depression and anxiety severity, respectively. In addition, the Chinese version of the Subjective Socioeconomics Status Scale (SSS) (Hu et al. Reference Hu, Wang, Cai, Zhu and Yao2012) was used to quantify each participant's socio-economic status, the Strengths and Difficulties Questionnaire (SDQ) (Yao et al. Reference Yao, Zhang, Zhu, Jing, McWhinnie and Abela2009) was used to detect internalization and externalization of problems. Callous–unemotional (CU) traits were evaluated using the Antisocial Process Screening Device (APSD) (Frick, Reference Frick and Hare2001), and the Barratt Impulsiveness Scale (BIS) (Yao et al. Reference Yao, Yang, Zhu, Auerbach, Abela, Pulleyblank and Tong2007a ) was used to assess impulsiveness. All CD subjects were treatment-naive. Details regarding psychiatric assessments for the two groups are provided in Table 1.
Image acquisition
Three-dimensional (3D) T1-weighted images (Philips, Achieva, 3.0T, the Netherlands) for all participants were obtained using 3D turbo field echo sequence. Scan parameters are: repetition time = 8.5 ms, echo time = 3.743 ms, flip angle = 8°, matrix = 256 × 256 pixels, field of view = 256 × 256, number of slices = 180, slice thickness = 1 mm, image voxel size = 1.0 × 1.0 × 1.0 mm3, and acquisition time = 178 s.
Image processing
All participants’ T1 images underwent a radiological evaluation performed by a specialist (W.S.) to assess the presence of abnormal radiological or structural features. No participants were excluded from further analysis because of motion artifacts. Anatomic reconstruction of the cortical surfaces was performed using the Freesurfer image analysis suite (stable release version 5.3.0; http://surfer.nmr.mgh.harvard.edu) as previously described (Dale et al. Reference Dale, Fischl and Sereno1999; Fischl et al. Reference Fischl, Sereno and Dale1999). Triangle meshes which represent the boundary of the white surface (the gray matter–white matter interface) and the boundary of the pial surface (the gray matter–cerebrospinal fluid interface) were generated using deformation algorithms based on local intensity values (Dale et al. Reference Dale, Fischl and Sereno1999) and geometrical and topological constraints (Fischl et al. Reference Fischl, Liu and Dale2001). The estimated white and pial surfaces were manually corrected for inconsistencies by visual inspection by an operator blind to each subject's diagnosis. The reconstruction procedure was repeated until accurate representations of white and pial surfaces were obtained. The reconstructed surfaces were used to calculate cortical thickness and surface area (Fischl et al. Reference Fischl, Sereno and Dale1999), with the former estimated as the shortest distance in millimeters between the two surfaces. As a result, cortical thickness values with submillimeter accuracy were obtained from over 100 000 vertices per hemisphere.
Estimates of surface area (the total area of the surface encompassing a brain region) are quantified by assigning an area to each vertex equal to the average of its surrounding triangles (Winkler et al. Reference Winkler, Sabuncu, Yeo, Fischl, Greve, Kochunov, Nichols, Blangero and Glahn2012). The total vertex area is summed over all vertices, and it is equal to the sum of the areas of the triangles. The degree of cortical folding (assessed by local gyrification index; lGI) was measured using surface-based, 3D gyrification measurements according to Schaer et al. (Reference Schaer, Cuadra, Tamarit, Lazeyras, Eliez and Thiran2008), a validated method embedded in Freesurfer. The lGI at a given point on the cortical surface was computed as the ratio between the surface of a 25-mm radius circular region of interest (ROI) on the folded pial surface and the surface of the corresponding cortex's outer perimeter (Schaer et al. Reference Schaer, Cuadra, Tamarit, Lazeyras, Eliez and Thiran2008). The amount of cortical folding (lGI) at each pial surface location reflects the amount of cortex buried within the sulcal folds in the surrounding area. As correct lGI values are typically between 1 and 5, the greater the value of the lGI, the more surfaces are buried in sulcal folds (Schaer et al. Reference Schaer, Cuadra, Schmansky, Fischl, Thiran and Eliez2012).
Statistical analysis
Cortical thickness was smoothed with 10 mm while the lGI and surface area were smoothed using 5 mm full-width/half-maximum Gaussian kernels. To assess regional between-group differences in these cortical structural measures, surface-based group analyses were performed using the general linear model tools available in Freesurfer. Prior to the group comparisons, each participant's data were resampled into an average spherical surface representation that optimally aligned the sulcal and gyral features across the subjects (Wismueller et al. Reference Wismueller, Vietze, Dersch, Leinsinger, Ritter and Hahn1999). Statistically significant differences between the cortical thickness, surface area and lGI of the two groups were identified using a Monte Carlo simulation (Hagler et al. Reference Hagler, Saygin and Sereno2006), a cluster-wise correction applied for multiple comparisons. Clusters were initially obtained using a p < 0.05 (two-tailed) vertex-wise threshold, and these were only reported if they met an additional cluster-wise probability (p cluster) of p < 0.05 (two-tailed) at least. Statistically significant clusters with cortical thinning were defined as ROIs, then we mapped those ROIs to all of the individual subjects to extract statistical values for later correlation analyses.
Post-hoc analysis
To investigate gender and group effects, the two groups were compared using analysis of covariance with the structural thickness used as the dependent variable, and group and gender used as fixed factors. To determine whether potential confounders such as age, IQ, anxiety and depression level influenced the results obtained, a group comparison of thickness was performed by adding each of these factors as a covariate.
Pearson correlation analysis was applied to the BIS or ASPSD total with ROI thickness in all participants and in AO-CD patients, while subscales of interest (including BIS-motor impulsivity, APSD-CU and APSD-impulsivity) were only used in patients. All correlation results were reported if they were associated with a p value < 0.05, uncorrected.
Results
Demographic and clinical data
Table 1 lists the demographics and psychiatric characteristics for both groups. No significant differences in age, IQ, socio-economic status, anxiety or depression were observed between the two groups. However, CD patients had an overall higher total score and subscale scores for the APSD, BIS and SDQ compared with the HCs.
Cortical thickness
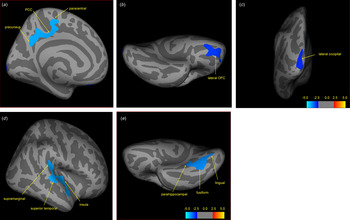
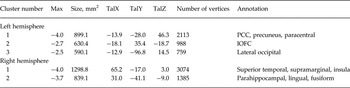
There were no group differences in mean cortical thickness in either the left or right hemisphere. In the left hemisphere, decreased cortical thickness was associated with three clusters (Table 2, Fig. 1a–c ). The first cluster included the precuneus, posterior cingulate cortex (PCC) and the paracentral area (p cluster = 0.004). The second cluster was the lateral orbitofrontal cortex (lOFC) (p cluster = 0.002), while the third cluster was the lateral occipital cortex (p cluster = 0.003). In the right hemisphere, cortical thinning was associated with two clusters (Table 2, Fig. 1d and e ). One cluster consisted of the superior temporal cortex, the supramarginal cortex and a small part of the insula (p cluster = 0.0001), while the other cluster included the fusiform and the lingual/parahippocampal gyrus (p cluster = 0.0002). Each of these clusters survived multiple comparisons (p < 0.01, corrected). None of the clusters had greater cortical thickness in CD than HC subjects.
Differences in cerebral cortical thickness between adolescent-onset conduct disorder (AO-CD) patients (n = 28) and matched healthy controls (HCs; n = 30). Images of the left and right hemispheres for each group are presented. Medial (a), inferior (b) and posterior (c) views of the left inflated cerebral surfaces show differences in cortical thickness between the two groups. Lateral (d) and inferior (e) views of the right inflated cerebral surfaces show differences in cortical thickness between the two groups. Colored regions are used to indicate significant differences in cortical thickness between the two groups, with blue representing a greater thickness for the HC group compared with the AO-CD group. The value of the color bar is a log10 (p value). Cluster labels correspond with those provided in Table 2. PCC, Posterior cingulate cortex; OFC, orbitofrontal cortex.

Clusters of cortical thinning in adolescents in the two hemispheres (HCs > CD)

HCs, Healthy controls; CD, conduct disorder; Max, log10 (p value); Tal (X, Y, Z), Talairach (X, Y, Z); PCC, posterior cingulate cortex; lOFC, lateral orbitofrontal cortex.
lGI
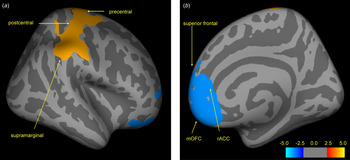
A reduced lGI was observed at the right rostral ACC (p cluster = 0.0002), and this extended to the medial OFC (mOFC) and the superior frontal cortex in CD patients compared with the HCs (Table 3, Fig. 2). In contrast, the lGI for the right precentral gyrus (p cluster = 0.0001), extended to the postcentral and supramarginal areas, was greater in the CD patients compared with the HCs. Both clusters survived multiple comparisons (p < 0.01, corrected).
Cerebral cortical folding differences in the right hemisphere between adolescent-onset conduct disorder (AO-CD) patients (n = 28) and matched healthy controls (HCs; n = 30). Lateral (a) and medial (b) views of the right cerebral surfaces show differences in the gyrification index between the two groups. Colored regions are used to indicate significant differences in the gyrification index values for the two groups, with blue representing greater values for the HC group compared with the AO-CD group. Conversely, red/yellow coloring represents greater values for the AO-CD group compared with the HC group. The value of the color bar is a log10 (p value). Cluster labels correspond with those provided in Table 3. mOFC, Medial orbitofrontal cortex; rACC, rostral anterior cingulate cortex.

Clusters of gyrification deficits in adolescents in the right hemisphere

Max, Log10 (p value), the positive value (4.0) of cluster 2 represents a converse result of the contrast; Tal (X, Y, Z,), Talairach (X, Y, Z); HCs, healthy controls; CD, conduct disorder; rACC, rostral anterior cingulate cortex; mOFC, medial orbitofrontal cortex.
Surface area
Compared with HCs, CD patients revealed diminished area in two clusters of the right hemisphere; one was the inferior temporal cortex (p < 0.0048) which extended to the parahippocampal gyrus and fusiform, while the other cluster included the precentral and the caudal-middle-frontal cortex (p < 0.0088). Both clusters survived multiple correction (p < 0.05). However, when a more conservative threshold was used (p < 0.01), no group difference was found to exist (see online Supplementary Fig. S6 and Table S1).
Potential confounders and correlation of ROIs with self-reported measurements
There was no evidence that gender influenced the results obtained (p > 0.2 in the five clusters). Group differences in cortical thickness for each cluster remained significant after controlling for age, IQ, anxiety and depression (p < 0.001).
For all the participants, four out of five clusters were negatively correlated with the APSD (except the right fusiform) and BIS (except the left precuneus) total scores, but only the left lOFC survived multiple comparisons (r = −0.44/−0.43, respectively, p < 0.01, Bonferroni, corrected).
For the AO-CD group only, APSD-CU was negatively correlated with thickness of the right superior temporal cortex (r = −0.4, p = 0.04) and the right fusiform (r = −0.63, p < 0.05, Bonferroni, corrected) while BIS-motor impulsivity was inversely correlated with the thickness of the right fusiform (r = −0.38, p < 0.05) and left lOFC (r = −0.35, p = 0.09). In addition, APSD-impulsivity was inversely correlated with lOFC thickness (r = −0.33, p = 0.07) with marginal significance. All correlation figures of CD patients are presented in the online Supplementary materials (Supplementary Figs S1–S5). We found no significant correlations between the total scores of BIS or APSD with ROI thickness.
Discussion
To our knowledge, this study is the first to document cortical abnormalities in a moderate cohort of AO-CD patients. The results clearly demonstrated that AO-CD was related to cortical thinning in multiple brain regions. As Rubia (Reference Rubia2011) previously postulated that abnormal activation of the ‘hot’ paralimbic system, which mediates the control of emotion and motivation (Blair, Reference Blair2004), was specifically associated with CD (Rubia, Reference Rubia2011), cortical deficits in the left OFC, right ACC, superior temporal and parahippocampal gyri and the insula in our AO-CD patients closely matched the cortical topography of this system and were consistent with volumetric reductions repeatedly identified in studies of subjects with EO-CD (Kruesi et al. Reference Kruesi, Casanova, Mannheim and Johnson-Bilder2004; Sterzer et al. Reference Sterzer, Stadler, Poustka and Kleinschmidt2007; Huebner et al. Reference Huebner, Vloet, Marx, Konrad, Fink, Herpertz and Herpertz-Dahlmann2008; Fairchild et al. Reference Fairchild, Passamonti, Hurford, Hagan, von dem Hagen, van Goozen, Goodyer and Calder2011). Thus, deficits in the paralimbic system may reflect a non-specific effect of both subtypes of CD. Moreover, thickness deficits in the paracentral cortex, fusiform and occipital areas were also reported in previous studies on CD (Fairchild et al. Reference Fairchild, Passamonti, Hurford, Hagan, von dem Hagen, van Goozen, Goodyer and Calder2011; Hyatt et al. Reference Hyatt, Haney-Caron and Stevens2012). However, our study suggested that exceptional gray matter reductions occur in the left parietal regions with AO-CD, including the PCC, precuneus and supramarginal gyri which all have not been observed in EO-CD (Kruesi et al. Reference Kruesi, Casanova, Mannheim and Johnson-Bilder2004; Sterzer et al. Reference Sterzer, Stadler, Poustka and Kleinschmidt2007; Huebner et al. Reference Huebner, Vloet, Marx, Konrad, Fink, Herpertz and Herpertz-Dahlmann2008; Fairchild et al. Reference Fairchild, Passamonti, Hurford, Hagan, von dem Hagen, van Goozen, Goodyer and Calder2011). The results indicated that gray matter maturation or processes related to these areas have been disturbed due to AO-CD, although the parietal areas have not traditionally been considered major sites of pathological change in CD.
Cortical thinning of the precuneus, PCC and supramarginal gyri was in line with two recent structural studies of non-co-morbid CD (Hyatt et al. Reference Hyatt, Haney-Caron and Stevens2012; Wallace et al. 2014), and was also consistent with abnormal activation during inhibitory tasks, passive avoidance learning and risky tasks (Rubia et al. Reference Rubia, Halari, Smith, Mohammed, Scott, Giampietro, Taylor and Brammer2008, Reference Rubia, Smith, Halari, Matsukura, Mohammad, Taylor and Brammer2009; Finger et al. Reference Finger, Marsh, Blair, Reid, Sims, Ng, Pine and Blair2011; Dalwani et al. Reference Dalwani, Tregellas, Andrews-Hanna, Mikulich-Gilbertson, Raymond, Banich, Crowley and Sakai2014). However, previous structural studies of EO-CD did not detect deficits in these areas (Kruesi et al. 2004; Sterzer et al. 2007; Huebner et al. 2008), and it might reflect that these deficits are specific features of AO-CD. Although the structural imaging study in which volume differences between the two subgroups were compared did not detect parietal differences (Fairchild et al. Reference Fairchild, Passamonti, Hurford, Hagan, von dem Hagen, van Goozen, Goodyer and Calder2011), it did not rule out the effect of co-morbidity with ADHD; adolescents with EO-CD are more likely to be co-morbid with ADHD than their AO-CD counterparts (APA, 2013). Otherwise, differences can be attributed to different methods adopted (VBM v. SBM). Indeed, activation of the PCC and precuneus has been primarily associated with various self-referential processes through its interconnection with other midline structures in the brain, including the ACC and OFC (Northoff & Bermpohl, Reference Northoff and Bermpohl2004); thus, abnormalities in these interconnected regions could undermine the self-reflection in subjects with AO-CD. Individuals who lack the capacity to reflect on the negative consequences of immoral behaviors would become predisposed to rule-breaking antisocial behavior (Raine & Yang, Reference Raine and Yang2006). However, this assumption needs to be confirmed by further functional MRI studies in which non-self/self-referential processes would be investigated among the two subtypes. Alternatively, studies of EO-CD failed to detect deficits in the parietal regions partially due to the dramatically dynamic changes that occur from childhood to adolescence in this area; namely, a subtle decline in the parietal areas in EO-CD patients, if present, could be compensated by an age-related increase in gray matter from childhood to early adolescence (Giedd et al. 1999; Shaw et al. Reference Shaw, Kabani, Lerch, Eckstrand, Lenroot, Gogtay, Greenstein, Clasen, Evans, Rapoport, Giedd and Wise2008). These two alternative options could be examined by combining both structural and functional neuroimaging data with a longitudinal method. Taken together, these results suggest that the deficits of the PCC/precuneus may be a potential distinctive feature of AO-CD.
Cortical thinning of paralimbic structures, including the OFC, superior temporal cortex, insula and parahippocampal gyrus, which were closely interconnected, has been consistent with previously identified structural reductions associated with CD subjects versus controls (Kruesi et al. Reference Kruesi, Casanova, Mannheim and Johnson-Bilder2004; Sterzer et al. Reference Sterzer, Stadler, Poustka and Kleinschmidt2007; Huebner et al. Reference Huebner, Vloet, Marx, Konrad, Fink, Herpertz and Herpertz-Dahlmann2008; Fairchild et al. Reference Fairchild, Passamonti, Hurford, Hagan, von dem Hagen, van Goozen, Goodyer and Calder2011; Hyatt et al. Reference Hyatt, Haney-Caron and Stevens2012; Wallace et al. Reference Wallace, White, Robustelli, Sinclair, Hwang, Martin and Blair2014). Yet, some of these studies did not detect deficits in all of these areas (Kruesi et al. Reference Kruesi, Casanova, Mannheim and Johnson-Bilder2004; Sterzer et al. Reference Sterzer, Stadler, Poustka and Kleinschmidt2007; Wallace et al. Reference Wallace, White, Robustelli, Sinclair, Hwang, Martin and Blair2014); potential explanation might rely on the heterogeneity of the samples, such as co-morbidity, age and IQ, etc. The OFC has been shown to play a crucial role in social cognition (Blair & Cipolotti, Reference Blair and Cipolotti2000), reward and punishment processing (O'Doherty et al. Reference O'Doherty, Kringelbach, Rolls, Hornak and Andrews2001; O'Doherty, Reference O'Doherty2004); abnormalities in these processes have been closely related to aggression, which is a major characteristic of CD (Blair, Reference Blair2004). Convergent evidence from functional MRI has also suggested lower activation of the OFC in response to reward task and emotional stimuli processing in CD adolescents compared with controls (Herpertz et al. Reference Herpertz, Huebner, Marx, Vloet, Fink, Stoecker, Shah, Konrad and Herpertz-Dahlmann2008; Rubia et al. Reference Rubia, Smith, Halari, Matsukura, Mohammad, Taylor and Brammer2009). Abnormalities in the insula (Sterzer et al. Reference Sterzer, Stadler, Poustka and Kleinschmidt2007; Fairchild et al. Reference Fairchild, Passamonti, Hurford, Hagan, von dem Hagen, van Goozen, Goodyer and Calder2011, Reference Fairchild, Toschi, Hagan, Goodyer, Calder and Passamonti2015) have been associated with lack of empathy, and may contribute to abnormal emotional processing among CD subjects. Cortical deficits in the right superior temporal cortex and fusiform gyri found in our and previous studies (De Brito et al. Reference De Brito, Mechelli, Wilke, Laurens, Jones, Barker, Hodgins and Viding2009; Fairchild et al. Reference Fairchild, Passamonti, Hurford, Hagan, von dem Hagen, van Goozen, Goodyer and Calder2011; Hyatt et al. Reference Hyatt, Haney-Caron and Stevens2012; Wallace et al. Reference Wallace, White, Robustelli, Sinclair, Hwang, Martin and Blair2014) have the potential to explain why facial expression recognition was impaired in both EO-CD and AO-CD subjects (Fairchild et al. Reference Fairchild, Van Goozen, Calder, Stollery and Goodyer2009a ). The right fusiform gyrus maintains facial expression recognition probably through its communication with the superior temporal cortex (Winston et al. Reference Winston, Henson, Fine-Goulden and Dolan2004) and OFC (Hornak et al. Reference Hornak, Bramham, Rolls, Morris, O'Doherty, Bullock and Polkey2003). Thus, cortical thinning of these structures may compromise the understanding of others’ feelings and intentions, leading to a perception of ambiguous social cues as threatening (Fairchild et al. Reference Fairchild, Van Goozen, Stollery and Goodyer2008). Together, we speculated that deficits in these paralimbic structures reflect a non-specific effect of CD and play a crucial role in the development of CD.
Abnormal lGI values detected in the right ACC were in line with lGI and volume alterations in CD (De Brito et al. Reference De Brito, Mechelli, Wilke, Laurens, Jones, Barker, Hodgins and Viding2009; Hyatt et al. Reference Hyatt, Haney-Caron and Stevens2012). The ACC plays an essential role in controlling responses (Bush et al. Reference Bush, Luu and Posner2000) since the structural and functional organization of the ACC ideally enables it to participate in willed motor control via its extensive connections with the prefrontal cortex (Paus et al. Reference Paus, Petrides, Evans and Meyer1993) and the precentral gyrus (Dum & Strick, Reference Dum and Strick1991). Deficits in the ACC have been found in CD and aggressive adolescents (Sterzer et al. Reference Sterzer, Stadler, Krebs, Kleinschmidt and Poustka2005; Stadler et al. Reference Stadler, Sterzer, Schmeck, Krebs, Kleinschmidt and Poustka2007; Gavita et al. Reference Gavita, Capris, Bolno and David2012; Hyatt et al. Reference Hyatt, Haney-Caron and Stevens2012), especially on the right side (Boes et al. Reference Boes, Tranel, Anderson and Nopoulos2008).
However, the increased lGI of the precentral gyrus seems inconsistent with the results of Hyatt et al. (Reference Hyatt, Haney-Caron and Stevens2012) and Wallace et al. (Reference Wallace, White, Robustelli, Sinclair, Hwang, Martin and Blair2014), and the discrepancies could be attributed to the heterogeneity of the subjects (AO-CD only v. CD, and age distribution) or the interactions between genes and environment, since gyrification which was largely determined genetically has also been shown to experience developmental alterations that occur from childhood to adolescence (White et al. Reference White, Su, Schmidt, Kao and Sapiro2010), as the microstructure of neuronal sheets (Richman et al. Reference Richman, Stewart, Hutchinson and Caviness1975) and axonal connectivity (Van Essen, Reference Van Essen1997) have all been shown to affect cortical folding. Aberrant higher-order structures, like the ACC and OFC, together with lower-order motor regions, like the precentral gyrus, may undermine the control–motor circuit, thereby resulting in poor regulation of impulsive behavior.
In general, gyrification is also thought to be intrinsically related to surface area (Eyler et al. Reference Eyler, Prom-Wormley, Panizzon, Kaup, Fennema-Notestine, Neale, Jernigan, Fischl, Franz, Lyons, Grant, Stevens, Pacheco, Perry, Schmitt, Seidman, Thermenos, Tsuang, Chen, Thompson, Jak, Dale and Kremen2011), but the diminished surface areas detected in the right inferior temporal and the precentral gyrus in the present study were only partly overlapped with areas with folding alterations. Of note, the reduction of surface area (p < 0.05, corrected) was not as robust as alterations of gyrification (p < 0.01, corrected). Surface area is known to be associated with both number of cortical folds (i.e. local gyrification) and separation between cortical folds (i.e. sulci) (Frye et al. Reference Frye, Liederman, Malmberg, McLean, Strickland and Beauchamp2010). A discrepancy between alterations in surface area and folding in CD patients, for example (Wallace et al. Reference Wallace, White, Robustelli, Sinclair, Hwang, Martin and Blair2014), may be due to an illness-related disproportional development of the brain gyri and sulci (Casanova et al. Reference Casanova, El-Baz, Giedd, Rumsey and Switala2010; Shokouhi et al. Reference Shokouhi, Williams, Waiter and Condon2012), and this assumption needs to be addressed in future.
The robust negative relationship between impulsive or antisocial symptoms and the thickness of the lOFC irrespective of diagnosis implies that impulsive and antisocial behavior is closely associated with cortical thinning in this region. The lOFC plays a pivotal role in top-down control (Elliott & Deakin, Reference Elliott and Deakin2005), and deficits of the lOFC might be a shared neural substrate underlying impulsivity and antisocial behaviors (Blair, Reference Blair2004), rather than a specific feature of a certain mental disorder.
While in AO-CD patients only the negative correlations between CU and the thickness of the fusiform, including the lingual and parahippocampal gyri came out with significance, which was consistent with Fairchild et al. (Reference Fairchild, Toschi, Hagan, Goodyer, Calder and Passamonti2015). This implies the close relationship between the CU traits and processes maintained by the above structures, such as facial expression recognition (Winston et al. Reference Winston, Henson, Fine-Goulden and Dolan2004). We found no statistically significant correlations between BIS-motor impulsivity (or APSD-impulsivity) and cortical thickness, but both of them indicated a similar negative trend. Thus, our results demonstrated that cortical thinning in these areas, such as the OFC, fusiform and parahippocampal gyrus, was associated with a higher level of impulsivity.
Interestingly, although we ruled out co-morbidity such as ADHD, ODD, etc., the results of the present study are largely consistent with those of previous studies. This is not uncommon in brain imaging studies, since a meta-analysis (on more than 20 000 subjects and 26 different brain disorders) showing that MRI lesions that were common across all brain disorders were more likely to be located in hubs of the normal brain connectome (Crossley et al. Reference Crossley, Mechelli, Scott, Carletti, Fox, McGuire and Bullmore2014). According to ‘graph theory’ (van den Heuvel & Sporns, Reference van den Heuvel and Sporns2011), structural deficiencies, including the OFC, ACC, superior temporal cortex, insula, PCC, and precuneus in the present study, match well with the ‘hubs’ of cerebral cortex which play a pivotal role in attracting and integrating neuronal information across the whole brain. It may lead to a conclusion that the high-value hubs of human brain networks are more likely to be anatomically abnormal than non-hubs in many (if not all) brain disorders. However, the triggering of a certain brain disorder may rely on complex relationships of the whole brain, including the architecture, neurotransmitters of the brain and so on, and this needs to be investigated in future studies.
Limitations
There were potential limitations in the present study. First, the cross-sectional nature of the present study constrained us from inferring whether the structural abnormalities observed in the present AO-CD cohort are caused by latter triggering of multiple structures, or represent an abnormal developmental trajectory of these structures, and, as DSM-5 pointed out, AO-CD individuals are less likely to persist into adulthood compared with those with EO-CD (APA, 2013); so, whether the observed deficits were limited in adolescence also needs to be answered. Longitudinal observation will enable us to uncover the developmental emergence of cortical markers of AO-CD, thereby helping us to identify those who are at high risk of developing such disorder and seeking protective factors that can delay or even prevent the onset of CD. Second, we did not include EO-CD samples in the present study, and so it remains unknown whether the observed AO-CD specific deficits reflect distinct pathophysiological processes or the heterogeneity of potential confounding variables in our samples compared with previous EO-CD samples. Nevertheless, given the relative abundance of evidence on EO-CD, it is still reasonable to conclude that our study initiated a valuable insight into this question. Therefore, to better understand the neural basis of CD with respect to age of onset, future work examining the brain structural features of both subtypes of CD in multi-center and larger samples is needed.
Conclusion
In summary, structural abnormalities identified in this AO-CD cohort are similar to those previously observed for EO-CD, except for the parietal cortex. Thus it is possible that the PCC/precuneus deficits identified in the present AO-CD cohort provide valuable insight into a potential distinction between the two subtypes of CD, despite their shared features. Importantly, in contrary to Moffitt's original notion, these and previous results suggest that the etiology of both subtypes share a biological vulnerability (Silberg et al. Reference Silberg, Moore and Rutter2014), and they reinforce a possibly quantitative, rather than qualitative, distinction between the etiology of the different onset of CD (Fairchild et al. Reference Fairchild, van Goozen, Calder and Goodyer2013). Following this line of reasoning, our study provides supportive evidence for the revision of this theory. However, further studies are needed to better address this issue.
Supplementary material
For supplementary material accompanying this paper visit http://dx.doi.org/10.1017/S0033291715001361
Acknowledgements
This work was supported by grants from the National Key Technologies R&D Program in China's 11th 5-year plan (grant number 2009BAI77B02); the Natural Science Foundation of China (grant numbers 81471384 and 81370034); and the Specialized Research Fund for the Doctoral Program of Higher Education (grant number 20130162110043), as well as the construct program of the key discipline in Hunan province (S.Y.).
Declaration of Interest
None.