I. INTRODUCTION
The depletion of fossil fuels and the disastrous environmental pollution arising from their combustion have been recognized as two main challenges in the near future. Reference Li, Yu, Low, Fang, Xiao and Chen1 Many techniques have been developed for the removal of pollutants from wastewaters to limit their impact on the environment. Photocatalytic treatment of waste water has proven to be an effective process for the degradation of dye pollutants. In recent years, ZnO nanomaterials have attracted tremendous interest due to their main applications in photocatalytic hydrogen generation and environmental pollution removal, Reference Mukhopadhyay, Das, Maity, Ghosh and Devi2–Reference Girish Kumar and Koteswara Rao4 other semiconductors such as TiO2, GaP, GaAs, InP, ZnS, CdS, ZnSe, etc. have been used for environmental remediation. Reference Chen, Liu and Huang5–Reference Hu, Duan, Gao, Chen and Peng17 To enhance the photocatalytic activity of ZnO nanorods, many efforts have been done to improve charge separation duration. This includes deposition of noble metal such as Au, Reference Georgekutty, Seery and Pillai18,Reference Zhang, Liu and Kang19 nonmetallic elements doping (e.g., C, N, S), Reference Patil, Patil and Pardeshi20–Reference Shifu, Wei, Sujuan and Wei22 rare-earth ion doping (e.g., Ce, La), Reference Yousefi, Amiri, Azimirad and Moshfegh23,Reference Anandan, Vinu, Sheeja Lovely, Gokulakrishnan, Srinivasu and Mori24 transitional metal doping (e.g., Ni, Co, Mn, Fe, Cu), Reference Zhao, Wang, Yan, Yang, Lei, Zhou, Huang, Gu and Zhang25–Reference Mohan, Krishnamoorthy and Kim29 and coupling of oxide semiconductors. Reference Cai, Cai, Liu, Deng, Wang and Djerdj30
Zinc oxide is a very interesting semiconducting material with good environmental stability and low cost when compared with other nanosized transition metal oxides. The doping of Ni in ZnO is expected to modify the absorption, photocatalytic, and other physical or chemical properties of ZnO because of the different structure of the electronic shell and the similar size of Ni2+ (0.069 nm) and Zn2+ (0.074 nm). Therefore, it has become important to systematically study ZnO with Ni doping. For example, studies on Ni-doped ZnO (Ni–ZnO) nanostructures prepared by sputtering, precipitation, and spray pyrolysis methods have also been reported. Reference Siddheswaran, Savková, Medlín, Očenášek, Životský, Novak and Šutta31–Reference Yilmaz, McGlynn, Bacaksiz, Cullen and Chellappan37 However, the photocatalytic properties of Ni-doped ZnO hollow microspheres have rarely been described.
Herein, we present a simple calcination approach to synthesize Ni-doped ZnO microspheres without soft or hard templates. Firstly, the Zn1−x Ni x O (where x = 0.0, 0.010, 0.03, 0.05, 0.10) precursors were synthesized by a precipitation technique. Then, the product was obtained by calcining the precursors at 500 °C for 2 h. Furthermore, the photodegradation of methylene blue (MB) was used to evaluate the photocatalytic performance of the as-synthesized samples under ultraviolet (UV) light irradiation.
II. EXPERIMENTAL SECTION
A. Material
All the chemical reagents used in this work, including nickel nitrate hexahydrate (Ni(NO3)2·6H2O), zinc nitrate hexahydrate (Zn(NO3)2·6H2O), hexamethylene tetramine (C6H12N4), trisodium citrate (C6H5Na3O7), ethanol (C2H5OH), and MB (C16H18ClN3S), were of analytical grade. Deionized water was used throughout the experiment.
B. Methods
1. Synthesis of pure ZnO microspheres
In a typical synthesis process, 1.2 mmol zinc nitrate hexahydrate (Zn(NO3)2·6H2O), 1.2 mmol hexamethylene tetramine, and 0.3 mmol trisodium citrate were dissolved in 80 mL deionized water to form a clear solution, the mixed solution was transferred into a 100 mL Teflon-lined stainless steel autoclave and heated at 90 °C for 4 h. The precipitate was centrifuged and washed several times with deionized water and absolute ethanol, and then dried at 60 °C for 12 h. Finally, hierarchical porous ZnO microspheres were obtained by calcining the precursor at 500 °C for 2 h in air.
2. Synthesis of Ni-doped ZnO microspheres
In a typical synthesis process, 1.2 mmol zinc nitrate hexahydrate (Zn(NO3)2·6H2O), 0.012 mmol nickel nitrate hexahydrate (Ni(NO3)2·6H2O), 1.212 mmol hexamethylene tetramine, and 0.3 mmol trisodium citrate were dissolved in 80 mL deionized water to form a clear solution, the mixed solution was transferred into a 100 mL Teflon-lined stainless steel autoclave and heated at 90 °C for 4 h. The precipitate was centrifuged and washed several times with deionized water and absolute ethanol, and then dried at 60 °C for 12 h. Finally, hierarchical porous Ni-doped ZnO microspheres were obtained by calcining the precursor at 500 °C for 2 h in air. The final products were denoted as 1 mol% Ni-doped ZnO. Similar procedure was performed under the same reaction condition with tunable dopant content, for example, 0.036 mmol nickel nitrate hexahydrate (Ni(NO3)2·6H2O), 0.06 mmol nickel nitrate hexahydrate (Ni(NO3)2·6H2O), and 0.12 mmol nickel nitrate hexahydrate (Ni(NO3)2·6H2O).
C. Characterization
The phase purity of the products was characterized by x-ray diffraction (XRD; Bruker AXSD8 ADVANCE X-ray diffractometer, Bruker Corporation, Karlsruhe, Germany) using a x-ray diffractometer with Cu Kα radiation (λ = 1.5418 Å). Scanning electron microscope images were obtained on a Hitachi S-4800 field emission scanning electron microscopy (FESEM; Hitachi Corp., Tokyo, Japan). High-resolution transmission electron microscopy and elemental mapping images were obtained on a FEI Tecnai G2 F30 S-TWIN field-emission transmission electron microscopy (operated at 300 kV; FEI Company, Hillsboro, Oregon). The ultraviolet-visible (UV-vis) diffuse reflectance spectra were obtained on a Varian Cary 5000 spectrophotometer (Santa Clara, California). Raman spectra were recorded by a InVia Raman microscope from Renishaw Co. (Gloucestershire, United Kingdom) using a 532 nm laser (Ar+ laser) excitation source with 10 mW power using a single 60 s accumulation. Photocurrents were measured on a Zahner workstation (Kronach, Germany) with a LW405 light (10 mW/cm2) as the accessory light source.
X-ray photoelectron spectra (XPS) were recorded on an ESCALAB 250Xi system (Thermo Fisher Scientific Inc., Waltham, Massachusetts). Prior to the analysis in the XPS system, all investigated materials, in the form of powder, were pasted onto the surface of the sample stage. All XPS measurements were performed using the ESCALAB 250Xi system without external illumination. A monochromated Al Kα x-ray source (1486.6 eV) was used and operated at a voltage of 15 kV. Peak fitting was performed using the Thermo Scientific Avantage software. XPS spectra were carried out with the binding energies calibrated using C 1s (284.8 eV). N2 adsorption–desorption isotherms were carried out using the Micromeritics Instrument Corporation 3Flex Surface Characterization Analyzer (Norcross, Georgia).
D. Photodegradation test
The photocatalytic activity of the as-synthesized pure and Ni-doped ZnO microspheres was tested in a SGY-IB photochemical reactor using MB degradation in aqueous solution under UV light irradiation. Typically, 10 mg of the as-synthesized pure ZnO or Ni-doped ZnO catalysts were added to 50 mL aqueous solution containing 1 × 10⁻⁵ M MB in a 100 mL beaker. The mixture was then placed in an ultrasonic water bath for 15 min, followed by stirring in the dark at ambient temperature for 30 min to achieve adsorption–desorption equilibrium for MB. Upon equilibrium, 4–5 mL of the suspension was extracted out to determine the initial concentration of MB solution, which was recorded as the base concentration C 0. The remaining mixture was transferred into a 50 mL quartz tube and illuminated with a 300 W Hg lamp. In the following 50 min, 4–5 mL of the suspension was extracted out every 10 min. Extracted suspensions were centrifuged immediately to separate any suspended solid. UV-vis spectra of the upper solution were measured using a Hitachi U3010 UV-vis spectrophotometer (Hitachi Corp.) to determine the concentration of remaining MB over time, which was recorded as C. The degradation rate of MB was estimated by the following equation:
 $${\rm{Degradation\ ratio}} = {{{C_0} - C} \over {{C_0}}} \times 100\%$$
III. RESULTS AND DISCUSSION
A. FT-IR and TGA curves of the precursor of pure and 5% Ni-doped ZnO
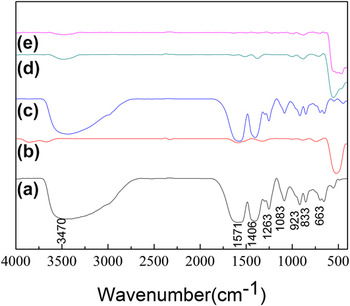
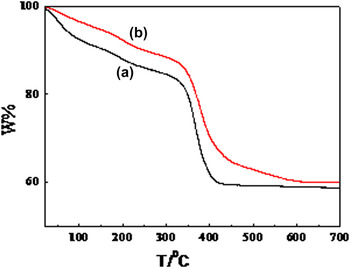
Figures 1(a) and 1(c) show a Fourier transform infrared spectroscopy (FT-IR) spectrum of the as-synthesized dried precursor of pure ZnO and 5% Ni-doped ZnO microspheres. The spectrum demonstrated strong and sharp absorption bands for the carboxylate groups of the coordinated citrates. Antisymmetric stretching vibrations γasym(COO−) appeared between 1570 and 1565 cm−1. The corresponding symmetric stretches γsym(COO−) appeared between 1410 and 1400 cm−1. All bands were shifted to lower frequencies relative to the free citric acid, indicating complexation to zinc. Reference Cho, Jang, Jung, Lee, Lee, Sung Lee and Lee38 The absence of typical absorption bands corresponding to undissociated carboxylic acid groups at 1700–1720 cm−1 indicated that each carboxylic acid group was deprotonated. Reference Cho, Jang, Jung, Lee, Lee, Sung Lee and Lee38,Reference Ge, Jing, Wang, Jamil, Liu, Liu and Zhang39 A strong O–H stretching band at 3470 cm−1 indicated the presence of adsorbed water. Thermogravimetric analysis (TGA) of the dried precursor of pure ZnO and 5% Ni-doped ZnO spheres was carried out to investigate the thermal properties of the materials [Figs. 2(a) and 2(b)]. Gradual weight loss at temperatures below 350 °C was attributed to dehydration of physically adsorbed water, which is an endothermic event. The weight loss above 350 °C was attributed to dehydration and removal of organic content. The precursor structures transformed into ZnO or Ni-doped ZnO as the temperature increased. The observed weight loss agreed well with the predicted value (∼41%).
FT-IR spectra of as-obtained samples. (a) Precursor of ZnO; (b) ZnO; (c) precursor of 5% Ni–ZnO; (d) 5% Ni–ZnO; (e) 5% Ni–ZnO after decomposition of methylene blue (MB).

TGA curve of (a) precursor of ZnO and (b) precursor of 5% Ni–ZnO.

B. XRD curves of as-synthesized samples
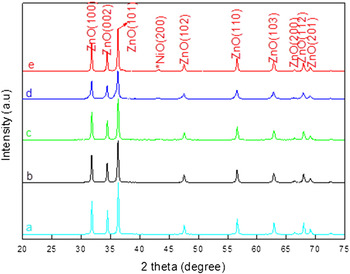
The XRD patterns of the as-synthesized Ni-doped ZnO are shown in Fig. 3. Peaks at 31.7, 34.4, 36.3, 47.5, 56.6, 62.3, 67.9, 69.1, and 77.4° were observed in all patterns, which are representing (100), (002), (101), (102), (110), (103), (112), (201), and (202) crystal planes of wurtzite ZnO (JCPDS 36-1451card), respectively. The strong and sharp peaks reveal the good crystalline nature of the samples. No secondary phase was detected, thereby indicating that the Ni is incorporated into the ZnO lattice. No significant difference could be observed between the XRD patterns of the pure ZnO photocatalyst and up to 5 mol% Ni-doped ZnO molar ratio. This phenomenon may be caused by that Ni-ion content is below the detection limits of the XRD instrument. However, new peak appearing at 2θ = 43.1° was found when the molar content of Ni atoms was increased to 10 mol%, which are attributed to (200) plane for the NiO crystalline structure.
XRD patterns of (a) pure ZnO, (b) 1 mol% Ni-doped ZnO, (c) 3 mol% Ni-doped ZnO, (d) 5 mol% Ni-doped ZnO, and (e) 10 mol% Ni-doped ZnO spheres.

C. Component analysis and Barrett–Emmett–Teller (BET) tests of ZnO samples
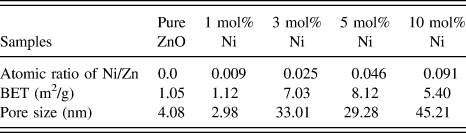
To understand the component of these pure ZnO and Ni-doped ZnO samples clearly, the total amount of Ni in ZnO was determined by wavelength dispersive X-ray fluorescence spectroscopy (WDXRF) and the results are shown in Table I. It shows that each of the samples has similar composition and if it contains Zn and Ni. Thus, it can be concluded that the as-synthesized samples are devoid of any other impurity atoms. It can also be found that the atomic ratio of Ni/Zn was to be about 0.0, 0.009, 0.025, 0.046, and 0.091, which is close to the experimental dopant concentration.
Elemental composition, pore size, and BET of the as-synthesized samples.
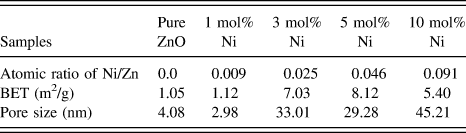
Furthermore, the obvious changes can be seen in BET and pore size of the as-synthesized pure ZnO and Ni-doped ZnO, which are shown in Table I. Comparing with pure ZnO, the specific surface area of Ni-doped ZnO samples has been enlarged, which may be suitable for increasing the photocatalytic activity of the Ni-doped ZnO samples.
D. FESEM and HRTEM images of the samples
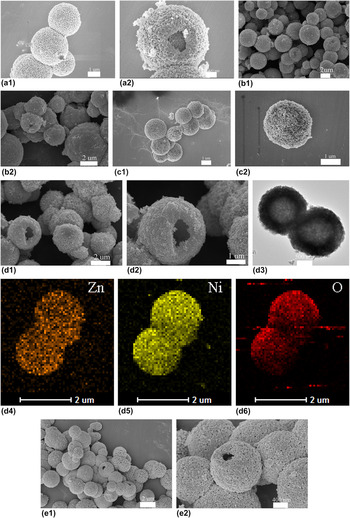
To describe the morphology of the as-synthesized samples, FESEM was carried out. Figures 4(a1) and 4(a2) show the FESEM images of pure ZnO sample. It can be found that all the as-synthesized pure ZnO samples are composed of hollow structures with the diameters in the range of 2–3 mm, which is assembled by a large amount of nanoparticles. The morphology of ZnO with various Ni doping amounts were also investigated by the FESEM and shown in Figs. 4(b)–4(d). Further increasing the Ni doping amount, the morphology of the spheres is rarely changed, a porous structure still exists with internal size of pores remaining unchanged.
(a1, a1) FESEM images of pure ZnO; (b1, b2) FESEM images of 1 mol% Ni-doped ZnO; (c1, c2) FESEM images of 3 mol% Ni-doped ZnO hollow spheres; (d1, d2) FESEM images of 5 mol% Ni-doped ZnO hollow spheres; (d3) HRTEM images of the as-synthesized 5 mol% Ni-doped ZnO; (d4, d5) HRSTEM-EDS mapping results of as-synthesized 5 mol% Ni-doped ZnO; (d6) HRSTEM-EDS mapping results of the as-synthesized 5 mol% Ni-doped ZnO; and (e1, e2) FESEM images of 10 mol% Ni-doped ZnO hollow spheres.

To confirm that the as-synthesized 5 mol% Ni-doped ZnO sample has the uniform structure, the composition analyses of the 5 mol% Ni-doped ZnO sample were characterized by high-resolution electron microscopy (HREM) energy dispersive X-ray spectroscopy (EDS) mapping (scanning model of HRTEM) using a FEI F30 microscope equipped with an energy dispersive X-ray analysis (EDAX; FEI Company) energy EDS. High-resolution scanning transmission electron microscopy (HRSTEM) EDS mapping results in Figs. 4(d3)–4(d6) of the as-synthesized 5 mol% Ni-doped ZnO sample revealed that the composition of the sample contains Ni, Zn, and O. Thus, it can be concluded that the as-synthesized 5 mol% Ni-doped ZnO samples were devoid of any other impurity. Moreover, it can also be seen in Figs. 4(d3)–4(d6) that Ni atoms were uniformly distributed in ZnO.
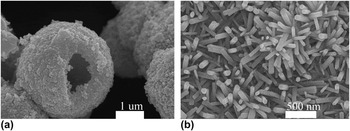
In this synthetic process, trisodium citrate (C6H5Na3O7) plays a key role to determine the morphology of target materials. When Zn(NO3)2 and trisodium citrate were mixed in distilled water at room temperature, zinc citrate was formed, which may behave as a template in the following process of the reaction. When the zinc citrate was annealed at 500 °C for 2 h, it would dehydrate and convert into ZnO microspheres. To investigate whether the additive C6H5Na3O7 played an important role in gaining Ni-doped ZnO microspheres, control experiment was also conducted without adding C6H5Na3O7. It can be seen from the FESEM images in Figs. 5(d) and 5(f) that only Ni-doped ZnO nanorods were obtained, in the absence of C6H5Na3O7.
FESEM images of 5 mol% Ni-doped ZnO by (a) adding C6H5Na3O7 and (b) without C6H5Na3O7.

E. XPS spectra of the samples
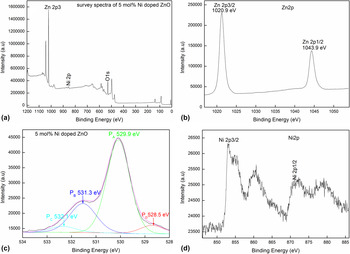
To clarify the elemental composition and chemical state of the as-synthesized 5 mol% Ni-doped ZnO microspheres, XPS spectra were carried out with the binding energies calibrated using C 1s (284.8 eV), as shown in Fig. 6. The peaks can be ascribed to Zn, O, C, and Ni [Fig. 6(a)] confirming that the sample is prepared comparing to the only Zn, O, and C elements present in the 5 mol% Ni-doped ZnO microspheres [Fig. 6(b)]. High-resolution spectra of Zn, O, and Ni species obtained from 5 mol% Ni-doped ZnO microspheres are shown in Figs. 6(b)–6(d). Two strong peaks in Fig. 6(b) centered at 1020.9 and 1043.9 eV, which are in agreement with the binding energies of Zn 2p3/2 and Zn 2p1/2, respectively. In Figs. 6(c), O 1s profile is asymmetric and can be fitted into two symmetrical peaks at 528.5 eV (red line), 529.9 eV (green line), 531.3 eV (blue line), and 532.1 eV (cyan line). The peak centered at 528.5 eV can be assigned to atomic oxygen with an ionic Zn–O bond, as reported by the previous literature. Reference Schwartz, Kittilatved and Gamelin40 The peaks at 529.9 eV originated from the lattice oxygen of ZnO. Furthermore, the peaks centered at 531.3 eV and 532.1 eV for adsorbed oxygen and adsorbed OH groups, respectively. Reference Yin, Chen, Yang, Song, Chai, Zhong, Qian and Ibrahim41 Accordingly, in Fig. 5(d), the Ni 2p3/2 and Ni 2p1/2 are at 853.3 and 871.1 eV, respectively. They are different either from Ni at 852.3 eV or Ni 2p3/2 of Ni2O3 at 856.7 eV, but very close to Ni 2p3/2 of NiO at 854.4 eV. Reference Boronin, Koscheev and Zhidomirov42 In addition, the peaks at 860.6 and 876.8 eV are satellite peaks of Ni 2p3/2 and Ni 2p1/2, respectively, which also proved the existence of Ni2+ in the as-synthesized Ni-doped ZnO sample.
XPS spectra of the as-synthesized (a, b, c, d) 5 mol% Ni-doped ZnO microspheres.

F. UV-vis diffuse reflectance spectra
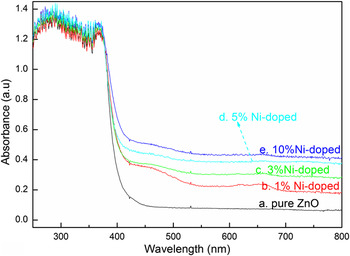
The optical absorption spectra of undoped and Zn1−x Ni x O (where x = 0.0, 0.010, 0.03, 0.05, 0.10) samples by UV-DRS spectrum in the range of 200–800 nm were presented. From Fig. 7, it can be seen that the excitonic absorption peak of the as-prepared pure and Ni-doped ZnO samples appears around 365 nm, which is the absorption edge of ZnO. The excitonic absorption peak of the as-prepared undoped and Ni-doped samples becomes broad as the molar ratio increases. Relative to the pure ZnO and normal Ni-doped ZnO counterpart, the Ni-doped ZnO microspheres possess higher excitonic peaks in UV region (365 nm). This may increase the UV photocatalytic activity to some extent.
Diffuse reflectance UV-vis spectra of the as-synthesized ZnO samples.

G. Photocatalytic performance
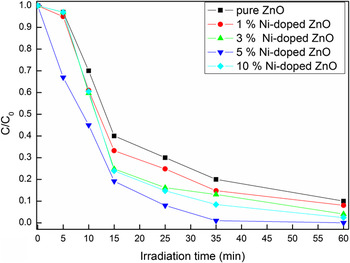
The absorption profiles of organic dyes (MB) during the photocatalytic process are presented in Fig. 8. Compared with photocatalytic activities of other three samples, 5 mol% Ni-doped ZnO shows the best performance, which can be seen in Fig. 8. Furthermore, the photodegradation of MB over the as-synthesized pure ZnO and Ni-doped ZnO samples at different Ni contents was 60%, 70%, 80%, and 90% after 25 min of UV light irradiation, respectively.
Photocatalytic degradation of MB with the as-synthesized pure and Ni-doped ZnO samples under UV irradiation.

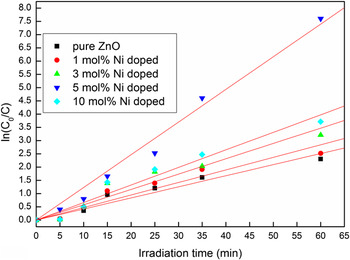
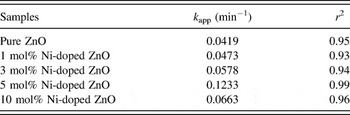
For a better understanding of the photocatalytic activities of the as-prepared pure ZnO and Ni-doped ZnO hollow microspheres, the kinetic analysis of MB degradation is also discussed in terms of Langmuir Hinshel wood model. At low MB concentrations, the above model can be described as first-order kinetics model Reference Mukhopadhyay, Das, Maity, Ghosh and Devi2 : ln(C 0/C) = k app t, where C 0 and C are the initial and reaction concentration of MB, k app is the apparent rate constant, and t is the reaction time. In the above model, the apparent rate constant enables one to determine the photocatalytic activities of different photocatalysts. Figure 9 plots the kinetic curves for MB degradation, and a linear relationship was observed between ln(C 0/C) and the reaction time (r 2 > 0.93). The apparent rate constants (k app) of MB, obtained from the slopes, are listed in Table II. It was observed in Table II that the photodegradation of MB by the as-synthesized samples followed first-order kinetics. Furthermore, as seen in Fig. 9 and Table II, the photocatalytic activity of the as-synthesized Ni-doped ZnO microspheres is higher than that of pure ZnO for the photodegradation of MB under the same conditions. For example, the k app of 5 mol% Ni-doped ZnO is 0.1233 min−1, which is nearly 2.94 times as that of pure ZnO.
The kinetic curves of the as-synthesized photocatalysts for MB degradation.

Degradation parameter of MB by the photocatalysts.

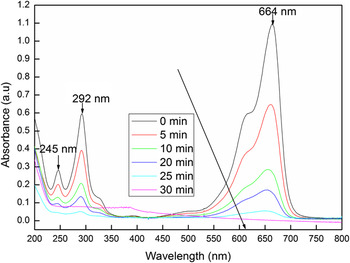
Furthermore, changes in the absorbance profiles of MB solution in the presence of the as-synthesized 5 mol% Ni-doped ZnO hollow microspheres under UV light irradiation are shown in Fig. 10. Three characteristic peaks (245 nm, 292 nm, and 664 nm) are observed, and maximum absorption occurs at 664 nm. With the irradiation time increasing, the peaks at 245 nm, 292 nm, and 664 nm reduced dramatically. The bands at 245 nm, 292 nm, and 664 nm became very weak in 60 min, suggesting almost complete photodegradation of MB. Reference Major, Kumar, Bhatnagar and Chopra43,Reference Islam, Ghosh, Chopra and Acharya44
Changes in the absorbance profiles of MB solution in the presence of 5 mol% Ni-doped ZnO hollow microspheres under UV light irradiation.

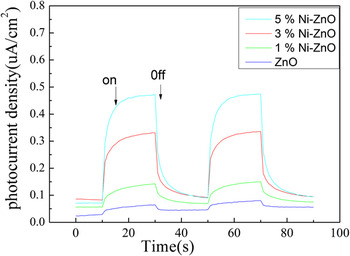
Photocurrents for the as-synthesized Ni–ZnO and ZnO electrodes were also measured on a Zahner workstation (Zahner, German) with a LW405 light (10 mW/cm2) as the accessory light source to investigate the electronic interaction between NiO and ZnO (Fig. 11). It was clear that fast and uniform photocurrent responses were observed in both electrodes, and the photoresponsive phenomenon was entirely reversible. Under UV light irradiation, the photocurrent density of the Ni–ZnO electrode was higher than that of the pure ZnO electrode (Fig. 11). The photocurrent enhancement of the Ni–ZnO photocatalyst indicated an enhanced photoinduced electrons and holes separation when comparing with pure ZnO.
Photocurrents of ZnO and Ni–ZnO electrodes under UV light irradiation.

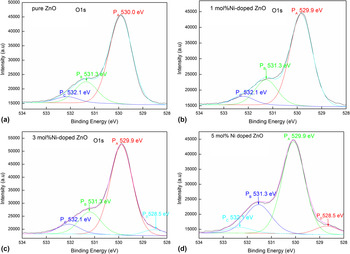
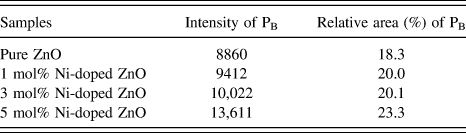
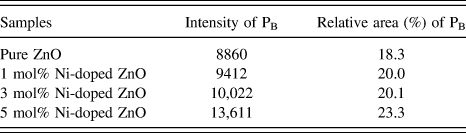
As reported in the previous literature Reference Chen, Wang, Yu, Pei, Bai, Sun, Huang and Wen45 that the O 1s peaks can be fitted into four Gaussian peaks: (i) the component at the lower binding energy side (530.0 ± 0.2 eV) can be attributed to O2− ions in wurtzite structure of hexagonal Zn2+ ion array, surrounded by Zn atoms with their full complement of the nearest neighbor O2− ions, (ii) the medium binding energy (531.1 ± 0.2 eV) is associated with O2− ions in oxygen-deficient regions within the matrix of ZnO Reference Fan and Goodenough46 and (iii) the higher binding energy peak (532.1 ± 0.2 eV) is usually attributed to the presence of loosely bound oxygen species on the surface of the sample. As it is evident from the O 1s spectra of the samples (shown in Fig. 12), when the peaks are fitted with Gaussian function, the intensity and relative area of the peak corresponding to oxygen vacancy (PB peak) decreases with increase in the nickel content in the doped ZnO microspheres. The detailed information about the intensity and relative area of the peak corresponding to oxygen vacancy can be seen in Table III.
O 1s XPS spectra of (a) the pure ZnO samples, and (b, c, d) Ni-doped ZnO samples.

The intensity and relative area of the peak corresponding to oxygen vacancy (PB peak) in the as-synthesized samples.
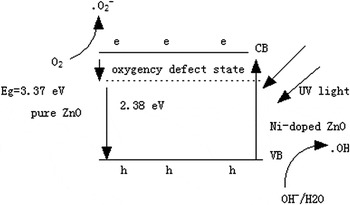
In our case, the proposed impurity level, which can enhance the electron–hole separation rate in ZnO microcrystals, is generated in the presence of vacancy oxygen
 $\left( {{\rm{V}}_{\rm{O}}^{ \cdot \cdot }} \right)$
defects in pure ZnO sample. As reported, the vacancy oxygen defects can easily work as electron acceptors to form single charged vacancy oxygen
 $\left( {{\rm{V}}_{\rm{O}}^ \cdot } \right)$
and simultaneously trap the photogenerated holes temporarily to reduce the surface recombination of electrons and holes.
Reference Zheng, Chen, Zhan, Lin, Zheng, Wei, Zhu and Zhu47
Furthermore, as for Ni-doped ZnO nanocrystals, Ni is proposed to be located at interstitial positions as shallow donors instead of zinc substitutional site in our system. The interstitial zinc (Zni) and interstitial Ni (Nii) defects may be benefit to the photocatalytic activities of the Ni-doped ZnO microcrystals.
The possible photocatalytic reaction process can be proposed as follows:
 $${\rm{ZnO}} + {\rm{h\gamma }} \to {\rm{e}}^ - + {\rm{h}}^ + \quad .$$
 $${\rm{V}}_{\rm{O}}^{ \cdot \cdot } + {\rm{e}}^ - \to {\rm{V}}_{\rm{O}}^ \cdot \quad ,$$
 $${\rm{V}}_{\rm{O}}^ \cdot + {\rm{O}}_2 \to {\rm{V}}_{\rm{O}}^{ \cdot \cdot } + \mathop {^ \cdot {\rm{O}}_2 }\nolimits^ - \quad ,$$
 $${{{\rm{Zn}}_{\rm{i}} } \mathord{\left/ {\vphantom {{{\rm{Zn}}_{\rm{i}} } {{\rm{Ni}}_{\rm{i}} }}} \right. \kern-\nulldelimiterspace} {{\rm{Ni}}_{\rm{i}} }} + {\rm{h}}^ + \to {{\mathop {{\rm{Zn}}_{\rm{i}} }\nolimits^ + } \mathord{\left/ {\vphantom {{\mathop {{\rm{Zn}}_{\rm{i}} }\nolimits^ + } {\mathop {{\rm{Ni}}_{\rm{i}} }\nolimits^ + }}} \right. \kern-\nulldelimiterspace} {\mathop {{\rm{Ni}}_{\rm{i}} }\nolimits^ + }} \quad ,$$
 $${{\mathop {{\rm{Zn}}_{\rm{i}} }\nolimits^ + } \mathord{\left/ {\vphantom {{\mathop {{\rm{Zn}}_{\rm{i}} }\nolimits^ + } {\mathop {{\rm{Ni}}_{\rm{i}} }\nolimits^ + }}} \right. \kern-\nulldelimiterspace} {\mathop {{\rm{Ni}}_{\rm{i}} }\nolimits^ + }} + {\rm{OH}}^ - \to {{{\rm{Zn}}_{\rm{i}} } \mathord{\left/ {\vphantom {{{\rm{Zn}}_{\rm{i}} } {{\rm{Ni}}_{\rm{i}} }}} \right. \kern-\nulldelimiterspace} {{\rm{Ni}}_{\rm{i}} }} + ^ \cdot {\rm{OH}} \quad .$$
The free radicals
 $\mathop {^ \cdot {{\rm{O}}_2}}\nolimits^ -$
and
 $^ \cdot {\rm{OH}}$
produced in the reactions can lead to destruction of the chromophoric structures of MB.
Reference Chandrasekhar, Nagabhushana, Vidya, Anantharaju, Sharma, Premkumar, Prashantha, Daruka, Shivakumara, Saraf and Nagaswarupa48
According to the above reaction process, the surface defects could serve as favorable trap sites of the electrons or holes to reduce their recombination and consequently increase the photocatalytic activities. Then, it can be deduced that the more the vacancy defects, the higher the photocatalytic activity is. With the increase of Ni concentration, the surface interstitial defects and vacancy oxygen concentration (such as Zni and Nii, or
 ${\rm{V}}_{\rm{O}}^{ \cdot \cdot }$
) and the corresponding photocatalytic activity of Ni-doped ZnO increased.
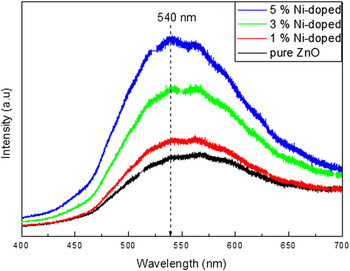
To confirm the presence of oxygen vacancies on the as-synthesized catalysts, photoluminescence (PL) spectroscopy was used to further explore the effects of different Ni/Zn ratios at room temperature. It can be seen that a strong green emission (∼540 nm), which is commonly due to oxygen vacancies defects, Reference Zheng, Chen, Zhan, Lin, Zheng, Wei, Zhu and Zhu47,Reference Sharma, Pandey, Zolnierkiewicz, Guskos and Rudowicz49 can also be found in the PL spectra of the as-synthesized ZnO samples.
Furthermore, the visible luminescence intensity increased with increase in Ni concentration. When Ni goes into substitutional positions in ZnO lattice, the green luminescence band is seen in PL spectra. Similar enhancement in PL spectra of Ni-doped ZnO has been observed where the same peak as observed in pure ZnO is enhanced due to Sn doping. Reference Bae, Na, Kang and Park50 When the ZnO nanorods are doped with Ni atoms, they later can be considered to exist as substitutionals that share the oxygen with Zn atoms and hence increase the defects of oxygen vacancy (excess Zn caused by Ni replacement), which leads to the enhancement of green emission. It might also suggest that the green emission of the as-synthesized ZnO samples may be attributed to oxygen vacancies defects at the surface or in the bulk.
Moreover, it can also be seen in BET, UV-vis spectra and photocurrent spectra of the as-synthesized ZnO samples that the enhanced photocatalytic activity of Ni-doped ZnO can also be attributed to enlarged surface area, higher excitonic peaks, and enhanced photoinduced electrons and holes separation of the Ni-doped ZnO sample (Fig. 13).
Photoluminescence spectra of the as-synthesized ZnO microspheres with (a) 0 mol%, (b) 1.0 mol%, (c) 3.0 mol%, and (d) 5.0 mol% doped Ni.

The possible schematic diagram for Ni-doped ZnO photocatalytic degradation of MB under UV light irradiation is shown in Scheme 1.
Possible schematic diagram for Ni-doped ZnO photocatalytic degradation of MB under UV light irradiation.

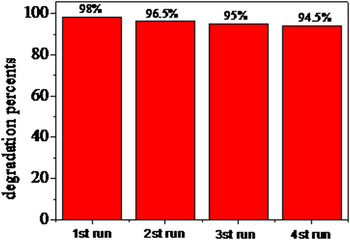
To investigate the stability of the doped photocatalysts, the photocatalytic stability of the 5 mol% Ni-doped ZnO was also tested and shown in Fig. 14. Figure 14 shows the time profile of the change in concentration of MB aqueous solution for 4 cycles. The results indicated that the 5 mol% Ni-doped ZnO sample exhibits a good cycling stability.
Stability evaluation for the 5 mol% Ni-doped ZnO photocatalyst.

IV. CONCLUSIONS
Ni-doped ZnO microspheres with an average diameter of 3 µm have been fabricated by a simple thermal calcination method at 500 °C and verified by XRD, XPS, FESEM, HRTEM, BET, and photocurrent measurement for the first time. The proposed method was simple, mild, and cost-effective, which may be suitable for industrial production of Ni-doped ZnO microspheres. XPS and PL spectra showed that the doping of Ni increased the intensity of surface oxygen interstitial defects. The surface defects caused by Ni doping could serve as favorable trap sites of the electrons or holes to reduce their recombination and consequently increase the photocatalytic activities. Photocatalytic tests indicated that the as-synthesized Ni-doped ZnO microspheres exhibited excellent photocatalytic activities after UV illumination for a short time (25 min), which show that the as synthesized Ni-doped ZnO microspheres may be a promising photocatalyst in removing organic pollutants from waste water. The enhanced UV light driven photocatalytic activity of the Ni-doped ZnO sample may be attributed to enlarged surface area, higher excitonic peaks, higher surface defects concentration, and enhanced photoinduced electrons and holes separation in the as-synthesized Ni-doped ZnO samples.
ACKNOWLEDGMENTS
We gratefully acknowledge financial support from the National Natural Science Foundation of China (21505118), the Natural Science Foundation of Jiangsu Province (BK2150438), Jiangsu Key Laboratory of Environmental Material and Environmental Engineering China (No.: K13065), Priority Academic Program Development of Jiangsu Higher Education Institutions and Senior visiting scholar program of Jiangsu Higher Vocational College (No.: 2015FX089).