Introduction
Aquatic macrophytes play important ecosystem roles in aquatic environments, as reflected in ecosystem services such as influencing algal biomass and fish abundance and retaining nutrients (Różańska-Boczula and Sender Reference Różańska-Boczula and Sender2025; Thomaz Reference Thomaz2023). For instance, submerged macrophytes provide several ecosystem services in clear-water ecosystems, such as improving water quality, producing dissolved oxygen, retaining nutrients, and providing habitat for various species, as well as cultural services, such as recreation. Emergent macrophytes provide regulatory services by treating wastewater in wetlands and removing nutrients from the soil; they also transfer oxygen to the rhizosphere, sequester carbon, reduce erosion, and, depending on species, provide food and building materials. Floating macrophytes can form mats on the water surface that block sunlight, thereby inhibiting phytoplankton growth; these plants also provide habitat for different animal species (insects, birds, and mammals) and retain nitrogen and phosphorus from the water in biomass (Janssen et al. Reference Janssen, Hilt, Kosten, de Klein, Paerl and Van de Waal2021; Schneider et al. Reference Scheneider, García, Martín-Closas and Chivas2015; Wetzel Reference Wetzel and Wetzel2001). However, due to climate change-related shifts, several of these services may be affected (Erős and Specziár Reference Erős and Specziár2024; García et al. Reference García, Bestion, Warfield and Yvon-Durocher2018; Luo et al. Reference Luo, Duan, Xu, Shen, Zhang, Xiao, Ni, Wang, Xin, Qi, Feng, Qiu, Jeppesen and Woolway2025).
Once both the growth and decomposition of aquatic plants are strongly temperature-dependent, changes in thermal climate patterns are expected (Chen and Coughenour Reference De-X and Coughenour1996; Cunha-Santino and Bianchini Reference Cunha-Santino and Bianchini2013; Madsen and Morgan Reference Madsen and Morgan2021; Wang et al. Reference Wang, Luo, Wu, Chen, Ge, Huang, Lin and Zhu2024; Xia et al. Reference Xia, Jianchu, Shaohua, Chenggang, Man, Wei, Jing and Puping2010). Species replacement and increased risk of biodiversity loss can occur due to the high growth rates of aquatic plants (Manca et al. Reference Manca, Benedetti-Cecchi, Bradshaw, Cabeza, Gustafsson, Norkko, Roslin, Thomas, White and Strona2024), which usually have population doubling times on the order of one to two weeks (Pezzato et al. Reference Pezzato, Petracco, Cunha-Santino and Bianchini2023). Furthermore, depending on how macrophyte detritus is incorporated into the aquatic ecosystem, rapid changes in water colour, trophic state (i.e., eutrophication), and dissolved oxygen balance can occur (He et al. Reference He, Song and Jiang2018; Panhota et al. Reference Panhota, Cunha-Santino and Bianchini2023; Wang et al. Reference Wang, Liu, Hu, Liang, Qiu and Wang2018). In addition, temperature increases result in geochemical alterations in sediments (Sironić et al. Reference Sironić, Barešić, Horvatinčić, Brozinčević, Vurnek and Kapelj2017) and in food webs (Marino et al. Reference Marino, Romero and Farjalla2018). In turn, the influence of temperature on a biological process can be expressed by the temperature coefficient (Q10), which quantifies the effect of a 10°C increase on a system or process (Wu et al. Reference Wu, Ye, Bridgham and Jin2021).
Aquatic plants are also essential organisms in the carbon and nitrogen cycles in freshwater ecosystems (Ren et al. Reference Ren, Wang, Ding, Li, Shen, Shen, Jiang and Qadeer2023). The first stage of their decomposition is leaching. During this process, compounds such as carbohydrates, lipids, tannins, and proteins (Song et al. Reference Song, Bai, Xu and Jiang2020), as well as nutrients such as phosphate (Wang et al. Reference Wang, Liu, Hu, Liang, Qiu and Wang2018) and nitrate (Wu et al. Reference Wu, Xing, Yong, Zhang, Hou, Liu, Guo and Zhao2024), are released. These autochthonous compounds contribute to the pool of dissolved organic matter (DOM) in the aquatic ecosystem (Min et al. Reference Min, Zhang, Li, Wang, Li and Liang2026). The DOM plays an important ecological role, both as an energy source and in the cycling of elements (Liu et al. Reference Liu, Zhao, Zhu, Qu, He, Giesy and Meng2018). DOM leached by macrophyte detritus can constitute an important source of carbon and nutrients, since each macrophyte species releases different amounts of carbon and inorganic elements (Cunha-Santino and Bianchini Reference Cunha-Santino and Bianchini2015), which are mineralized by microbial metabolic activity (Wu et al. Reference Wu, Xing, Yong, Zhang, Hou, Liu, Guo and Zhao2024).
The decomposition of organic matter involves various organisms and processes, culminating in the cycling of carbon and nutrients and the transport of energy through different trophic levels (del Giorgio and Cole Reference del Giorgio and Cole1998; Wu et al. Reference Wu, Wu, Liu, Zhang, Li, Zhou, Hess, Hazen, Yang and Chakraborty2018). The oxygen consumption resulting from the mineralization (i.e., the transformation of organic resources into inorganic resources; Hutchinson et al. Reference Hutchinson, Kessler, Wong, Hall, Leung, Jirapanjawat, Greening, Glud and Cook2024) of DOM can be an important factor in the dissolved oxygen balance in aquatic systems. The transformation of complex organic compounds into simpler organic and inorganic compounds occurs primarily through microbial catabolism (Banks and Frost Reference Banks and Frost2017). The cumulative consumption of dissolved oxygen during the aerobic mineralization of aquatic macrophyte leachates has been presented in different studies, which have shown that the highest rates occur in the initial stages (from days to the first week) of mineralization (Freitas et al. Reference Freitas, Cunha-Santino and Bianchini2023; Nunes et al. Reference Nunes, Cunha-Santino and Bianchini2007; Panhota et al. Reference Panhota, Cunha-Santino, Bianchini, Santos, Pires and Moschini2006, Reference Panhota, Cunha-Santino and Bianchini2023; Peret and Bianchini Reference Peret and Bianchini2004). The consumption of dissolved oxygen during the mineralization process can render the aquatic medium anoxic. The rates of mineralization depend primarily on temperature, redox potential (i.e., the presence or absence of oxygen), and the quality of the resource, i.e., its chemical composition (Song et al. Reference Song, Bai, Xu and Jiang2020). Under aerobic conditions, the products of decomposition are carbon dioxide, water, microorganisms (e.g., fungi, yeasts, and bacteria), and humic compounds (Doménech-Pascual et al. Reference Doménech-Pascual, Carrasco-Barea, Gich, Boadella, Freixinos Campillo, Gómez Cerezo, Butturini and Romani2024; Herzog et al. Reference Herzog, Hartmann, Frey, Stierli, Rumpel, Buchmann and Brunner2019). In contrast, anaerobic decomposition primarily produces methane, carbon dioxide, and hydrogen (Koyama et al. Reference Koyama, Yamamoto, Ishikawa, Ban and Toda2014; Moeller et al. Reference Moeller, Bauer, Wedwitschka, Stinner and Zehnsdorf2018), and is carried out primarily by Archaea (Cohen Reference Cohen and Cohen2011; Dodds and Whiles Reference Dodds and Whiles2020).
We hypothesized that the combination of higher temperature and higher dissolved oxygen availability enhanced mineralization of macrophyte leachates, shaping the C-turnover in aquatic ecosystems, with the quality (chemical composition) of leachate being a secondary factor. Therefore, in this study, the mass loss (DOC and total nitrogen) of leachates from 4 species of aquatic plants [the emergent rooted Myriophyllum aquaticum (Vell. Verdc., Haloragaceae), the floating Salvinia auriculata (Aubl., Salviniaceae), the amphibious Hedychium coronarium (J. König, Zingiberaceae), and the macroalgae Chara sp. (Linnaeus, Characeae)] were compared in aerobic and anaerobic environments, and at two temperatures (21 and 25°C).
Materials and methods
Sample collection
The water sample was collected from the Monjolinho Reservoir, a run-of-river reservoir with a hydraulic residence time of 2–23 days (Nogueira and Matsumura-Tundisi Reference Nogueira and Matsumura-Tundisi1994). The reservoir is in the municipality of São Carlos, São Paulo State, Brazil (22° 00′ S 47° 54′ W). This reservoir is classified as eutrophic (TP: 118.8 ± 89.1 µg L−1; TIN: 194.6 ± 97.8 µg L−1; DOC: 2.4 ± 1.1 mg L−1; DIC: 4.6 ± 1.3 mg L−1; BOD5: 2.8 ± 0.9 mg L−1; TSS: 48.8 ± 10.3 mg L−1; turbidity: 11.9 ± 10.7 NTU; electrical conductivity: 41.6 ± 5.1 µS cm−1), small (area: 4.69 ha, and total volume: 73,251 m3), and shallow (depth ranging from 1.5 m to 3.0 m); Santos et al. (Reference Santos, Cunha-Santino and Bianchini2011). In the reservoir, specimens of the aquatic macrophytes Myriophyllum aquaticum (parrot feather), Salvinia auriculata (eared watermoss), and Hedychium coronarium (white ginger lily) were also collected and washed. Specimens of the macroalgae Chara sp. (muskgrass) were obtained at the Experimental Garden of the Botany Department (UFSCar).
In the laboratory, the plants were rewashed in running water to remove any adhering material (Pagioro and Thomaz Reference Pagioro and Thomaz1999) and kept in an oven at 50°C (≈ 48 h), until they reached a constant mass (Wetzel and Likens Reference Wetzel and Likens2000).
Experiment setup
The water sample (ca. 50 L) was vacuum-filtered (diapump vacuum compressor, Fanem) through ester-mixture membrane filters (Ø: 0.45 µm). This procedure was used to suppress interference from bioseston (as plankton and particulate organic matter) in the kinetic results and mass balances.
After drying, the plant biomass was crushed (Willye-type mill, TE-650, Tecnal). To obtain the leachate extracts, the plants were mixed in samples of distilled water, previously sterilized (15 min at 121°C, at 1 atm; Ward (Reference Ward, Hauer and Lamberti2007) in a vertical autoclave (Phoenix). The leachates were obtained by cold extraction, at 4°C, for 24 h (Møller et al. Reference Møller, Miller and Kjøller1999).
Each mineralization chamber (polystyrene bottles, volume: 270 ml) was prepared with filtered reservoir water and the leachate extract [initial concentrations of DOC in incubations (mg L−1): M. aquaticum = 96.75; H. coronarium = 76.24; S. auriculata = 117.78; Chara sp. = 76.78]; on average, the initial DOC concentration was 91.14 ± 19.30 mg L−1. The mineralization chambers (n = 144) were kept under controlled temperature (BOD chambers) in the dark at 21°C (the average water temperature of the Monjolinho Reservoir throughout the year; Santos et al. Reference Santos, Cunha-Santino and Bianchini2011) and at 25°C. The increased temperature was chosen by predicting an increase of more than 4°C in global temperature by 2100 (IPCC Reference Pachauri and Meyer2014). Half of the mineralization chambers were maintained under aerobic conditions by pumping filtered compressed air. Anaerobic conditions were established by bubbling nitrogen into the mineralization chambers at the beginning of the experiment, which were kept closed (to prevent oxygenation) throughout the experimental period.
On the predetermined sampling dates (days: 0, 1, 3, 5, 10, 15, 30, 45, 60, and 90), the concentrations of dissolved organic carbon (DOC) and total dissolved nitrogen were determined (TOC-L ASI-L, Shimadzu Total Organic Carbon Analyzer) from leachates. Dissolved phosphorus concentrations were determined using a colorimetric method (Williams Reference Williams2013). Electrical conductivity (EC) and pH were also determined using a conductivity metre (Digimed; model DM-3) and a pH metre (Qualxtron; model 8010).
Mathematical modelling
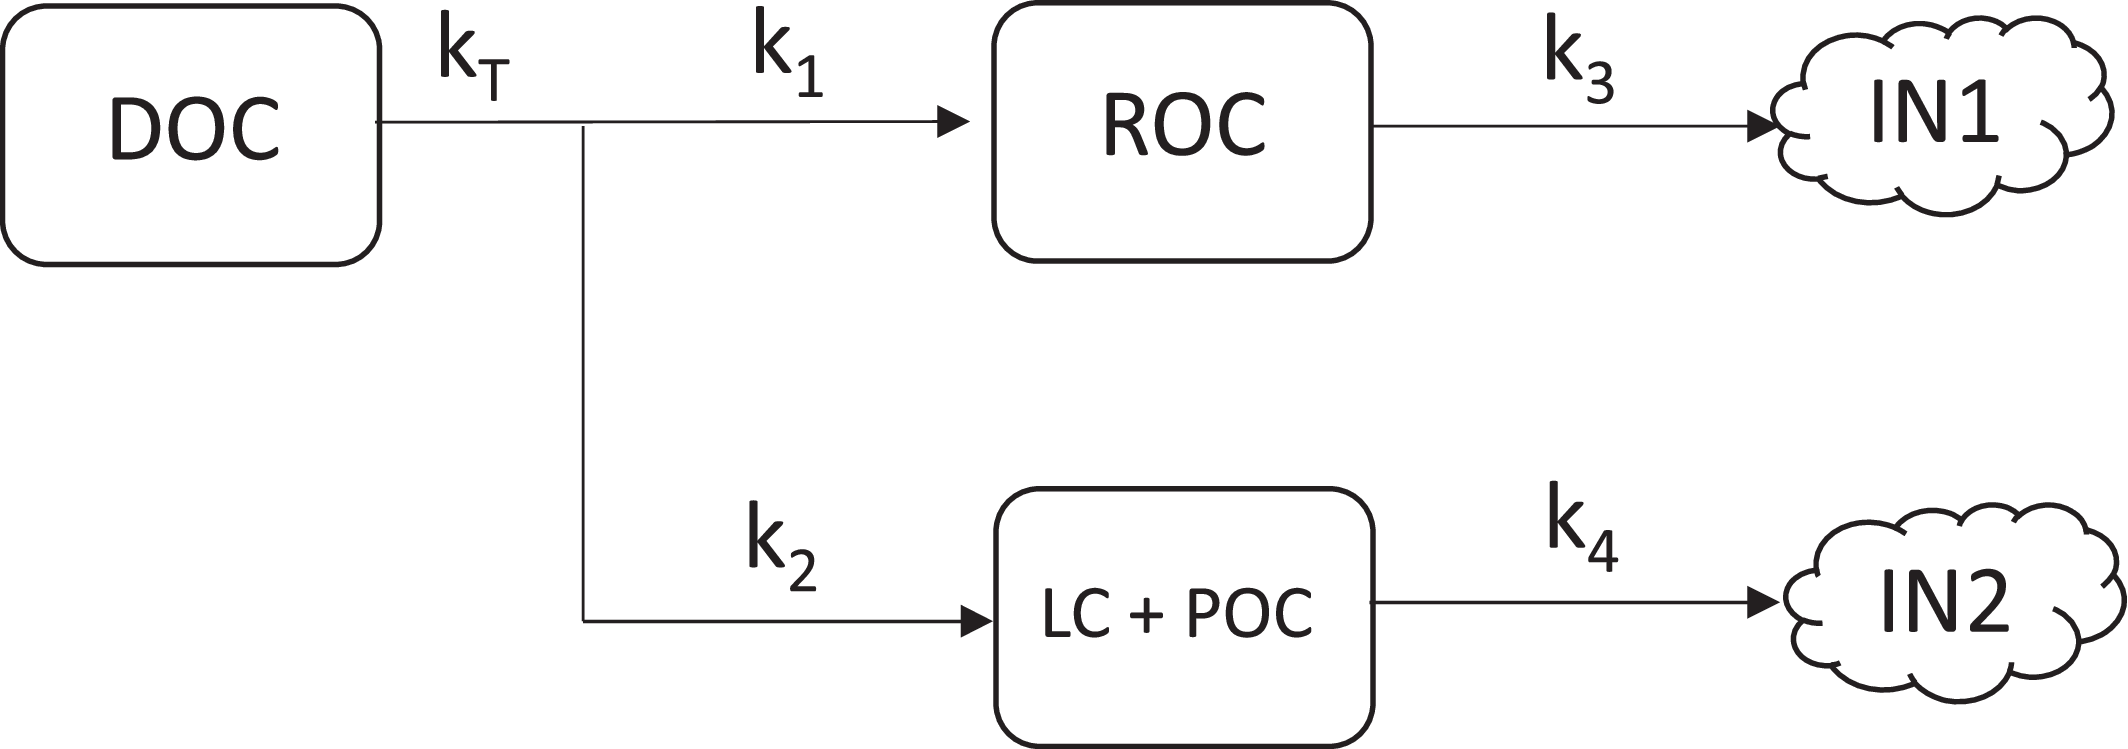
The C-mineralization model (Figure 1) represented by equations (1) to (5) encompasses two pathways for the DOC mass losses: (i) a slow process related to the mineralization of recalcitrant compounds and (ii) a rapid loss resulting from the oxidation of labile compounds and their conversion into POC via uptake by microorganisms (Panhota et al. Reference Panhota, Cunha-Santino and Bianchini2023). Temporal changes in DOC concentrations from incubations were used to determine model parameters. Beyond describing variations in carbon concentrations, this model aims to explain, for each mineralization route, the stoichiometry between the oxygen consumed by oxidized carbon (O/C). Thus, the outcomes of equations (4) and (5) (i.e., IN1 and IN2) were compared (at the same time) with the results of oxygen consumption from the experiments, and in each pathway its own O/C ratio was admitted (equations 6 and 7). The oxygen consumption results were obtained from similar experiments in which the incubations were maintained under the same conditions (Freitas et al. Reference Freitas, Cunha-Santino and Bianchini2023).
The kinetic model for DOC mineralization; DOC = dissolved organic carbon; ROC = refractory dissolved organic carbon; (LC + POC) = fraction composed by labile and particulate organic carbon fraction; kT = DOC decrease rate constant (= k1 + k2), d−1; k1 = ROC formation rate constant, d−1; k3 = ROC mineralization rate constant, d−1; k2 = LC + POC formation rate constant, d−1; k4 = LC + POC mineralization rate constant, d−1; IN1 and IN2 = inorganic carbon produced in each mineralization route (Panhota et al. Reference Panhota, Cunha-Santino and Bianchini2023).

 ${{dDOC} \over {dt}} = \; - {k_T}DOC$
 ${{dROC} \over {dt}} = \;{{{k_1}} \over {{k_T}}}DOC - {k_3}ROC$
 ${{d(LC + POC)} \over {dt}} = \;{{{k_2}} \over {{k_T}}}DOC - {k_4}\left( {LC + POC} \right)$
 ${{dI{N_1}} \over {dt}} = \;{k_3}ROC$
 ${{dI{N_2}} \over {dt}} = \;{k_4}\left( {LC + POC} \right)$
 ${{dO{C_1}} \over {dt}} = \;{\left( {{O \over C}} \right)_1} \times I{N_1}$
 ${{dO{C_2}} \over {dt}} = \;{\left( {{O \over C}} \right)_2} \times I{N_2}$
where DOC = dissolved organic carbon (in this case, macrophytes leachate), mg L−1; ROC = refractory dissolved organic carbon (mg L−1); (LC + POC) = fraction composed by labile and particulate organic carbon fraction (e.g., microorganisms, organic aggregates), mg L−1; kT = DOC decrease rate constant (i.e., ROC and (LC + POC) formation), d−1; kT = k1 + k2; k1 = ROC formation rate constant (d−1); k2 = (LC + POC) formation rate constant (d−1);
 ${k_{1}}/{k_{T}}$
= ROC formation yield;
 ${k_{2}}/{k_{T}}$
= (LC + POC) formation yield; k3 = ROC mineralization rate constant (d−1); k4 = (LC + POC) mineralization rate constant (d−1); IN1 and IN2 = inorganic carbon (CO2) produced in each mineralization route;
 $\left({O}/{C}\right)_{1}$
= stoichiometric relationship between the oxygen consumed by the oxidized carbon in relation to the ROC mineralization pathway;
 $\left({O}/{C}\right)_{2}$
= stoichiometric relationship between the oxygen consumed by the oxidized carbon in relation to the second mineralization pathway.
Based on the decrease in DOC concentrations, estimates of the ROC and (LC + POC) fractions and the determination of kT and k3 were performed. For this, kinetic fits were accomplished using nonlinear regressions, for which an iterative method (Levenberg-Marquardt algorithm) was employed (Press et al. Reference Press, Teukolsky, Vetterling and Flannery2002); the software used for these fittings was OriginPro (OriginLab Corporation). The parameters k4, (O/C)1, and (O/C)2 were also determined by an iterative method (Generalized Reduced Gradient nonlinear algorithm; Chapra and Canale Reference Chapra and Canale2021), comparing the results from the previously parameterized kinetic model and the experimental ones of oxygen consumption; the software utilized for these fittings was Excel (Microsoft). When needed, to stabilize and convergence of the calculations, the value of 2.67 was arbitrated to one of O/C = 2.67 as a starting point (this value correspond to the O/C from glucose oxidation, taken as a reference; Chapra Reference Chapra2008); thus, 2.67 is equivalent to bacterial respiratory quotient (RQ) equal 1 (moles produced CO2 per mole consumed O2; sense Berggren et al. Reference Berggren, Lapierre and del Giorgio2012), because RQ = 2.67 × (O/C)−1. These procedures enable the evaluation of oxygen consumption from different pathways of organic carbon mineralization.
The half-lives (t½) of the processes were estimated according to equation (8) (Kennedy and Blain Reference Kennedy and Blain2025), where k = reaction rate constants [ROC and LC + POC formation (kT), and its mineralization (k3, k4)], and day.
 ${t_{1/2}} = {{ln0.5} \over k}$
The effect of temperature on the mineralization of leachates was measured using the temperature coefficient (Q10) from equation (9) (Davidson et al. Reference Davidson, Samanta, Carmoni and Savage2012):
 ${Q_{10}} = {\left( {{{{k_2}} \over {{k_1}}}} \right)^{\left( {{{10} \over {\left( {{T_2} - \;{T_1}} \right)}}} \right)}}$
where k1 mineralization coefficient at the lower temperature; k2 mineralization coefficient at the higher temperature; T1 lower temperature; T2 higher temperature.
The k2/k1 ratios were obtained from the slopes of linear regressions comparing DOC consumption at 21°C (x-axis) and 25°C (y-axis).
Statistical analysis
To verify the normality of the data, the Shapiro–Wilk test was used. Since the data were not normally distributed, the Mann–Whitney test was used to assess differences between the two temperatures and between anaerobic and aerobic conditions. For the analysis of the effects of the different leachates at two temperatures (21 and 25°C) and redox conditions (aerobic and anaerobic), the data were subjected to the Kruskal–Wallis test and the Mann–Whitney test for post hoc comparisons. Results with a p-value less than 0.05 (>95% confidence) were considered statistically significant. Statistical analyses were performed using PAST software version 2.17c (Hammer et al. Reference Hammer, Harper and Ryan2001). The determination coefficient (r2) was used to compare the actual (experimental) and theoretical [ROC + (LC + POC)] values derived from the mineralization kinetic model. The adherence of the mineralization model (based on oxygen consumption) to the experimental oxygen consumption was verified using r2.
Results
Under anaerobic conditions, at both temperatures, the decrease in carbon was slightly lower than in aerobic incubations, and stabilization began only on the 60th day. On the other hand, consumption (i.e., C-mineralized) was higher under aerobic conditions, with a large portion of the labile carbon consumed in the first week. The labile fraction was consumed until approximately the 30th day, at which point assimilation began to stabilize (Figure 2). DOC concentrations decreased with dissolved oxygen availability, with greater reductions under aerobic than under anaerobic conditions (p < 0.05). Mineralization was intensified in the presence of dissolved oxygen, with ROC degradation predominating from day 30 onwards. However, degradation did not differ between the two temperatures (p > 0.05). The reductions in DOC across the different leachates did not differ significantly (p > 0.05), except under anaerobic conditions at 21°C (p < 0.05).
Temporal variation of dissolved organic carbon concentrations during macrophyte leachate mineralization under anaerobic and aerobic conditions and at different temperatures.

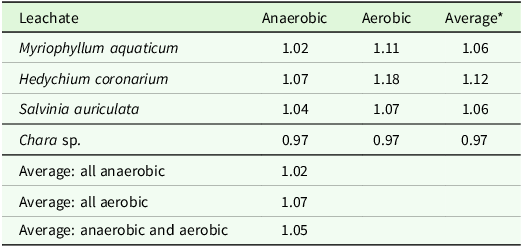
The Q10 values ranged from 0.97 to 1.18, reinforcing the weak influence of temperature on the mineralization (anaerobic and aerobic) of these leachates under the selected experimental conditions (Table 1). The mineralization of the H. coronarium leachate was the most affected by temperature, under both anaerobic (Q10: 1.07) and aerobic (Q10: 1.18) conditions. On the other hand, the mineralization of the Chara sp. leachate was the least sensitive process to this variable (Q10: 0.97). Both the individual values and the partial and global averages indicate that temperature was not a primary factor in mineralization; therefore, the remaining results were grouped and presented only in terms of oxygen availability.
Q10 values of macrophyte leachates (anaerobic and aerobic) mineralization

Table 1. Long description
A table comparing Q10 values of macrophyte leachates under anaerobic and aerobic conditions. The table has five rows and five columns. The columns are labeled Leachate, Anaerobic, Aerobic, and Average. The row labels are Myriophyllum aquaticum, Hedychium coronarium, Salvinia auriculata, Chara sp., Average: all anaerobic, Average: all aerobic, and Average: anaerobic and aerobic. The values in the table are as follows: Row 1: Myriophyllum aquaticum, 1.02, 1.11, 1.06. Row 2: Hedychium coronarium, 1.07, 1.18, 1.12. Row 3: Salvinia auriculata, 1.04, 1.07, 1.06. Row 4: Chara sp., 0.97, 0.97, 0.97. Row 5: Average: all anaerobic, 1.02,, . Row 6: Average: all aerobic,, 1.07, . Row 7: Average: anaerobic and aerobic,, , 1.05.
(*) considering the Q10 values of anaerobic and aerobic mineralization from the same leachate source.
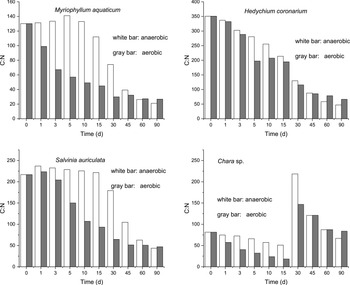
With regard to nitrogen, none of the leachates showed a significant difference with an increase of 4°C (p > 0.05). On the other hand, the samples showed significant differences among themselves (p < 0.05). With the exception of the mineralization of Chara sp. leachate, the C:N ratios tended to decrease progressively throughout the experiment, indicating that carbon mineralized more rapidly than nitrogen. However, under anaerobic conditions, the decreases in C:N values tended to be slower (Figure 3). Initially, the C:N ratio values ranged from 81.4 (Chara sp. leachate) to 350.9 (H. coronarium leachate), with intermediate values for S. auriculata and M. aquaticum leachates (216.9 and 130.2, respectively). At the end of the experiment, on average, the C:N values were higher in incubations with Chara sp. leachate (75.3), followed by the values from incubations with H. coronarium (56.8), S. auriculata (45.4), and M. aquaticum (23.9) leachates.
Temporal variation of C:N ratios during the mineralization of macrophyte leachates under anaerobic and aerobic conditions.

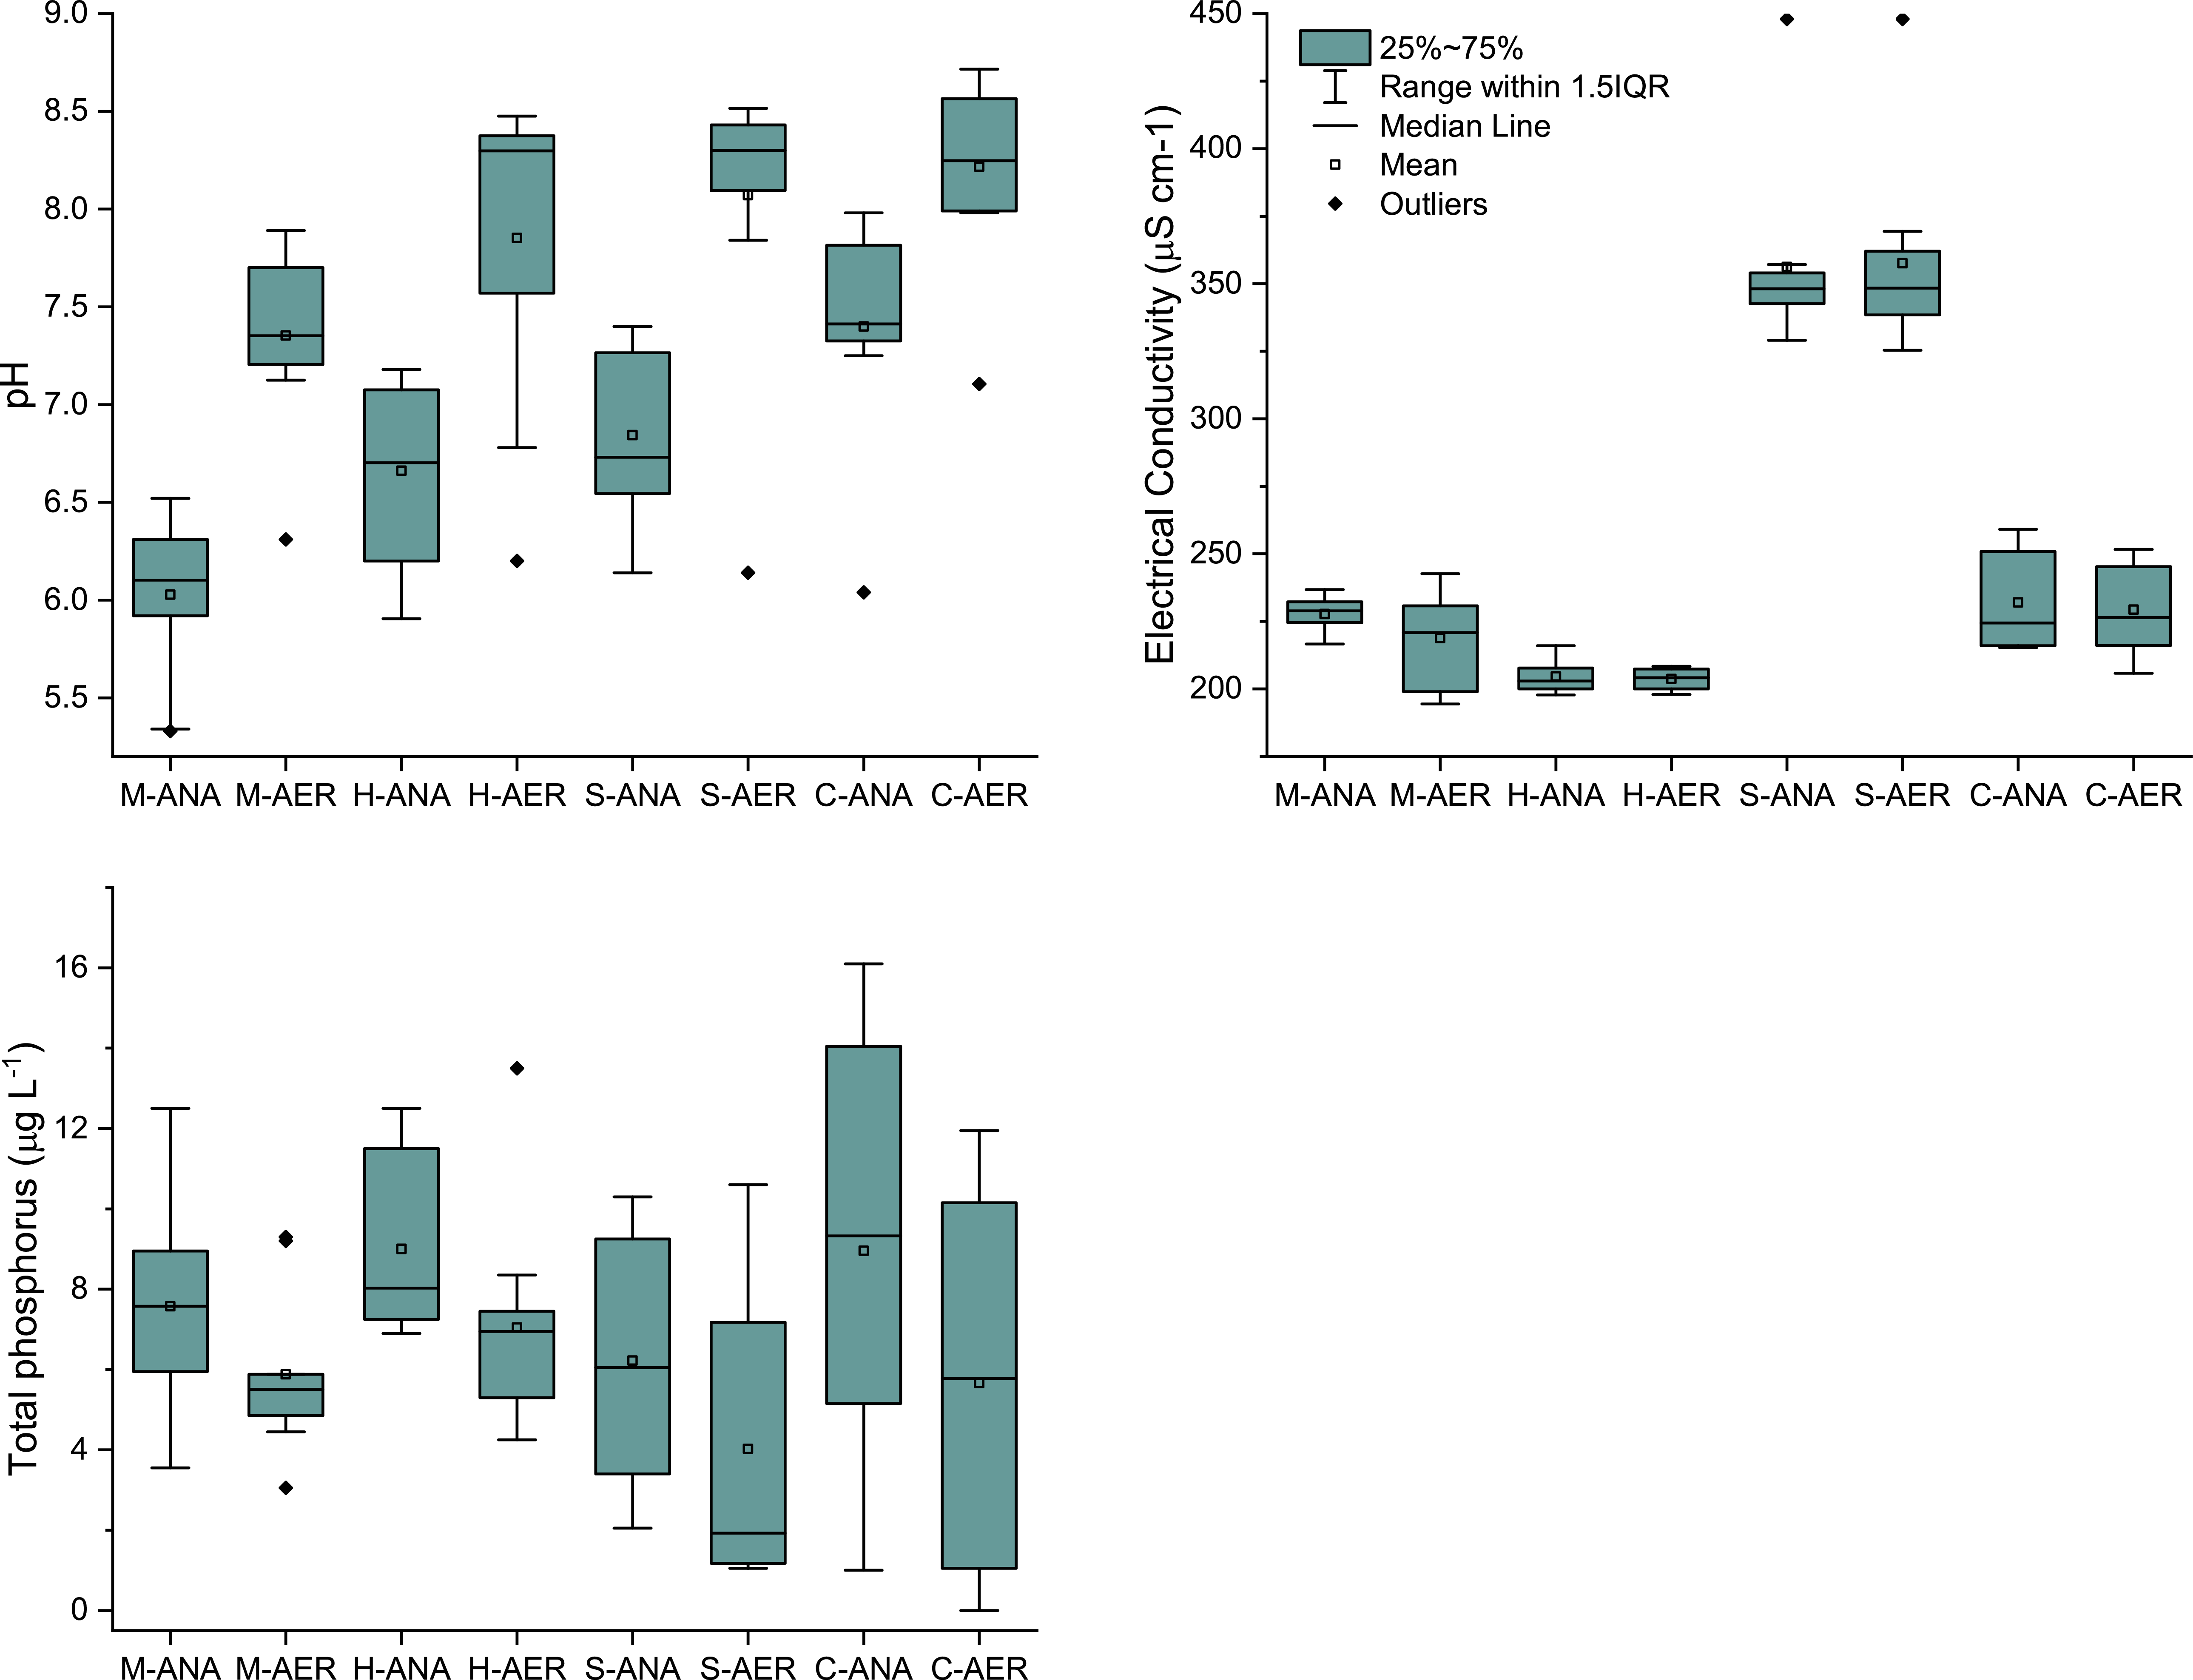
The pH variations across all incubations showed significant differences related to dissolved oxygen availability and leachate origin (p < 0.05); average pH values (± standard deviation) in incubations with leachates of M. aquaticum: 6.7 ± 0.8, S. H. coronarium: 7.3 ± 0.9, S. auriculata: 7.5 ± 0.8, and Chara sp.: 7.8 ± 0.6. However, for temperature, there was no significant difference between the respective incubations (p > 0.05); thus, regardless of oxygen availability (i.e., aerobic or anaerobic medium), incubations of leachates from the same origin showed no significant difference in pH at 21 and 25°C. For all leachates, the pH values under anaerobic conditions at both temperatures were lower (average pH 7.1 ± 0.9) than those under aerobic conditions (average pH 7.5 ± 0.8); thus, regardless of the leachate origin, pH variations indicate that, under anaerobic conditions, mineralization occurred predominantly in a more acidic medium than in incubations maintained under aerobic conditions (Figure 4).
Box plot of pH values, electrical conductivity, and phosphorus concentrations obtained in incubations with macrophyte leachates under anaerobic and aerobic conditions. M: Myriophyllum aquaticum; H: Hedychium coronarium; S: Salvinia auriculata; C: Chara sp.; ANA: anaerobic medium; AER: aerobic medium.

Figure 4. Long description
Panel A: A box plot shows pH values obtained in incubations with macrophyte leachates under anaerobic and aerobic conditions. The x-axis labels include M-ANA, M-AER, H-ANA, H-AER, S-ANA, S-AER, C-ANA, and C-AER, representing different macrophytes and conditions. The y-axis ranges from 5.5 to 9.0, with units in pH. The box plot includes markers for the 25th to 75th percentiles, median line, mean, and outliers. Panel B: A box plot displays electrical conductivity values with the same x-axis labels. The y-axis ranges from 200 to 450, with units in microsiemens per centimeter. The box plot includes markers for the 25th to 75th percentiles, median line, mean, and outliers. Panel C: A box plot shows total phosphorus concentrations with the same x-axis labels. The y-axis ranges from 0 to 16, with units in micrograms per liter. The box plot includes markers for the 25th to 75th percentiles, median line, mean, and outliers.
EC across the different leachates showed a significant difference (p < 0.05). Incubations with M. aquaticum leachate showed significant differences in EC as a function of dissolved oxygen availability (p < 0.05); in average, it was 4% lower, constituting the largest difference in EC values between the respective aerobic and anaerobic incubations. For all other leachates and treatments, no differences were observed in EC values across incubations of the same leachate, considering the availability of dissolved oxygen (i.e., aerobic or anaerobic medium) and temperature (p > 0.05). In all incubations, the EC values varied little from the initial values. In turn, under anaerobic conditions, the average values tended to be higher than under aerobic conditions (Figure 4). Leachates from S. auriculata showed the highest values (348–448 µS cm−1) and those from H. coronarium the lowest (198–207 µS cm−1).
When comparing phosphorus concentrations, a significant difference (p < 0.05) was observed between the leachates, and the temperature showed a significant difference only between the leachates of S. auriculata and Chara sp. (p < 0.05); in both cases, phosphorus concentrations at 25°C were lower (ca. 15–20%, respectively). Throughout the experiment, under all conditions, dissolved phosphorus concentrations ranged from 3.1 (M. aquaticum leachate) to 12 µg L−1 (Chara sp. leachate). However, the average incubation values were relatively close (ca. 4–9 µg L−1). Under aerobic conditions, the average phosphorus concentration was consistently lower (Figure 4).
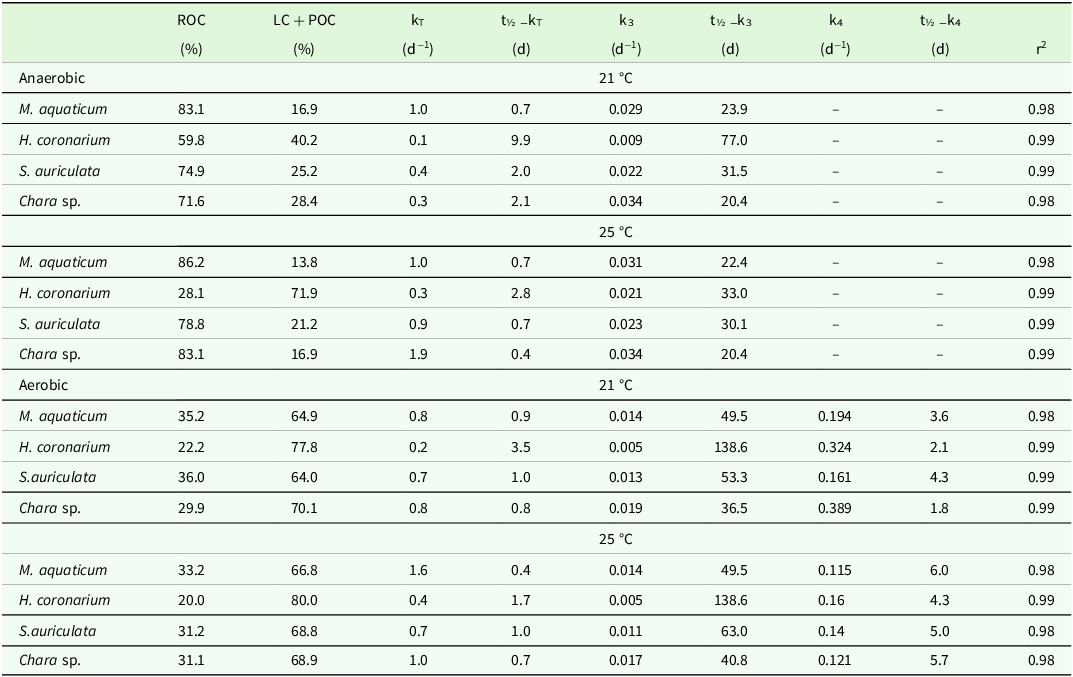
Table 2 presents the results of the model parameterization. Considering the average values, it can be observed that, under anaerobic conditions, the main mineralization pathway included the formation and degradation of ROC (70.7 %). In contrast, under aerobic conditions, this pathway was superseded, with the main route being the generation and degradation of LC + POC (70.2 %). The increase in temperature primarily raised the kT values in both conditions, especially in anaerobic environments. For all leachate mineralization types, the kT values were always higher than the k3 values, indicating intensified processes in the initial stages of the experiment. On average, the kT values were very similar in aerobic and anaerobic environments, with only a slight difference (1.06 times higher in aerobic conditions). The k3 values increased with temperature only in anaerobic environments (mean: 1.2-fold). On average, the k3 values were higher under anaerobic conditions (2.1-fold higher). The r2 values were high across all mathematical fits, ranging from 0.98 to 0.99, indicating the effectiveness of the proposed model.
Parameterization of the kinetic model of aquatic macrophyte leachate mineralization. RDOC = refractory dissolved organic carbon; LC + POC = labile dissolved organic carbon and particulate organic carbon; kT = RDOC and [LC + POC] formation rate constant; k3 = RDOC mineralization rate constant; k4 = LC + POC mineralization rate constant; t½ −k = half-life time; r2: determination coefficient

Table 2. Long description
The table presents kinetic model parameters for aquatic macrophyte leachate mineralization under anaerobic and aerobic conditions at 21°C and 25°C. It includes data for four species: M. aquaticum, H. coronarium, S. auriculata, and Chara sp. The table has 12 columns: ROC (percent), LC + POC (percent), kT (per day), t½ kT (days), k3 (per day), t½ k3 (days), k4 (per day), t½ k4 (days), and r2. Row labels include the species names and temperature conditions. Each row provides specific values for the parameters under the given conditions. Notable trends include variations in ROC and LC + POC percentages, kT, k3, and k4 values, and their half-lives across different species and conditions. The r2 values indicate the determination coefficient for the model fits.
The oxygen consumption associated with the aerobic mineralization of the leachates is shown in Figure 5. The lines refer to the results calculated by the model. As verified for k3 (i.e., ROC mineralization at aerobic environment; Table 2), the increase in temperature did not raise the values of k4 [i.e., the temperature did not intensify mineralization of (LC + POC)]; on the contrary, on average, the half-lives of the process were 2.6 and 5.2 days at 21 and 25°C, respectively (Table 2). It is also possible to verify that the values of the stoichiometric coefficients (O/C)1 (average: 3.2) were always higher than those of (O/C)2 (average: 1.8). In most cases, the (O/C)2 values tended to be higher at higher temperatures (average value at 21°C = 1.6 and at 25°C = 2.0); contrary to what was observed for (O/C)1 (average value at 21°C = 3.4 and at 25°C = 3.0). In this case, the r2 values were high in all fits.
Oxygen consumption due to aerobic mineralization of macrophyte leachates at 21 and 25°C. The points represent experimental values, and the line represents the values calculated by the mathematical model (i.e., equations 6 and 7).

Figure 5. Long description
Panel A: A line graph shows oxygen uptake over time for Myriophyllum aquaticum at 21 degrees Celsius. The x-axis represents time in days, and the y-axis represents oxygen uptake in milligrams per liter. The graph includes experimental values as points and a calculated model as a line. Panel B: A line graph shows oxygen uptake over time for Myriophyllum aquaticum at 25 degrees Celsius. The x-axis represents time in days, and the y-axis represents oxygen uptake in milligrams per liter. The graph includes experimental values as points and a calculated model as a line. Panel C: A line graph shows oxygen uptake over time for Hedychium coronarium at 21 degrees Celsius. The x-axis represents time in days, and the y-axis represents oxygen uptake in milligrams per liter. The graph includes experimental values as points and a calculated model as a line. Panel D: A line graph shows oxygen uptake over time for Hedychium coronarium at 25 degrees Celsius. The x-axis represents time in days, and the y-axis represents oxygen uptake in milligrams per liter. The graph includes experimental values as points and a calculated model as a line. Panel E: A line graph shows oxygen uptake over time for Salvinia auriculata at 21 degrees Celsius. The x-axis represents time in days, and the y-axis represents oxygen uptake in milligrams per liter. The graph includes experimental values as points and a calculated model as a line. Panel F: A line graph shows oxygen uptake over time for Salvinia auriculata at 25 degrees Celsius. The x-axis represents time in days, and the y-axis represents oxygen uptake in milligrams per liter. The graph includes experimental values as points and a calculated model as a line. Panel G: A line graph shows oxygen uptake over time for Chara sp. at 21 degrees Celsius. The x-axis represents time in days, and the y-axis represents oxygen uptake in milligrams per liter. The graph includes experimental values as points and a calculated model as a line. Panel H: A line graph shows oxygen uptake over time for Chara sp. at 25 degrees Celsius. The x-axis represents time in days, and the y-axis represents oxygen uptake in milligrams per liter. The graph includes experimental values as points and a calculated model as a line.
Discussion
Considering the intrinsic and extrinsic variables approached experimentally, the mineralization of leachates from the aquatic macrophytes M. aquaticum, H. coronarium, S. auriculata, and Chara sp. exhibited distinct changes over the experimental period. This demonstrates that different macrophyte ecological types can elicit distinct environmental responses, as observed in wetlands (Trindade et al. Reference Trindade, Landeiro and Schneck2018). On the other hand, the successful parameterization of the proposed model indicates the possibility of systematically evaluating and comparing experimental variations arising from different intrinsic and extrinsic mineralization conditions, such as leachate origin, temperature, and oxygen availability.
It was observed that reaction rates increase with temperature; therefore, the reaction rate constant can be related to temperature via the Arrhenius expression (Wu et al. Reference Wu, Ye, Bridgham and Jin2021). However, metabolic reactions are the sum of all biochemical reactions that are regulated by various extrinsic (e.g., light intensity, pH, temperature, substrate availability, osmotic pressure, and redox potential) and intrinsic (co-enzymes and enzymes) conditioning factors (Davidson and Janssens Reference Davidson and Janssens2006; Wallenstein and Weintraub Reference Wallenstein and Weintraub2008). Variations in Q10 can be attributed to enzyme activation and differences in microbial community composition (Alster et al. Reference Alster, Baas, Wallenstein, Johnson and von Fischer2016). Subtle temperature effects on energy activation may be apparent only over longer time intervals (Mikan et al. Reference Mikan, Schimel and Doyle2002). The metabolic dependence of any organism on temperature (Q10) is determined by the types of enzymes that catalyse primary production and respiration. Besides the temperature, the differences among Q10 values can also express the various conditioning factors of decomposition interdependence: (i) adaptability potential of microorganisms; (ii) physiological versatility (e.g., growth rate and enzyme production); (iii) the microbial community diversity, and (iv) density and biomass of microorganisms. It is possible that this parameter is also influenced by the resource availability and by the specificity of the decomposing microbiota to a substrate (Cunha-Santino and Bianchini Reference Cunha-Santino and Bianchini2010).
In the current study, temperature had a smaller influence on carbon mineralization and nutrient release, particularly on dissolved oxygen availability, relative to a 4°C increase. This is observed by the Q10 values close to 1. The reaction rate constants (k) and, consequently, their respective t½ values were also not strongly influenced by increases in temperature. The low effect of temperature on reaction rates suggests that the microorganisms in the incubations were within the ideal temperature range, considering that the effect of temperature on mineralization rates follows the optimum temperature curve function (Shugart et al. Reference Shugart, Goldstein, O.’Neill and Mankin1974), as verified in the growth and decomposition of aquatic plants (Carpenter and Adams Reference Carpenter and Adams1979; Carpenter Reference Carpenter1980; Pezzato et al. Reference Pezzato, Petracco, Cunha-Santino and Bianchini2023). In this context, the temperatures selected for this experiment are close to the range of the average water temperature of the Monjolinho reservoir (20.6 ± 3.3°C; Santos et al. Reference Santos, Cunha-Santino and Bianchini2011). In any case, the temperature increase can influence several events related to macrophyte decomposition (Park and Cho Reference Park and Cho2023; Velthuis et al. Reference Velthuis, Kosten, Aben, Kazanjian, Hilt, Peeters, van Donk and Bakker2018). Oxygen availability and temperature act synergistically during the mineralization of organic compounds (Passerini et al. Reference Passerini, Cunha-Santino and Bianchini2016). Observations in temperate environments have shown that temperature exerts a greater influence on decomposition than in lower latitudes (Velthuis et al. Reference Velthuis, van Deelen, van Donk, Zhang and Bakker2017). Furthermore, one consequence of temperature increases is the acceleration of biogeochemical cycles (Stuble et al. Reference Stuble, Ma, Liang, Luo, Classen and Souza2019; Velthuis et al. Reference Velthuis, Kosten, Aben, Kazanjian, Hilt, Peeters, van Donk and Bakker2018). Temperature also controls secondary microbial production in aquatic ecosystems (Adams et al. Reference Adams, Crump and Kling2010). Higher temperatures favour microbial production, which is positively related to secondary production (Freitas et al. Reference Freitas, Vieira, Moraes, Melo, Vieira and Sarmento2018).
Regarding oxygen availability, the decrease in carbon showed different rates for the four leachates. However, for nitrogen, each leachate exhibited distinct oscillations, suggesting that different sources of DOM decomposition produced distinct forms and concentrations of available nutrients (Wan et al. Reference Wan, Cao, Song, Cao and Zhou2023). Dissolved gases and compounds are important for maintaining the functioning of aquatic ecosystems, as they constitute a labile source of organic matter for other organisms (Lau and del Giorgio Reference Lau and del Giorgio2020; Fusi et al. Reference Fusi, Rigaud, Guadagnin, Barausse, Marasco, Daffonchio, Régis, Huchet, Camin, Pettit, Vina-Herbo and Giomi2023). The rapid assimilation of water-soluble compounds in aerobic environments and the predominance of ROC formation in anaerobic environments may explain the observed differences in carbon and nitrogen (Cunha-Santino and Bianchini Reference Cunha-Santino and Bianchini2015), despite the leachate origin. However, some of the variations in carbon mineralization values at 21 and 25°C may be explained by changes in the composition of the microbial communities present, since these were closed reactors (Cai et al. Reference Cai, Zhou, He, Tang, Guo, Shi, Gonsior and Jiao2019).
All treatments showed a similar pattern for phosphorus, with initial release into the system, followed by microbial mobilization and subsequent recycling throughout the experiment (Wang et al. Reference Wang, Liu, Hu, Liang, Qiu and Wang2018). This element is a limiting factor in aquatic ecosystems and, in tropical environments, is easily assimilated, resulting in very low concentrations in the medium (Amado et al. Reference Amado, Meirelles-Pereira, Vidal, Sarmento, Suhett, Farjalla, Cotner and Roland2013). In these systems, organic matter is a reservoir of phosphorus (Islam et al. Reference Islam, Jang, Eum, S-m, Shin, Lee, Choi and Kim2019). The release of nutrients by aquatic macrophytes is of great importance for regulating the phosphorus cycle (Liu et al. Reference Liu, Zhao, Zhu, Qu, He, Giesy and Meng2018). The concentrations of carbon, nitrogen, and phosphorus in macrophytes vary with environmental conditions and seasonality, altering their stoichiometric ratios (Costa and Henry Reference Costa and Henry2010). The C:N and C:P ratios in the particulate detritus and DOM tend to vary throughout decomposition, depending on the relative availability of phosphorus, nitrogen, and carbon in the environment (Bottino et al. Reference Bottino, Souza, Rocha, Cunha-Santino and Bianchini2021). The effectiveness of nutrient cycling will also depend on the community of microorganisms present (Logue et al. Reference Logue, Stedmon, Kellerman, Nielsen, Andersson, Laudon, Lindström and Kritzberg2016; Purahong et al. Reference Purahong, Wubet, Lentendu, Schloter, Pecyna, Kapturska, Hofrichter, Krüger and Buscot2016; Berg et al. Reference Berg, Rybakova, Fischer, Cernava, Vergès, Charles, Chen, Cocolin, Eversole, Corral, Kazou, Kinkel, Lange, Lima, Loy, Macklin, Maguin, Mauchline, McClure, Mitter, Ryan, Sarand, Smidt, Schelkle, Roume, Kiran, Selvin, Souza, van Overbeek, Singh, Wagner, Waish, Sessitsch and Schloter2020) and the type of autochthonous or allochthonous DOC source (Attermeyer et al. Reference Attermeyer, Catalán, Einarsdottir, Freixa, Groeneveld, Hawkes, Bergquist and Tranvik2018; Morling et al. Reference Morling, Herzsprung and Kamjunke2017; Suhett et al. Reference Suhett, Amado, Meirelles-Pereira, Scofield, Jacques, Laque and Farjalla2013). Temporal variations in C:N ratios evidenced the effect of leachate mineralization (i.e., CO2 production), making the remaining refractory organic compounds richer in nitrogen. This pattern is basically linked to the formation of humic compounds; in this case, several reactions (chemical and biochemical) are mentioned that result in the narrowing of the C:N ratio values. For example, aldehydes and phenolic acids undergo enzymatic conversion into quinones, which polymerize with amino acids to form macromolecules similar to humic substances (Tao et al. Reference Tao, Shen, Wen, Yang and Wei2026). Reducing sugars and amino acids, formed as byproducts of microbial metabolism, undergo non-enzymatic polymerization to form brown nitrogenous polymers. In addition to lignin decomposition products, these reactions also link the formation of humic substances to the condensation and polymerization of low-molecular-weight compounds (Du et al. Reference Du, Fu, Liu, Chai and Wu2025).
When dealing with mineralization in aqueous media, variations in pH and electrical conductivity (EC) are primarily due to ions generated and assimilated by microbial catabolism of the leachate. For example, a decrease in pH and an increase in EC can be attributed to the hydration of CO2 (generated by mineralization), which forms carbonic acid (H2CO3) and its subsequent dissociation into bicarbonate and carbonate. Another example of an event that alters pH and EC is nitrification of ammonium, which produces nitrate and H+ ions. In addition to the ions produced and assimilated, considering that DOM has an electrical charge, the composition and quantity of the leachate itself can contribute to more or less pronounced changes in pH and EC (Freitas et al. Reference Freitas, Cunha-Santino and Bianchini2023). Specifically, regarding oxygen availability, the results indicated greater H+ formation from anaerobic metabolism. The products resulting from anaerobic degradation are generally fatty acids and phenolic acids, which are consumed slowly. This occurs due to the presence of acidogenic microorganisms. Under anaerobic conditions, anaerobic and facultative microorganisms act, resulting in a drop in the medium pH (Fuentes et al. Reference Fuentes, Scenna, Aguirre and Mussati2008).
Unlike the results obtained in an experiment in which the mineralization of leachates was evaluated by determining oxygen consumption, when the temperature increased, the reaction rates (Q10: 1.36; Freitas et al. Reference Freitas, Cunha-Santino and Bianchini2023), the analysis of the kinetic parameters of mineralization (anaerobic and aerobic) in the current experiment does not allow the identification of temperature as the main modulating factor. The main differences occurred as a function of oxygen availability (i.e., predominance of anaerobic or aerobic metabolism). In contrast to anaerobic degradation, the presence of oxygen promoted the predominance of LC + POC fractions over ROC; however, under these conditions, the refractory fractions (ROC) showed a much longer half-life than in an anaerobic environment (practically double). All these variations ultimately attenuated the evidence for the expected effect of a 4°C increase on the processes (both aerobic and anaerobic).
The trend of increased aerobic mineralization with temperature was confirmed only when stoichiometric relationships were included in the mathematical model equations. In this case, the hypothesis that kinetic parameters (i.e., reaction rate constants) are sufficient to prove this cause-and-effect relationship failed. Considering that the original compositions of the leachates were maintained as the starting point in the incubations at 21 and 25°C, the inclusion of these stoichiometric relationships indicates that the increase in temperature favoured the predominance of specific metabolic pathways over increased reaction rates. These catabolic pathways, in turn, may also result from the differentiated predominance of organisms as a function of environmental changes (Panhota et al. Reference Panhota, Cunha-Santino and Bianchini2023; Zeng and Yang Reference Zeng and Yang2020); the distinct characteristics in quantity and quality of DOM derived from macrophytes can induce specific environmental consequences (Qu et al. Reference Qu, Xie, Lin, Bai, Zhu, Xie, Giesy and Wu2013). In general, this evidence underscores the importance of understanding qualitative events in biogeochemical processes in aquatic environments.
Conclusion
Oxygen availability was the most important factor in the cycling of aquatic macrophyte leachates. Within the selected temperature range (21–25°C), temperature may have played an important role in determining the predominant catabolic pathways. The composition of the leachates showed distinct patterns throughout the experiment, demonstrating that, in aquatic systems, the quality of organic matter influences carbon and nutrient cycling. Temperature variation, along with the availability of dissolved oxygen (i.e., the predominance of aerobic or anaerobic conditions), drives the mineralization of the dissolved fractions of aquatic macrophyte detritus and, consequently, the biogeochemical cycles of continental aquatic systems. Our results emphasize the importance of incorporating interactions among temperature, oxygen, and nutrient (N and P) content in models of the mineralization of leachate-derived DOC, which influence carbon cycling and nutrient availability in aquatic environments.
Financial support
This study was possible owing to the support of the Coordenação de Aperfeiçoamento de Pessoal de Nível Superior-Brasil – Financing Code 001; Conselho Nacional de Desenvolvimento Científico e Tecnológico (CNPq, proc. n°s: 305263/2014-5; 306264/2020-0) and due to the financing from Fundação de Amparo à Pesquisa do Estado de São Paulo (FAPESP, proc. n°: 2018/00348-0).
Competing interests
The authors declare none.