1. Introduction
The external environment is an important source of economic fluctuations. In the National Institute Global Econometric Model (NiGEM),Footnote 1 most of the OECD countries and major emerging markets are modelled separately and linked to each other via foreign trade as well as the interest rate–exchange rate nexus. The trade channel hinges critically on the specification of import demand, which is determined by relative prices and total demand. The latter means that the impact of shifts in individual demand components on imports depends on the respective expenditure weights only. However, Reference Bussière, Callegari, Ghironi, Sestieri and YamanoBussière et al. (2013) show that the import content of individual demand components differs substantially. We modify the import equation in NiGEM so as to account for different import contents of individual demand components. Following Reference Bussière, Callegari, Ghironi, Sestieri and YamanoBussière et al. (2013) as well as Reference Carreras, Kirby, Liadze and PiggottCarreras et al. (2016), we derive estimates of import intensities from international input-output tables. While Reference Carreras, Kirby, Liadze and PiggottCarreras et al. (2016) differentiated the demand variables in the short-run relationship within NiGEM's import equations for eleven European countries, we also modify the long-run relationship and apply this framework to 39 economies. Moreover, our weights in the short-run relationship reflect both the import content and the relative size of a demand component.
In order to study the implications of our modifications, we run three scenarios of relevance to the current macroeconomic outlook or policy debate with both the NiGEM default version and our modified framework: the US tax reform as approved by Congress in late 2017, a downside risk scenario of a ‘hard landing’ for the Chinese economy, and an upside risk scenario of a public investment push in Germany. Our simulations demonstrate that the differentiation of total demand in the import equation has important implications for simulation results. Due to a high import content, shocks which primarily affect private investment spending (such as a cut in corporate income tax rates) generate markedly stronger international spillovers (and weaker effects on domestic output) using the modified framework. By contrast, the impact of shifts in public expenditure, which is characterised by a low import content, on foreign output turns out to be weaker. In this context, we confirm that a temporary expansion of public investment in Germany is likely to have only small effects on real Gross Domestic Product (GDP) in other important economies (Deutsche Bundesbank, 2016a).
The remainder of the paper is organised as follows. Section 2 describes our data sources, the computation of import contents, and our adjustments to NiGEM's import equations. Section 3 highlights the implications of these changes by focusing on simulation results for the three aforementioned scenarios. Finally, section 4 concludes.
2. Methodology
The starting point for our model adjustments is the standard specification of import demand in NiGEM. The relevant equations are expressed in the usual error-correction form with two variables, total final expenditures (Dt) and relative import prices (PtIM / PtC), shaping the behaviour of real imports (IMt) over time t. Equation (1) illustrates this for the example of the US:

Individual expenditure components enter equation (1) implicitly since total expenditure is defined as the sum of private consumption (C t), government consumption (Gt), investment (It), and exports (EXt). Hence, all demand components carry unit weights in the long-run equilibrium relationship while their contribution to short-term dynamics via the growth rate of total final demand is governed by expenditure weights:

Intuitively, changes in demand components that account for a large fraction of total final spending, such as private consumption, have a particularly strong impact on import movements. The possibility that goods and services from abroad play a more prominent role in satisfying demand for other expenditure categories is not taken into account. However, by utilising data from the OECD Input-Output database, Reference Bussière, Callegari, Ghironi, Sestieri and YamanoBussière et al. (2013) show that this has indeed been the case in the past. According to their study, investment and exports turn out to be very import-intensive. Furthermore, incorporating this information seems to improve the empirical fit of estimated trade models. For example, the pronounced cyclical weakness in investment demand helps to explain the great trade collapse of 2008–9 and the lacklustre growth in global trade over the period 2012–16.Footnote 2
In a global macroeconomic setting like the one provided by NiGEM, neglecting heterogeneity in import contents across expenditure categories could potentially lead to biased estimates of domestic and foreign effects following economic shocks. Against this background, we propose an alternative specification of import demand which builds upon work by Reference Carreras, Kirby, Liadze and PiggottCarreras et al. (2016). We rely on estimates of import contents based on the World Input-Output Database (WIOD; Reference Timmer, Dietzenbacher, Los, Stehrer and de VriesTimmer et al., 2015) for our calculations. This database provides input-output tables for 43 countries and 56 industrial sectors using harmonised product and industry classifications and consistent definitions across countries. The underlying data are collected from official National Accounts statistics and are available for the period from 2000 to 2014.
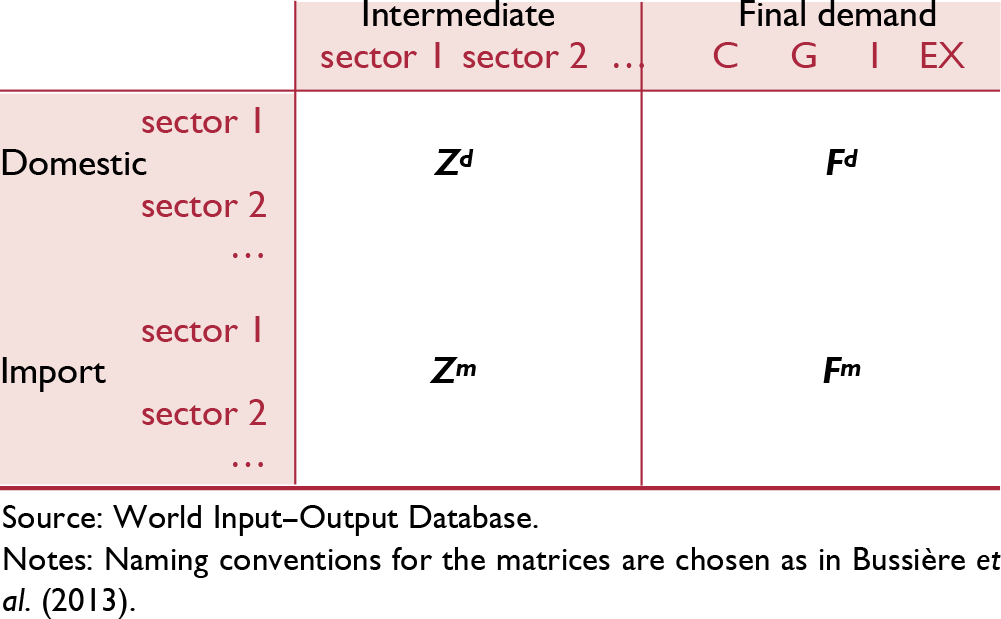
Each input-output table consists of four main matrices as illustrated in stylised form by figure 1. Zd includes information on all inter-industry flows of domestically produced intermediate inputs used in domestic production, while Zm records the same for imported inputs. Fd shows the final demand of domestically produced goods and services across the different expenditure components, while Fm reports direct imports received by the respective categories. Matrices Zd and Zm are subsequently standardised to contain the inputs required to produce one unit of output in the corresponding intermediate sectors. Denoting these matrices by Ad and Am, respectively, total domestic output can be represented as D = (I–Ad)–1Fd, where the Leontief inverse, (I–Ad)–1, summarises both direct and indirect input requirements per unit of output. Imports of intermediate inputs caused by expenditure on domestically produced goods and services are then given by AmD. The aforementioned matrices are computed separately for all years for which data are available. The total import content of each individual expenditure component i in a particular year t can then be obtained as
Stylised input–output table


where the subscript i chooses the i-th column of each matrix, which contains the information pertaining to the corresponding expenditure component, and u is a unit vector of suitable size.
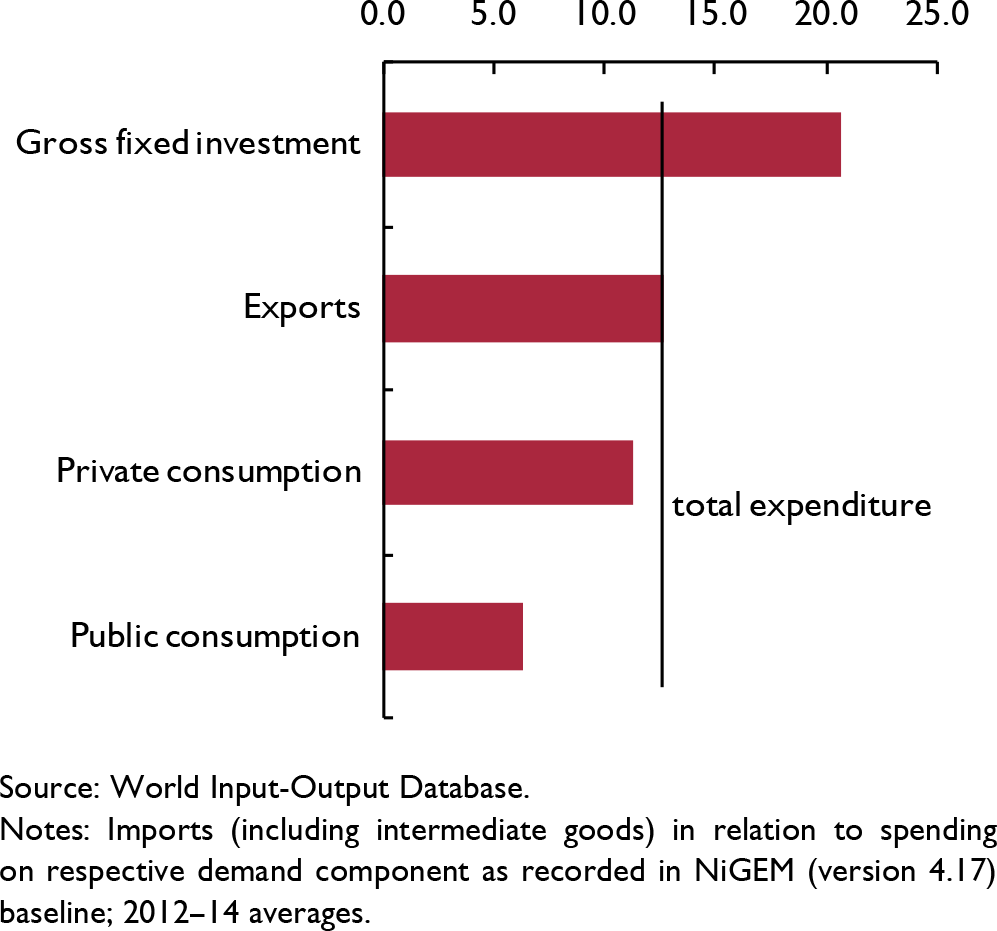
Average import contents calculated over the period 2009–14 – the last five years for which data are available – are the cornerstone of our model alterations. Figure 2 visualises this information for the US. In line with the findings of Reference Bussière, Callegari, Ghironi, Sestieri and YamanoBussière et al. (2013), gross fixed investments and government consumption stand out with relatively high and low import contents, respectively. For the other two expenditure categories, no large differences from the aggregate ratio could be detected. This broad overall picture is confirmed for most other countries in the sample although small open economies tend to use imports more intensively for all expenditure components. For those 39 countries that are explicitly modelled, we match those data with information on real expenditures as recorded in NiGEM's baseline from October 2017.Footnote 3
Import content of GDP expenditure components in the US (per cent)

In a next step, we calculate the level of imports that can be directly and indirectly attributed to each demand component i (with i = C, I, G, EX, or D) by multiplying average import contents over the most recent five years  and expenditure levels. We denote these expenditure component specific imports with IMi. Based on these variables we calculate an import-adjusted measure of total expenditures

and approximate its growth rate by

Definitions (4) and (5) are then used to replace Dtand ΔlnDt in the counterpart of equation (1) for all countries without altering the estimated coefficients.Footnote 4 Hence the weights in the short-run relationship reflect both the import content and the relative size of a demand component. Our approach thus differs from the route taken by Reference Carreras, Kirby, Liadze and PiggottCarreras et al. (2016) who simply use normalised import contents as demand category specific weights in the short-term relationship while leaving the equilibrium part of equation (1) unchanged.
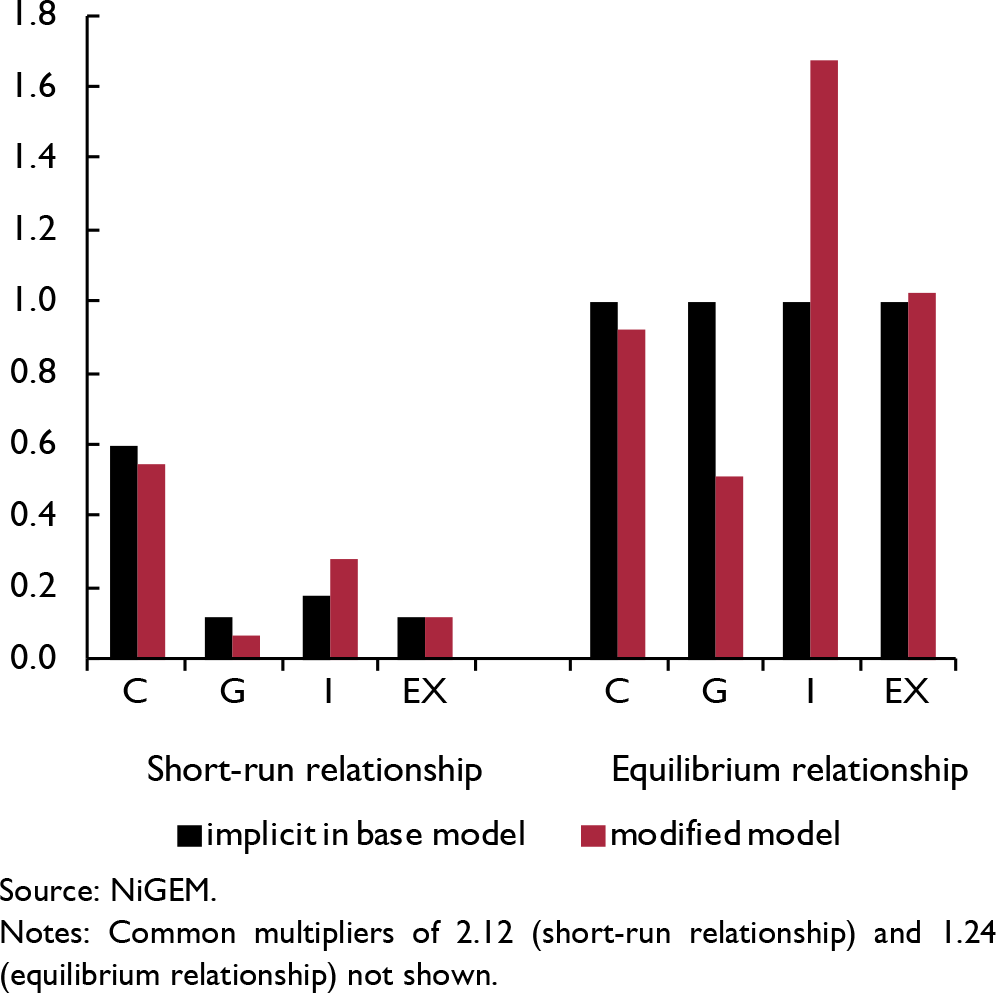
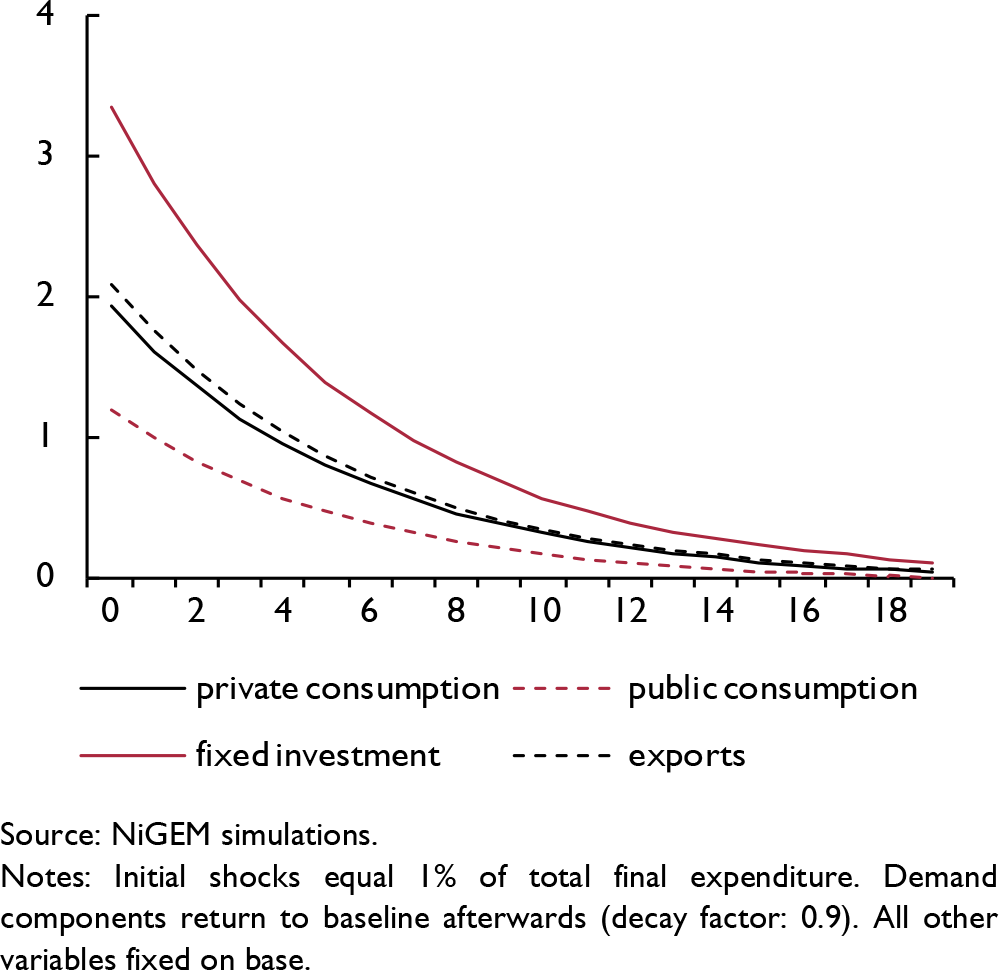
Focusing again on the example of the US, figure 3 contrasts our new coefficients with those implicit in NiGEM. While the consequences of heterogeneous import contents are clearly apparent in the modified equilibrium relationship, the adjustments to the short-term part seem to be small at first glance. In particular, the ranking of the different expenditure components in terms of their immediate impact on import growth remains unaltered. A 1 percentage point shock to the growth rate of private consumption still causes more pronounced swings in imports than a similar change in the pace of investment growth as the former accounts for a much larger fraction of total spending. Controlling for these differences in size by shocking the level of each demand component by an identical absolute amount highlights that our modifications have non-trivial consequences for import demand even in the short run. As figure 4 shows, the immediate impact on US import spending of a shock equalling 1 per cent of total expenditure is almost three times as strong if investment spending instead of public consumption is hit. The differences remain meaningful for a considerable period of time in this stylised example which ignores any interaction between other variables.
Coefficients of demand components in different NiGEM specifications of US import demand

US import demand in modified NiGEM version after shocks to expenditure components (per cent difference from baseline)

3. Illustrations
3.1 US tax reform
In late 2017, US Congress passed a comprehensive tax reform bill. Effective from the start of 2018, the ‘Tax Cuts and Growth Act’ provides considerable tax relief for corporations, passthrough entities, and private households. The net fiscal costs of the package are likely to be sizable. According to estimates from the congressional Joint Committee on Taxation (JCT), the shortfall in federal revenues may total almost $1.5 trillion over a decade (JCT, 2017). From 2018 to 2020 the fiscal stimulus is even projected to exceed 1 per cent of GDP. Afterwards, the drag on public finances is expected to recede as several costly provisions – e.g. the tax cuts for households and a bonus depreciation scheme for businesses – will be phased out.
In line with earlier work on the potential effects of the Tax Cuts and Jobs Act (Deutsche Bundesbank, 2018), we implement the reform in NiGEM by calibrating changes to tax rates for private households and corporations to reproduce JCT cost estimates for individual and business tax reform.Footnote 5 Modifications to international taxation principles are not taken into account as their incentive effects are difficult to judge and model.Footnote 6 In order to isolate the effects of tax reform from other public finance developments, like the recently achieved budget compromise, real public spending also remains unaltered in the scenario.
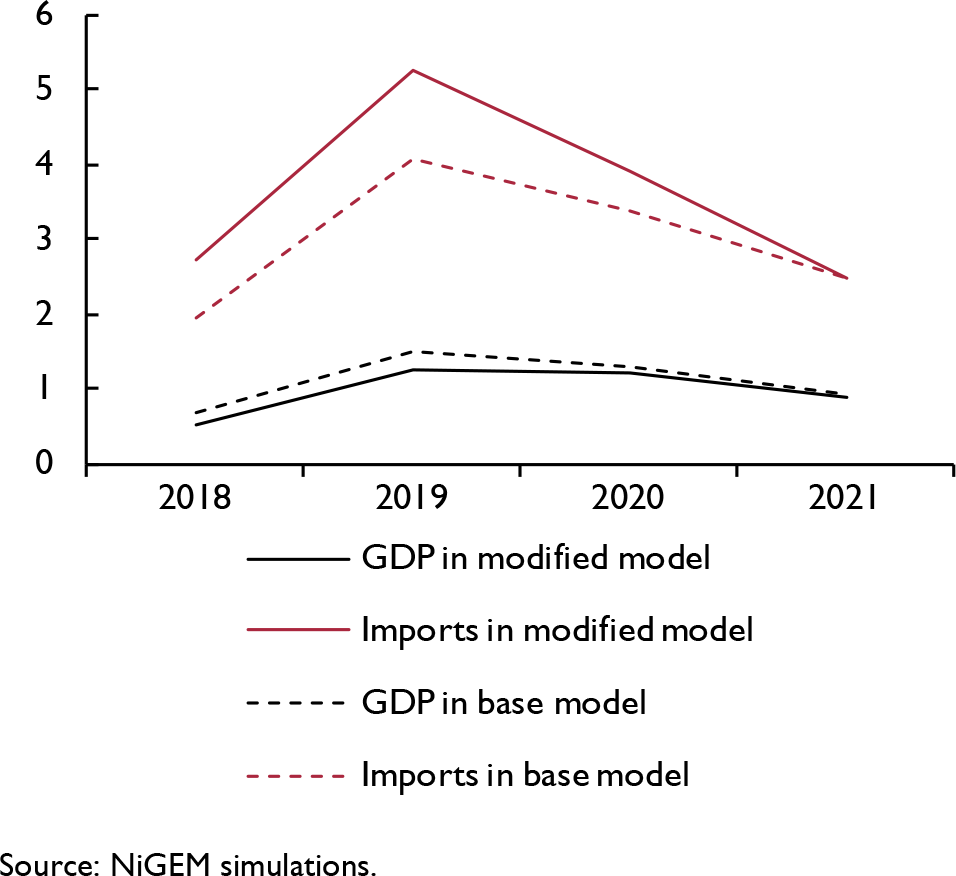
According to the simulation output from the standard NiGEM model (version 4.17), the US tax reform stimulates domestic activity considerably in the short run. Private investment in particular responds vigorously to the sharp reduction in the (after-tax) user cost of capital. Private consumption also rises as households adjust their spending in response to the boost in disposable incomes. As the dashed lines in figure 5 illustrate, in consequence, the level of GDP exceeds its baseline value by 1.5 per cent after two years and US imports of goods and services increase by 4 per cent over the same period. Both variables drop back towards the baseline from year 3 onwards as the fiscal stimulus is scaled back.
Consequences of US tax reform: economic activity in the US (per cent difference from baseline)

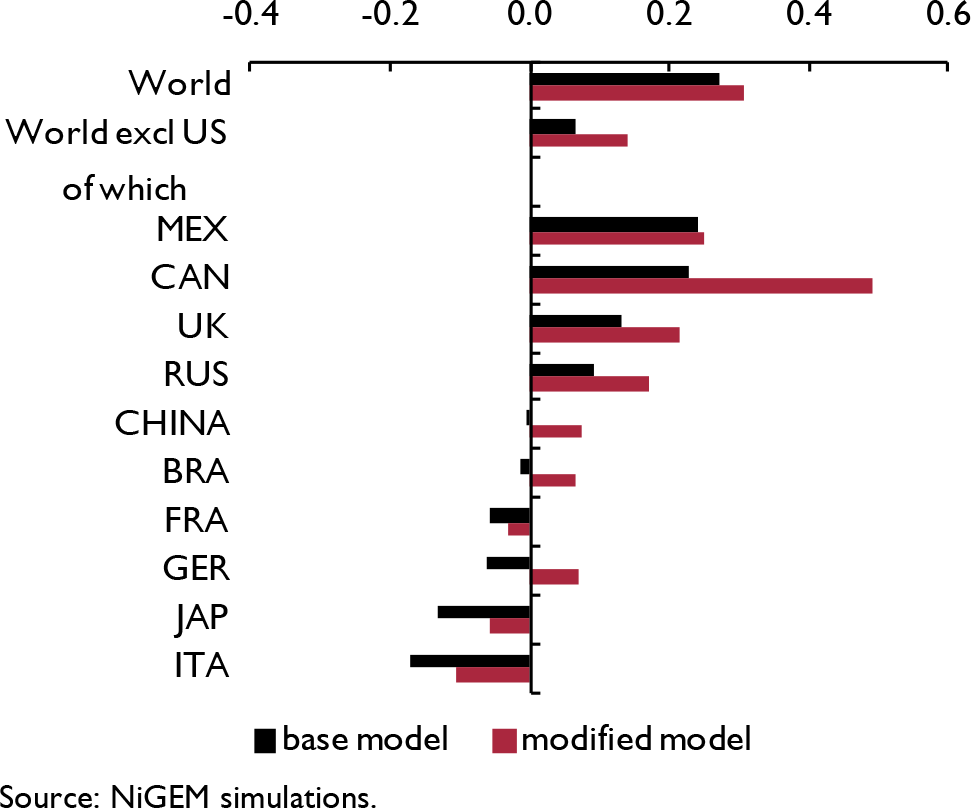
Temporarily higher demand from the US spills over to other economies through the trade channel with close trading partners like Mexico and Canada benefiting the most. At the same time, however, other factors weigh on activity. Reflecting the pass-through of a significant US dollar appreciation and the rule-based response of monetary policy, consumer prices and real interest rates increase globally. As a consequence, the net effect of the US tax reform on GDP abroad is relatively modest. The black bars of figure 6 show that in the case of Germany, Japan, and several other advanced economies, activity even falls slightly compared to baseline levels.
Consequences of US tax reform: impact on real GDP after two years (per cent difference from baseline)

Overall, these results are qualitatively in line with other recent studies. In its most recent World Economic Outlook Update, the IMF also highlights the probably hump-shaped response of US real GDP to the tax reform (International Monetary Fund, 2018).Footnote 7 The two opposing factors shaping spillovers in NiGEM – higher foreign demand and interest rates – are also present in simulations with the EU Commission's QUEST model (European Commission, 2017). In quantitative terms, however, our short-term output effects for the US tend towards the high side of reported results. Furthermore, the frequent occurrence of negative spillovers following a positive demand shock in a large economy like the US is at least controversial. Against this background, we suspect that NiGEM may underestimate the response of US imports to the changes in the tax code. This is likely to be the case as higher US demand in the default model is strongly directed towards capital goods which have an above-average import content. As a consequence, the implications of the new legislation for economic activity in the US would be exaggerated while the reverse would be true for the effects on other countries.
Results from our modified model version lend support to this hypothesis. Confirming our priors, the rise in US import demand is considerably more pronounced than in the default specification. Accordingly, the response of US GDP is more muted and closer to the results reported in other studies (see solid lines in figure 5). At the same time, output effects in the rest of the world turn more positive as a larger fraction of US demand is met by products from abroad. Nevertheless, the ramifications remain relatively limited for most countries except Canada and Mexico.Footnote 8 On a global level, GDP responses barely differ between NiGEM versions, indicating that our adjustments only affect the regional distribution of a given impulse (figure 6, red bars).
3.2 A ‘hard landing’ in China
In response to cumulating domestic imbalances, the Chinese authorities have striven to steer China's economy away from exports and investment towards consumption as a main engine of growth in recent years (e.g. Reference Dieppe, Gilhooly, Han, Korhonen and LodgeDieppe et al., 2018). A sudden and sharp drop in investment demand has been widely recognised as a possible adverse scenario in conjunction with this rebalancing process. However, some simulations in macroeconomic models point to rather small international spillovers in such a setting, partly due to opposing effects from different channels (a lower Chinese demand level versus lower prices of commodities and Chinese exports), and partly due to a deficiency in adequately accounting for a specific weakness in investment and, thus, imports (Deutsche Bundesbank, 2015).
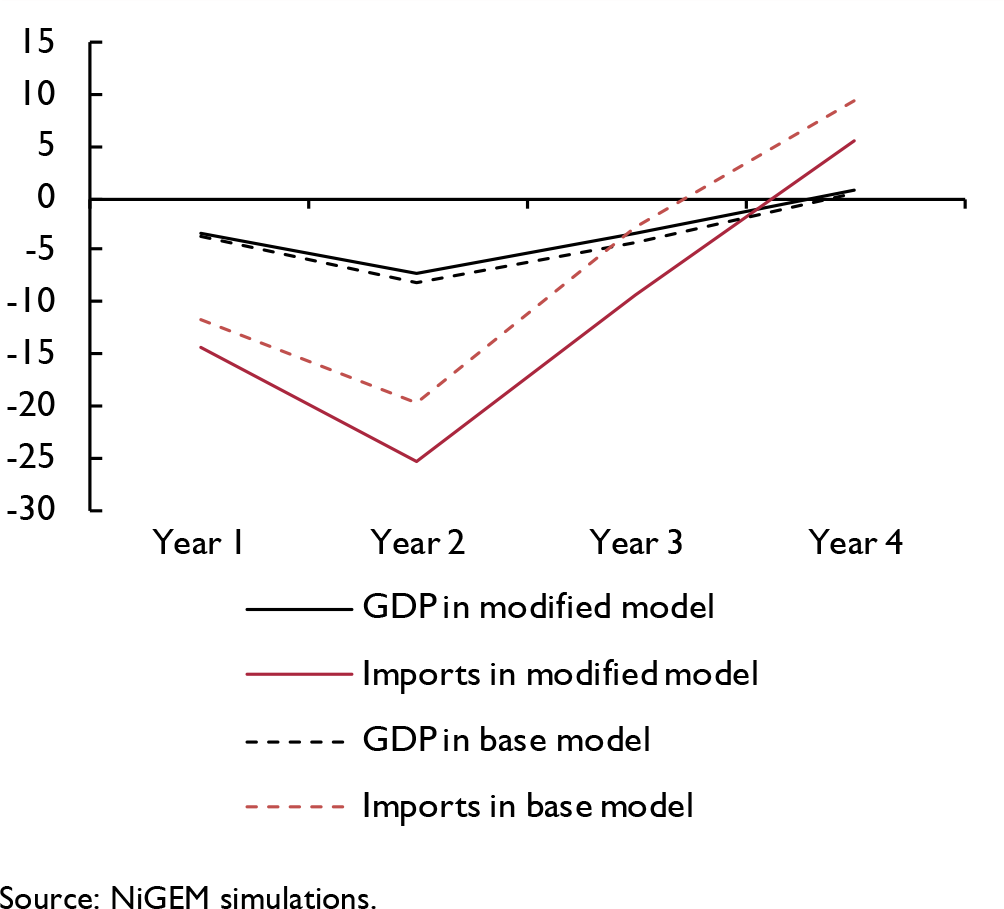
Making use of the expanded NiGEM module for China, which separates domestic demand into total investment, private and government consumption, we study a ‘hard landing’ scenario for China in our modified framework. The Asian Development Bank (2016) has compiled evidence on the magnitude of growth decelerations during crises. We rely on their findings for average effects in credit boom-bust episodes in order to calibrate endogenous shocks to Chinese domestic demand. Accordingly, growth in investment is reduced by almost 12 percentage points relative to the baseline in the first two years, and private consumption by nearly 3 percentage points. Due to the high import content of investment, these shocks push China's import volume 25 per cent below the baseline in the second year. According to figure 7, this is substantially more than in the standard NiGEM setup. As a result, the dampening impact on China's real GDP turns out markedly smaller in the adjusted framework, as a larger portion of the decline in domestic demand must be accounted for by foreign output. Thus, average annual GDP growth in the rest of the world is lowered by 0.5 percentage points in the first two years, compared to 0.4 percentage points in the default model, while the decrease in global growth proves to be virtually identical (–1.1 percentage points).
‘Hard landing’ in China: economic activity in China (per cent difference from baseline)

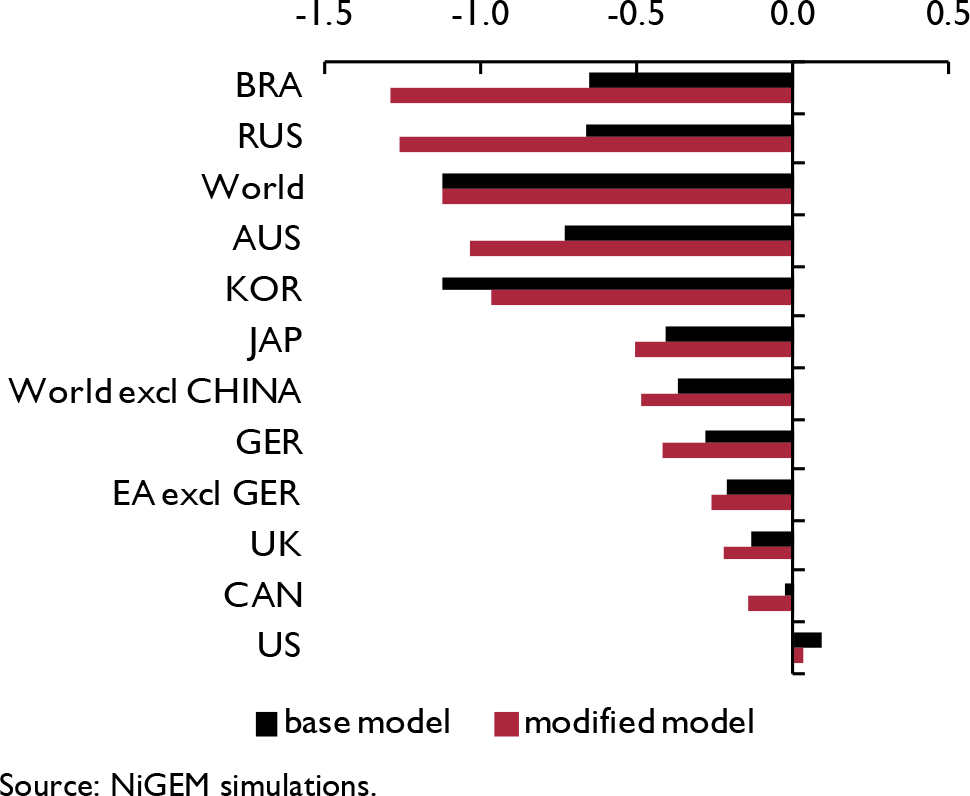
The more adverse impact on foreign growth is broadly shared across China's trade partners as evident from figure 8. It is particularly strong for some commodity-exporting countries such as Brazil, Russia, and Australia. Moreover, the difference between the negative effects on growth in Germany, which has established relatively close trade links with China, and those in the rest of the Euro Area also become somewhat more pronounced. An exception appears to be South Korea, where the dampening impact on GDP is actually diminished in the first two years on account of a stronger drop in imports in the modified setup.
‘Hard landing’ in China: impact on average real GDP growth in first two years (percentage point difference from baseline)

Overall, our simulations demonstrate that the negative growth spillovers from a sudden retrenchment in investment in China tend to be somewhat larger if the higher import content of investment is accounted for. While the modified model should capture the size of spillovers more accurately, there could still be some distortions regarding the size and the distribution of these negative effects among trading partners. The reason is that simulations do not take differences in the mix of export goods into consideration. As a result, the negative growth effects of a sharp investment-led downturn in China on capital goods exporters – like Germany – may be even stronger than in the adjusted framework. Notwithstanding these considerations, the extent of international ripple effects still appears limited, highlighting the importance of transmission channels other than the linkages via foreign trade volumes.
3.3 A public investment programme in Germany
Calls for higher public spending in Germany have been echoed in policy recommendations from international institutions for many years. Although these prescriptions have usually been motivated by the beneficial effects on German potential output, positive expected spillovers to other countries within the Euro Area have also been mentioned frequently (see for example European Commission, 2016; International Monetary Fund, 2016). Quantitative studies indeed point to small but non-negligible spillover effects, in particular if higher public investment spending is deficit-financed and accommodated by monetary policy (European Central Bank, 2016).
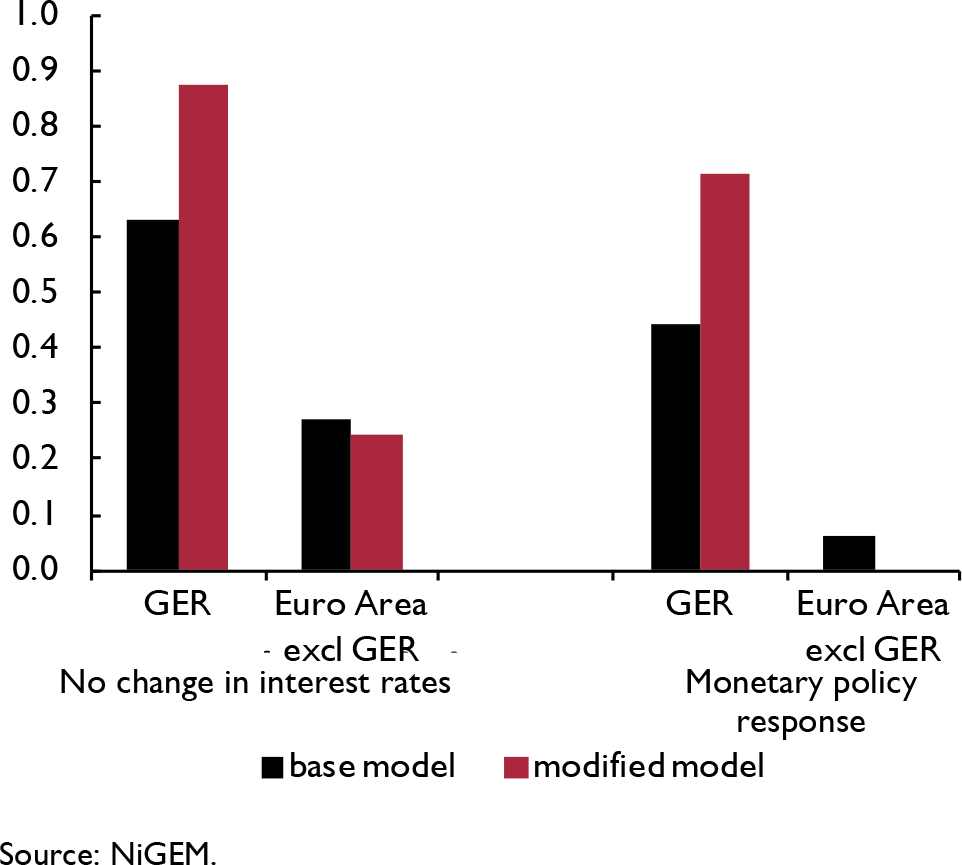
These key findings can be replicated with the default version of NiGEM under similar restrictive assumptions. The black bars of figure 9 illustrate the results. Raising public investment by 1 per cent of GDP for two years while holding tax rates, other outlays, and interest rates constant would lift real GDP in Germany by up to 0.6 per cent and imports by almost 2.5 per cent according to the simulation results. Nevertheless, spillovers to other Euro Area countries would still be modest. After excluding Germany from the aggregate, the level of real GDP in the common currency area increases by 0.3 per cent in the second year of the fiscal shock. Detailed analysis shows that small to medium-sized economies that are geographically close to Germany, such as the Netherlands or the Slovak Republic, benefit the most. Spillovers to those economies in the geographical periphery of Europe that may have not yet fully recovered from the latest crises are much lower by comparison (Deutsche Bundesbank, 2016a). Allowing monetary policy to respond to the increase in real activity and inflation in the Euro Area according to standard reaction functions diminishes both the domestic and the international effects of the German stimulus considerably. Real GDP in the Euro Area excluding Germany exceeds its baseline level by just 0.1 percentage points in this setting.
Public investment push in Germany: impact on real GDP after two years (per cent difference from baseline)

These spillovers may still be exaggerated as we suspect government investment to have a below average import content. Unfortunately, our standard database does not allow us to explore the validity of this hypothesis as the input-output tables from the WIOD do not differentiate between subcomponents of aggregate investment spending. Against this background, Deutsche Bundesbank (2016a) resorts to data from national sources to overcome this problem. After combining more detailed input-output tables with information on German public and private investment spending for structures and equipment, the study confirms that the import content of public investment is relatively low, albeit higher than that of government consumption. Relying on these calculations and the derived new import equation for Germany we rerun our aforementioned scenarios.Footnote 9
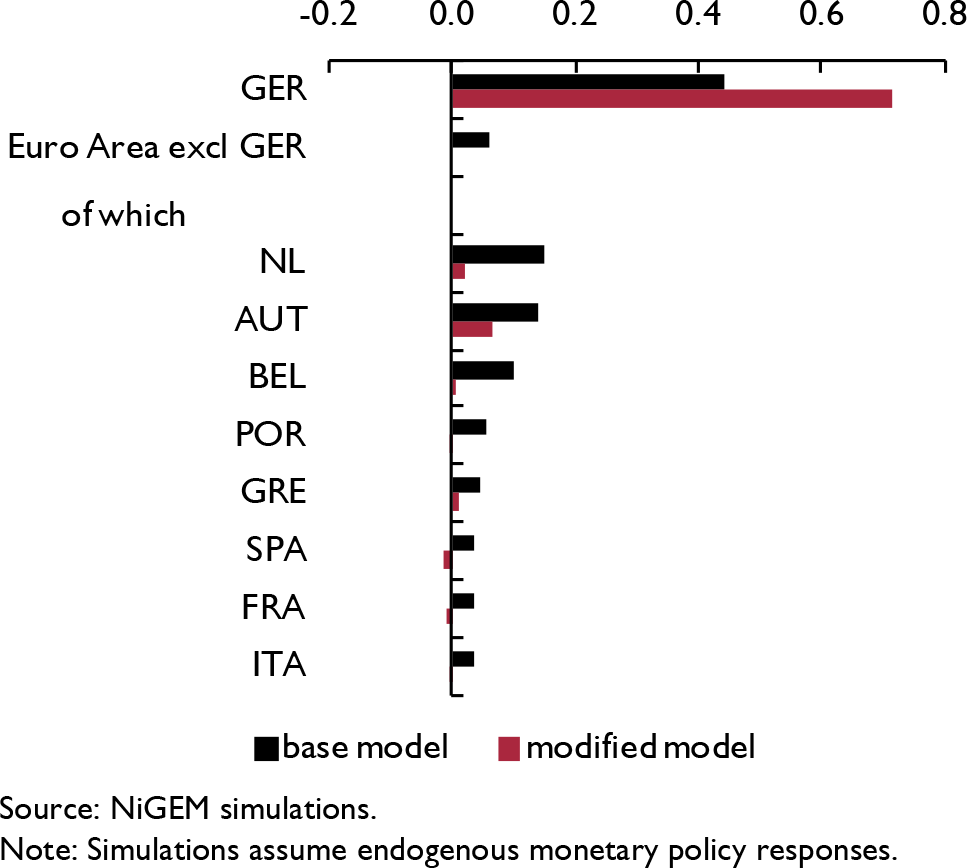
The results turn out as expected. At +0.7 per cent after two years, the spike in the level of German real GDP following the public investment push is significantly more pronounced than in the default model in a setting with endogenous monetary policy. At the same time, spillovers to the remainder of the Euro Area fall to zero in this scenario (figure 9, red bars). According to figure 10, real GDP actually dips below the baseline for some large countries like Spain and France as the positive impact of a small increase in export market size is outweighed by the dampening effects of tighter monetary policy. Overall, we thus conclude that a temporary expansion of public investment in Germany is likely to have only very limited effects on real GDP in other economies at best. Furthermore, such a programme is not suited to spurring demand in economies in the European periphery.
Public investment push in Germany: impact on real GDP after two years (per cent difference from baseline)

Conclusion
Previous research has shown that data on the import content of expenditure components can be used to improve the fit of empirical trade models. In global macroeconometric models, neglecting this information could potentially lead to biased estimates of domestic effects and spillovers following economic shocks. Against this background, our work offers an easy-to-apply quick fix that mitigates these problems in NiGEM. In fact, the proposed changes to NiGEM's default import equations appear to be relevant from a quantitative point of view. In all three illustrative scenarios presented above, economic outcomes change meaningfully both at home and abroad.
Various further extensions to the specification of import demand in NiGEM could enhance the insights gained so far. For example, our discussion of the consequences of a public investment programme in Germany highlights that differentiating between four expenditure components only – private and government consumption, fixed investment, as well as exports – might be too restrictive for many applications. By building upon more comprehensive national sources, future studies could augment import equations even further. A different line of work could put the new import equations on a firmer empirical footing. Although we are confident that our specifications approximate import responses to different demand shocks reasonably, we are well aware that ad hoc adjustments should be no substitute for a reestimation of NiGEM's trade block. Ideally, country-specific specialisation patterns in the export structure could also be taken into account in this process. In the meantime, we believe that our small add-on to NiGEM can be a useful tool for robustness exercises, in particular for spillover studies.