Introduction
Inadequate empiric therapy has been associated with increased mortality in patients with sepsis, with septic shock recognized as a critical prognostic determinant. Reference Paul, Shani, Muchtar, Kariv, Robenshtok and Leibovici1 Although bloodstream infections may present with sepsis or progress to septic shock, they do not invariably manifest as severe presentations, and prior investigations conducted outside the intensive care unit (ICU) have demonstrated that inadequate empiric therapy is not consistently predictive of treatment failure. Reference Hung, Lee and Ko2,Reference Marschall, Agniel, Fraser, Doherty and Warren3 Nevertheless, few studies have examined how delays in initiating appropriate therapy influence treatment failure across the full spectrum of disease severity. Excessive empiric therapy, characterized by unnecessary broad-spectrum antimicrobial coverage, has likewise been implicated in adverse clinical outcomes. The incidence of resistant Gram-negative bacteria has been reported to increase substantially when de-escalation is not undertaken, Reference Teshome, Park, Arackal, Hampton, Kollef and Micek4 and adverse events occur in 15%–20% of patients receiving broad-spectrum antibiotics. Reference Hagiya, Kokado and Ueda5 In addition to inadequate empiric therapy, unnecessarily broad empiric therapy has been reported to adversely influence mortality. Reference Rhee, Kadri and Dekker6 Optimization through de-escalation based on culture results has been widely implemented to combat antimicrobial resistance; however, there is little evidence on how delays in achieving optimization influence treatment failure or the development of adverse events.
To address this knowledge gap, the present study investigated whether the time to antibiotic optimization influences clinical outcomes in patients with bloodstream infections who initially received either inadequate or excessive empiric therapy.
Methods
Study design and setting
This was a retrospective study of patients aged ≥18 years with positive blood cultures and confirmed antimicrobial susceptibility between April 2018 and March 2024 at Hokkaido University Hospital, Japan. The hospital is a premier academic medical center and tertiary care referral institution in Japan. As a designated national Clinical Research Core Hospital, it provides advanced, multidisciplinary care and accommodates 894 inpatient beds. The exclusion criteria were as follows: (1) no antibiotics used, (2) appropriate empiric therapy, (3) antibiotics before blood culture collection, (4) duration of antimicrobial therapy <5 days, (5) empiric therapy not optimized within 2 weeks (including cases where optimization was clinically contraindicated due to documentation of severe beta-lactam allergy), (6) detection of skin commensals without clinical symptoms or with only one positive blood culture set, (7) change to another antibiotic (ie, any antimicrobial agent not included in the final optimized regimen) before optimization, and (8) unavailable outcome data.
This study was approved by the Ethics Review Committee of the Hokkaido University Hospital (approval No. 024-0270). The requirement for informed consent was waived due to the retrospective observational nature of the study.
Definitions
Inadequate empiric therapy was defined as the absence of antibiotics active against the specific organisms isolated from the index blood culture. Excessive empiric therapy was defined as the use of anti-methicillin-resistant Staphylococcus aureus (MRSA) agents (vancomycin, teicoplanin, daptomycin, and linezolid) or antipseudomonal agents, such as carbapenems or piperacillin–tazobactam, despite the absence of MRSA, Pseudomonas aeruginosa, or cefotaxime-resistant organisms, such as extended-spectrum β-lactamase–producing Enterobacterales in the index blood culture. Reference Rhee, Kadri and Dekker6 In this study, anti-MRSA agents were defined as antibiotics with established clinical efficacy and recommended use for empiric therapy of MRSA bacteremia or sepsis. Antibiotic optimization was characterized as modification of the empiric regimen according to the identified organism and its susceptibility profile. For inadequate empiric therapy, optimization entailed the addition of, or substitution with, an active agent. Conversely, for excessive empiric therapy, optimization involved de-escalation through withdrawal of unnecessary anti-MRSA or antipseudomonal coverage. The 30-day mortality rate was calculated from the index blood culture date. Microbiological failure was defined as the re-isolation of the same organism from blood cultures obtained ≥48 hours after the index blood culture, occurring before completion of the initial optimized antimicrobial regimen. Antibiotic modification owing to insufficient efficacy was defined as a change in the initial period of definitive therapy, as determined by the treating physician, owing to an inadequate clinical response. Source control was defined as drainage of an abscess or removal of an indwelling device within 48 hours of the index blood culture. Skin commensals were defined according to the CDC/NHSN Surveillance Definitions for Specific Types of Infections. 7 Adverse event–related discontinuation was defined as the cessation of an antibiotic by the treating physician owing to an adverse event that occurred during either empiric therapy or the initial period of definitive therapy.
Data collection
The following data were extracted from the medical charts: age, sex, body weight, Pitt bacteremia score (PBS), Reference Chow and Yu8 Charlson comorbidity index (CCI), Reference Quan, Li and Couris9 history of antibiotic administration, ICU admission, laboratory data, antimicrobial stewardship team (AST) intervention status, source of infection, presence of a source control, and occurrence of adverse events. For patients hospitalized multiple times during the study period who experienced more than one episode of bacteremia, only the first episode was analyzed.
Endpoints
The primary endpoint was a composite outcome that consisted of all-cause 30-day mortality, microbiological failure, and antibiotic modification due to insufficient clinical efficacy, based on a framework adapted from Casapao et al. Reference Casapao, Jacobs, Bowers, Beyda and Dilworth10 Secondary endpoints included the treatment failure rate by the causative organism in the inadequate group and the discontinuation rate due to adverse events in the excessive group.
Microbiological testing
Susceptibility testing was conducted using a MicroScan WalkAway Plus System (Beckman Coulter, Tokyo, Japan), which employs a broth microdilution method.
Statistical analysis
Statistical analysis was performed using the Mann–Whitney U test for continuous variables and Pearson’s χ 2 or Fisher’s exact test for categorical variables. Differences with P values ≤ .05 were considered statistically significant, and Holm’s method was used to adjust for multiple testing where applicable.
The multivariable logistic regression analysis was performed using treatment failure as the dependent variable. The variables included were time to antibiotic optimization, AST intervention, PBS, and other clinically relevant factors that were significant in the univariate comparisons. Variables with fewer than 10 univariate comparisons were excluded. Reference Peduzzi, Concato, Kemper, Holford and Feinstein11 Sensitivity analyses were conducted after excluding patients in whom skin commensals were identified as causative organisms, as these may represent contamination and thereby influence the evaluation of treatment appropriateness. Additionally, exploratory univariate analysis was performed using time to antibiotic optimization as the predictor and all-cause 30-day mortality as the outcome to further validate the robustness of the primary findings. All variance inflation factors were below 2, indicating minimal multicollinearity.
Receiver operating characteristic (ROC) curve analyses were used to determine optimal cutoff values for PBS, CCI, and time to antibiotic optimization, using treatment failure as the dependent variable. In the inadequate group, no clear cutoff could be established for either time to antibiotic optimization or PBS; these variables were therefore entered in continuous form. As a secondary analysis, ROC analysis of time to antibiotic optimization was also conducted using antibiotic discontinuation due to adverse events as the outcome. In all cases, the Youden index was used to select cutoff values.
With respect to treatment failure rates by causative organism in the inadequate group, patients with a time to antibiotic optimization of ≤24 hours were used as the reference group and were compared with those having times of 24–48 hours, and ≥48 hours.
For discontinuation rates due to adverse events in the excessive group, patients with a time to antibiotic optimization of ≤48 hours were used as the reference group and were compared with those having times of 48–96 hours, 96–144 hours, and ≥144 hours. The univariate logistic regression analysis was performed using the total treatment duration (days from treatment initiation to completion of the first definitive therapy) as the independent variable.
All statistical analyses were performed using the EZR software ver. 1.64. Reference Kanda12
Results
Patient characteristics
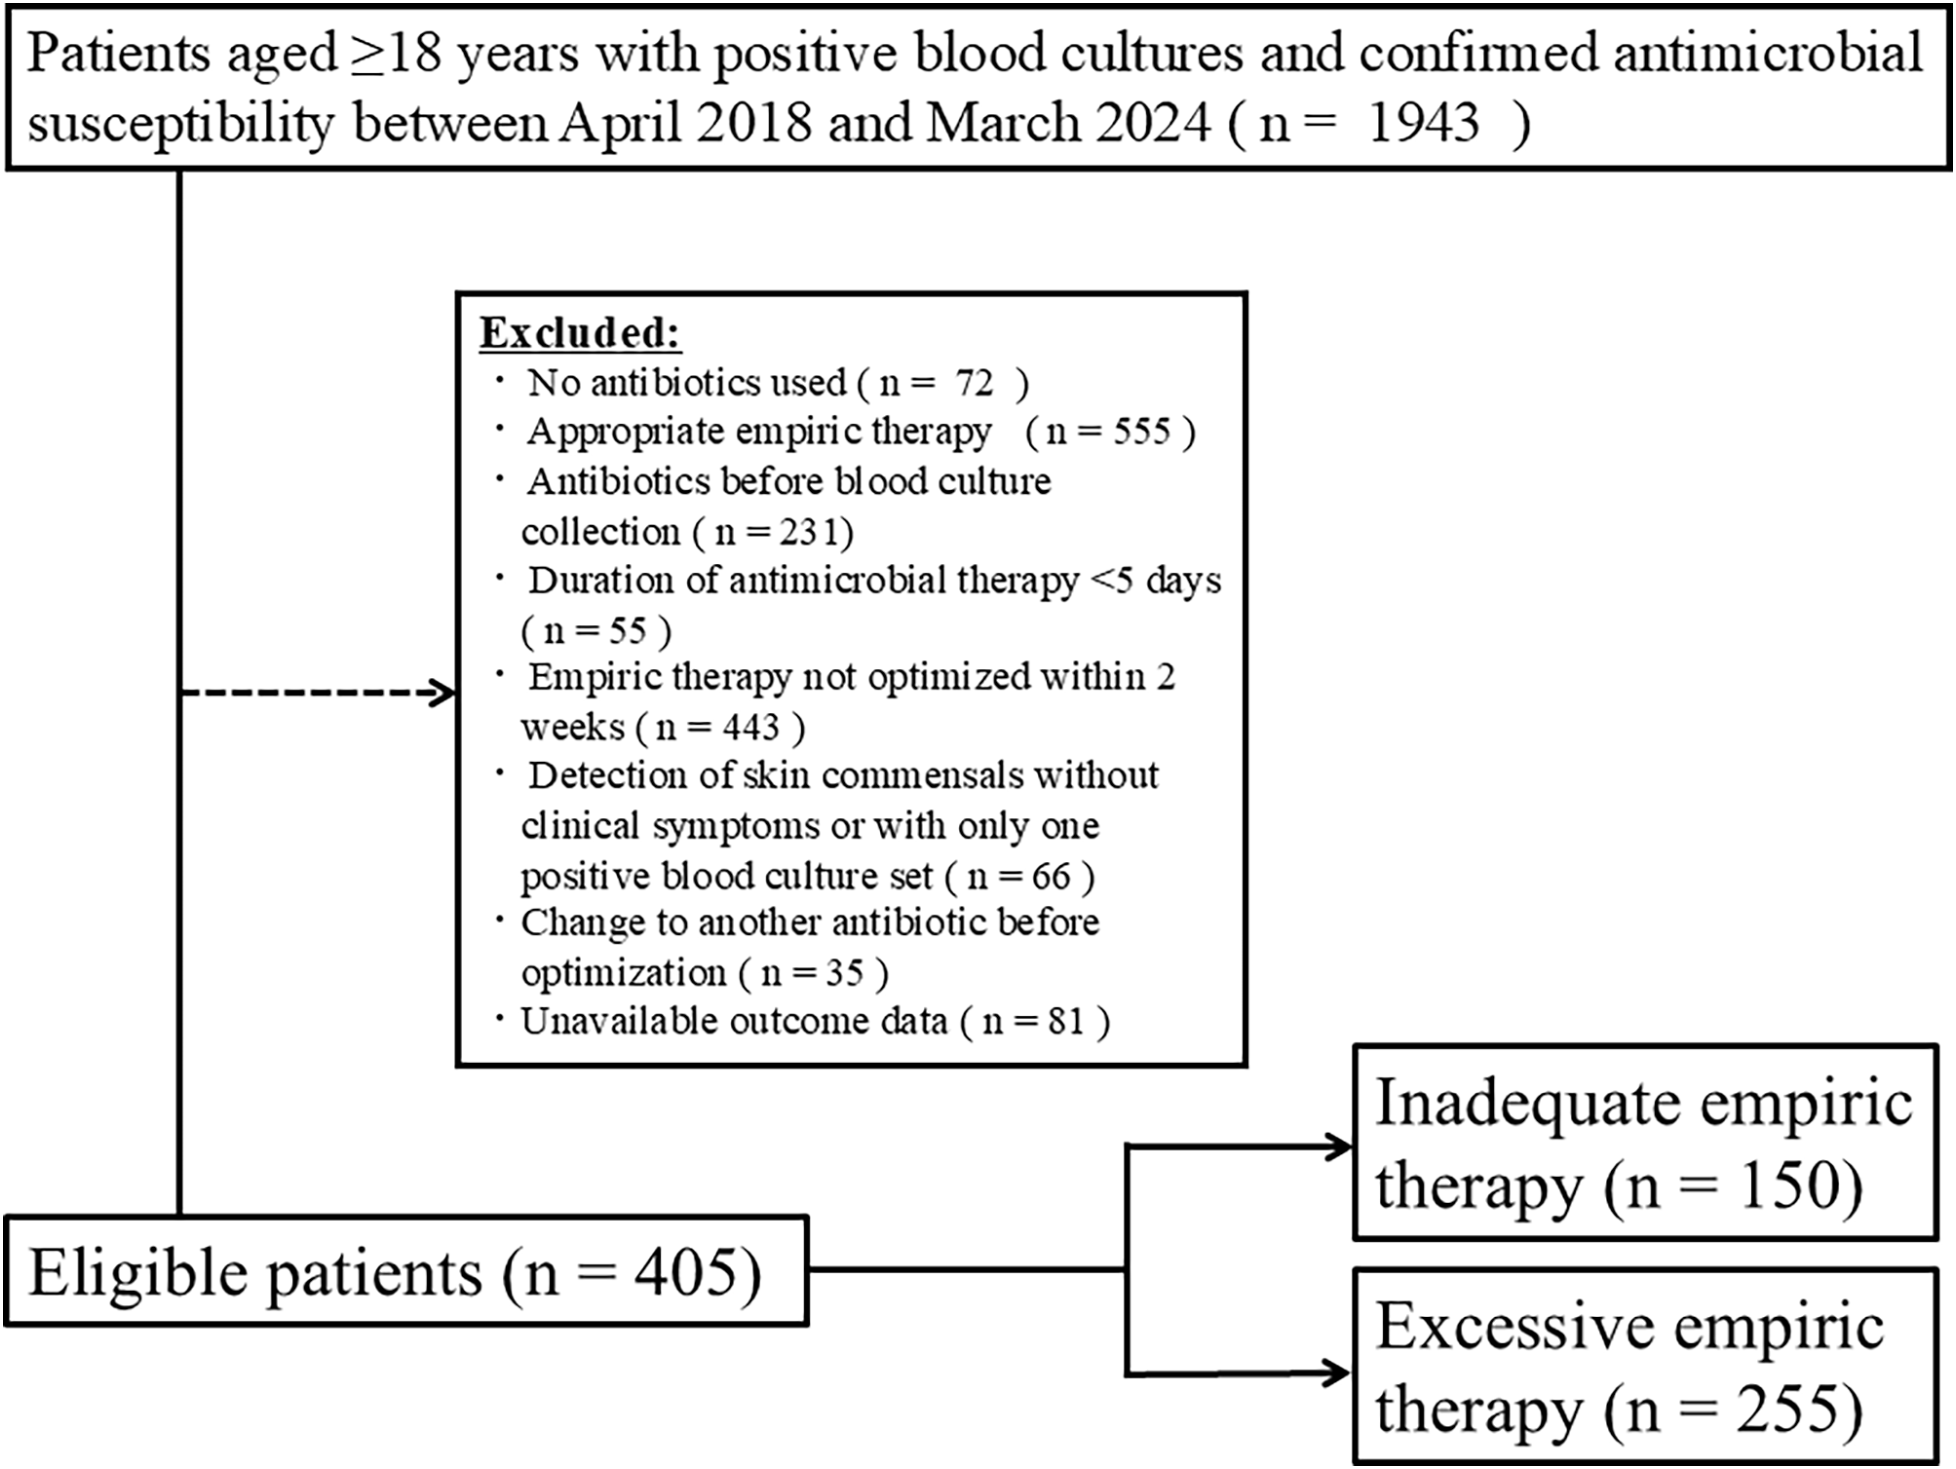
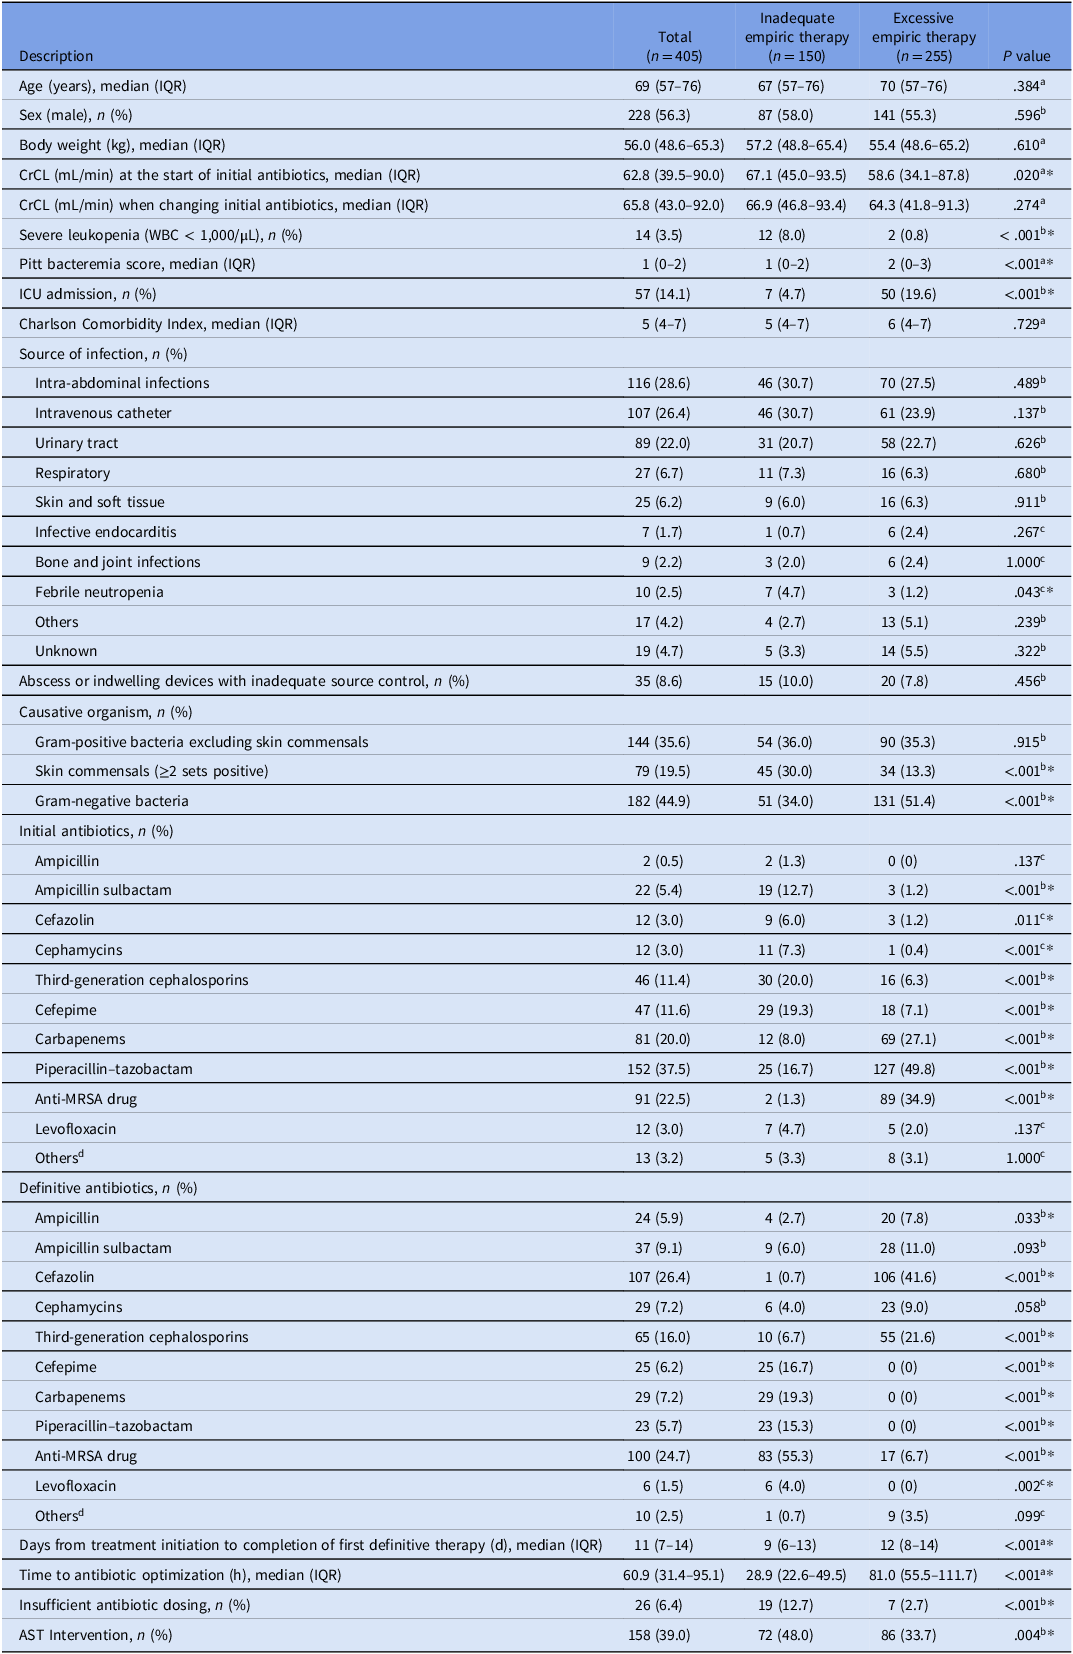
Of the 1943 patients screened, 405 met the inclusion criteria (Figure 1), among whom 150 received inadequate empiric therapy and 255 received excessive empiric therapy. The characteristics of the patients are listed in Table 1. The median age of the entire cohort was 69 years (67 and 70 years in the inadequate and excessive groups, respectively), 56.3% male (58.0% vs 55.3%), and 14.1% were admitted to the ICU (4.7% vs 19.6%). Severe leukopenia (8.0% vs 0.8%), skin commensals (30.0% vs 13.3%), and AST intervention (48.0% vs 33.7%) were more frequent in the inadequate group. In contrast, the excessive group had a higher PBS (median, 2 vs 1), more common Gram-negative causative organisms (51.4% vs 34.0%), and a longer time to antibiotic optimization (median, 81.0 vs 28.9 h). The most common organism was Enterococcus species in the inadequate group, whereas Escherichia coli predominated in the excessive group (Supplementary Table 1).
Flowchart of patients included in this study. A total of 1943 patients were initially included in this study, among whom 405 met the inclusion criteria and were included in the analysis. Of the included patients, 150 received inadequate empiric therapy, and 255 received excessive empiric therapy.

Figure 1 Long description
The flowchart begins with 1943 patients aged 18 years or older with positive blood cultures and confirmed antimicrobial susceptibility between April 2018 and March 2024. The flowchart then lists the exclusions: 72 patients did not use antibiotics, 555 received appropriate empiric therapy, 231 used antibiotics before blood culture collection, 55 had a duration of antimicrobial therapy less than 5 days, 443 did not have empiric therapy optimized within 2 weeks, 66 had detection of skin commensals without clinical symptoms or with only one positive blood culture set, 35 changed to another antibiotic before optimization, and 81 had unavailable outcome data. This leaves 405 eligible patients. These eligible patients are then divided into two groups: 150 received inadequate empiric therapy, and 255 received excessive empiric therapy.
Baseline characteristics of the study population

Table 1 Long description
The table presents baseline characteristics of a study population divided into three groups: total, inadequate empiric therapy, and excessive empiric therapy. It includes 15 columns and 20 rows, detailing various descriptors such as age, sex, body weight, C C r C L, severe leukopenia, Pitt bacteremia score, ICU admission, and more. The table highlights median values and percentages for each group, with notable differences in ICU admission rates, severe leukopenia, skin commensals, and AST intervention between the inadequate and excessive therapy groups. The data also includes information on the source of infection, causative organisms, initial and definitive antibiotics, and days from treatment initiation to completion of first definitive therapy.
Note. IQR, interquartile range; CrCL, creatinine clearance; WBC, white blood cell; ICU, intensive care unit; MRSA, methicillin-resistant Staphylococcus aureus; AST, antimicrobial stewardship team.
a Mann–Whitney U-test.
b Chi-square test.
c Fisher’s exact test.
d Others included clindamycin (n = 6), cefotiam (n = 5) and other less common agents.
* P values ≤ .05 were considered statistically significant.
Treatment outcomes
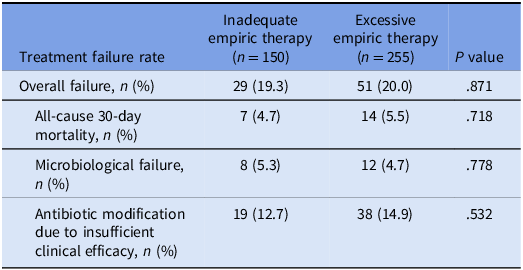
There was no statistically significant difference in the overall failure rates between the two groups (29/150, 19.3% in the inadequate group vs 51/255, 20.0% in the excessive group; P = .871). The breakdown of failures was similar between the cohorts: all-cause 30-day mortality occurred in 7/150 (4.7%) and 14/255 (5.5%) (P = .718), microbiological failure in 8/150 (5.3%) and 12/255 (4.7%) (P = .778), and antibiotic modification due to insufficient clinical efficacy in 19/150 (12.7%) and 38/255 (14.9%) (P = .532) of patients in the inadequate and excessive groups, respectively (Table 2).
Breakdown of treatment failures and rates between therapy groups

Table 2 Long description
The table presents a comparison of treatment failure rates between inadequate and excessive therapy groups. It consists of five rows and four columns. The columns are labeled 'Treatment failure rate', 'Inadequate empiric therapy (n = 150)', 'Excessive empiric therapy (n = 255)', and 'P value'. The rows detail overall failure rates, all-cause 30-day mortality, microbiological failure, and antibiotic modification due to insufficient clinical efficacy. The inadequate empiric therapy group shows 19.3% overall failure, 4.7% all-cause 30-day mortality, 5.3% microbiological failure, and 12.7% antibiotic modification. The excessive empiric therapy group shows 20.0% overall failure, 5.5% all-cause 30-day mortality, 4.7% microbiological failure, and 14.9% antibiotic modification. The P values indicate no statistically significant differences between the groups for any of the failure rates.
Note. Chi-square test. P values ≤ .05 were considered statistically significant.
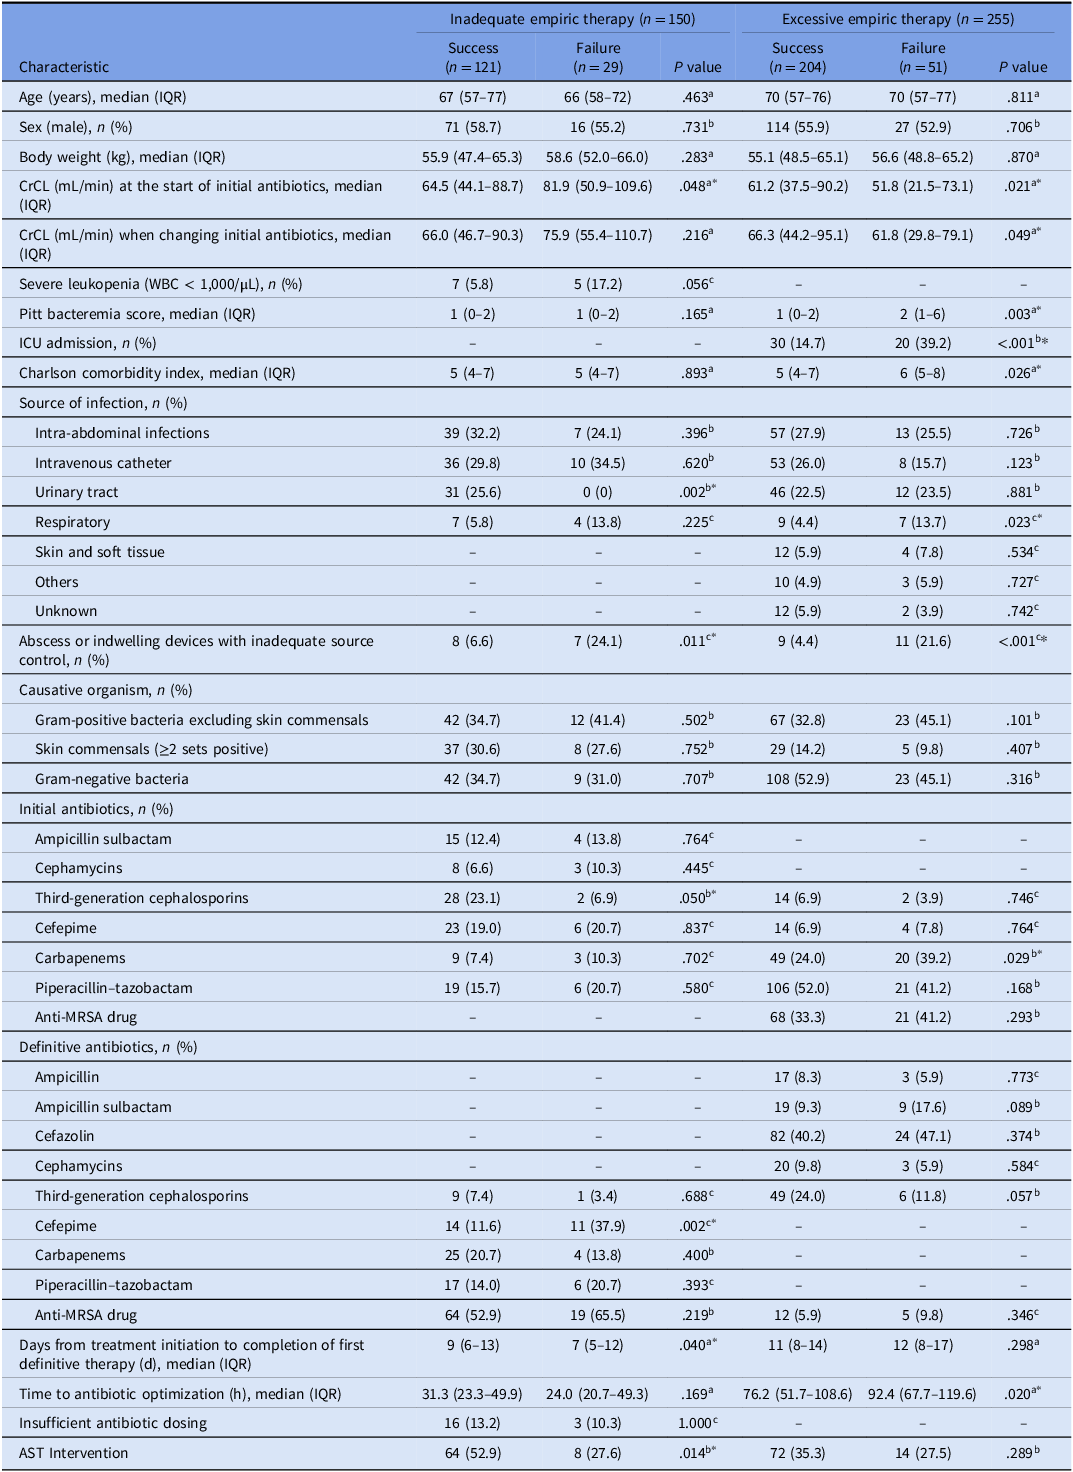
Table 3 shows the baseline characteristics according to treatment outcomes (success vs failure). In the inadequate group, urinary tract infections (31/121, 25.6% vs 0/29, 0%; P = .002) and AST intervention (64/121, 52.9% vs 8/29, 27.6%; P = .014) were more frequent in successes, whereas inadequate source control was more frequent in failures (8/121, 6.6% vs 7/29, 24.1%; P = .011). In the excessive group, the time to antibiotic optimization was shorter in patients with successful treatment (median, 76.2 vs 92.4 h; P = .020), whereas ICU admission (30/204, 14.7% vs 20/51, 39.2%; P < .001), inadequate source control (9/204, 4.4% vs 11/51, 21.6%; P < .001), PBS (median, 1 vs 2; P = .003) and CCI (median, 5 vs 6; P = .026) were higher in failures. Based on these findings, multivariable models for the inadequate group included time to antibiotic optimization, PBS, inadequate source control, and AST intervention, with Firth’s penalized likelihood applied owing to the limited number of events. For the excessive group, CCI was additionally included.
Baseline characteristics of patients according to treatment outcome: univariate comparisons

Table 3 Long description
The table compares baseline characteristics of patients according to treatment outcome, divided into inadequate and excessive empirical therapy groups. It includes data on success and failure rates, patient demographics, clinical factors, and treatment details. Key findings include higher frequencies of urinary tract infections and AST intervention in successes within the inadequate group, while inadequate source control was more frequent in failures. In the excessive group, shorter time to antibiotic optimization was associated with successful treatment, whereas ICU admission, inadequate source control, Pitt bacteremia score, and Charlson comorbidity index were higher in failures. The table also lists initial and definitive antibiotics used, and the time to treatment completion.
Note. IQR, interquartile range; CrCL, creatinine clearance; WBC, white blood cell; ICU, intensive care unit; MRSA, methicillin-resistant Staphylococcus aureus; AST, antimicrobial stewardship team.
a Mann–Whitney U-test.
b Chi-square test.
c Fisher’s exact test.
* P values ≤ .05 were considered statistically significant.
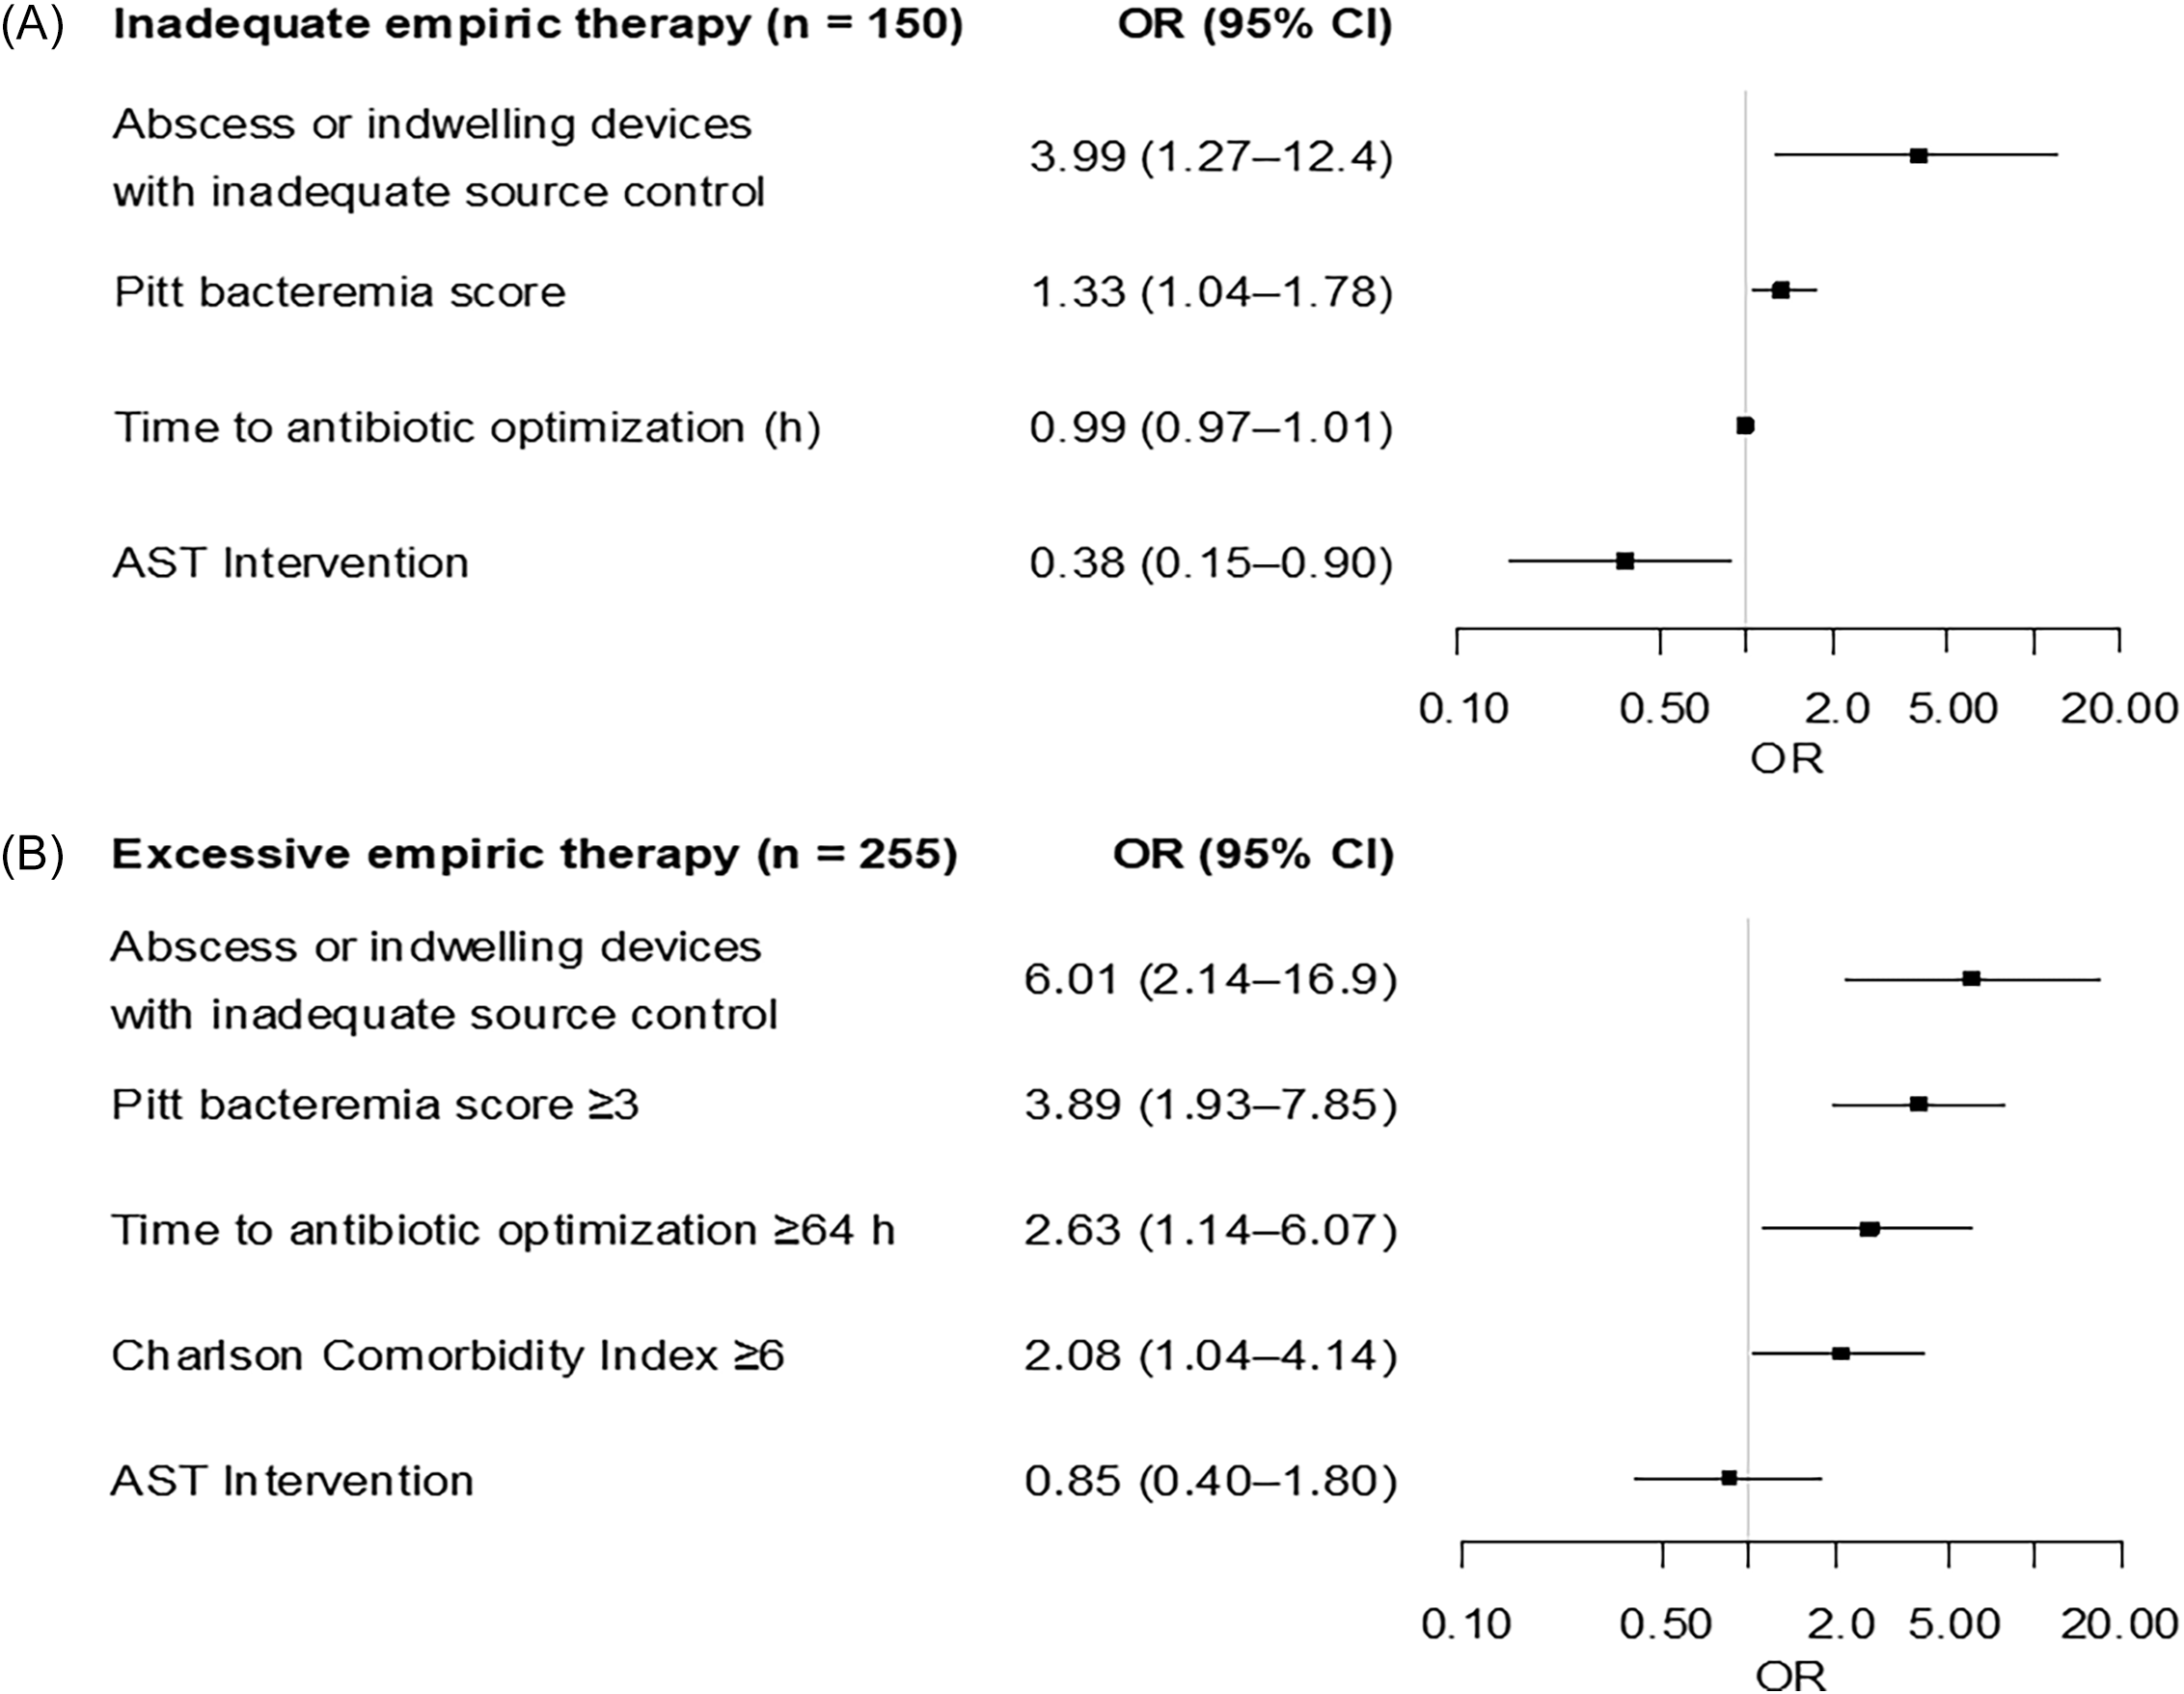
Figure 2 presents the adjusted odds ratios (ORs) for treatment failure among patients who received either inadequate or excessive empiric therapy. In the inadequate group, inadequate source control was associated with treatment failure (OR, 3.99; 95% CI, 1.27–12.4; P = .018), and higher PBS was also an independent risk factor (OR, 1.33; 95% CI, 1.04–1.78; P = .026). AST intervention was independently associated with treatment success (OR, 0.38; 95% CI, 0.15–0.90; P = .028). Time to antibiotic optimization was not significantly associated with treatment failure (OR, 0.99; 95% CI, 0.97–1.01; P = .514). In the excessive group, inadequate source control (OR, 6.01; 95% CI, 2.14–16.9; P < .001), PBS ≥3 (OR, 3.89; 95% CI, 1.93–7.85; P < .001), time to antibiotic optimization ≥64 hours (OR, 2.63; 95% CI, 1.14–6.07; P = .023), and CCI ≥ 6 (OR, 2.08; 95% CI, 1.04–4.14; P = .038) were independent risk factors. AST intervention was not associated with treatment failure in this group (OR, 0.85; 95% CI, 0.40–1.80; P = .675). The 64-h cutoff was determined using ROC analysis (Supplementary Figure 1).
Adjusted odds ratios for treatment failure. (A) Inadequate empiric therapy. Adjusted odds ratios for treatment failure, including abscess or indwelling devices with inadequate source control, Pitt bacteremia score, time to antibiotic optimization, and AST intervention. (B) Excessive empiric therapy. Adjusted odds ratios for treatment failure, including inadequate source control, Pitt bacteremia score ≥3, Charlson Comorbidity Index ≥6, time to antibiotic optimization ≥64 hours, and AST intervention. Odds ratios are presented with 95% confidence intervals on a logarithmic scale. The vertical line indicates no association (OR = 1). The exact P values are provided in Supplementary Table 2. OR, odds ratio; CI, confidence interval; AST, antimicrobial stewardship team.

Figure 2 Long description
A box-and-whisker plot displays adjusted odds ratios for treatment failure with inadequate empiric therapy. The plot includes two sections: (A) Inadequate empiric therapy and (B) Excessive empiric therapy. Each section shows odds ratios with 95% confidence intervals on a logarithmic scale. The vertical line indicates no association (OR = 1). Section (A) includes factors such as abscess or indwelling devices with inadequate source control, Pitt bacteremia score, time to antibiotic optimization, and AST intervention. Section (B) includes factors such as inadequate source control, Pitt bacteremia score 3, Charlson Comorbidity Index 6, time to antibiotic optimization 64 hours, and AST intervention. The exact P values are provided in Supplementary Table 2. OR, odds ratio; CI, confidence interval; AST, antimicrobial stewardship team.
In an exploratory analysis of 30-day mortality as a single outcome, time to antibiotic optimization was not significantly associated with mortality in the inadequate group (OR, 0.62; 95% CI, 0.27–1.46; P = .276). In contrast, in the excessive group, a significant association was observed (OR, 3.57; 95% CI, 1.09–11.7; P = .036). These findings were directionally consistent with the primary results observed for the composite outcome.
Sensitivity analyses excluding patients with skin commensals were largely consistent with the primary analyses. Time to antibiotic optimization was not associated with treatment failure in the inadequate group (OR, 1.00; 95% CI, 0.98–1.02; P = .894), whereas it was associated with treatment failure in the excessive group (OR, 2.33; 95% CI, 1.00–5.41; P = .049) (Supplementary Table 3).
Supplementary Table 4 presents outcomes according to causative organism. No statistically significant differences were observed overall; however, among patients with Gram-negative bacteria, there was a trend toward higher treatment failure rates with longer time to antibiotic optimization (5.6% for ≤24 h, 12.5% for 24–48 h, and 35.3% for ≥48 h; P = .082 for the ≥48 h group).
Safety outcomes
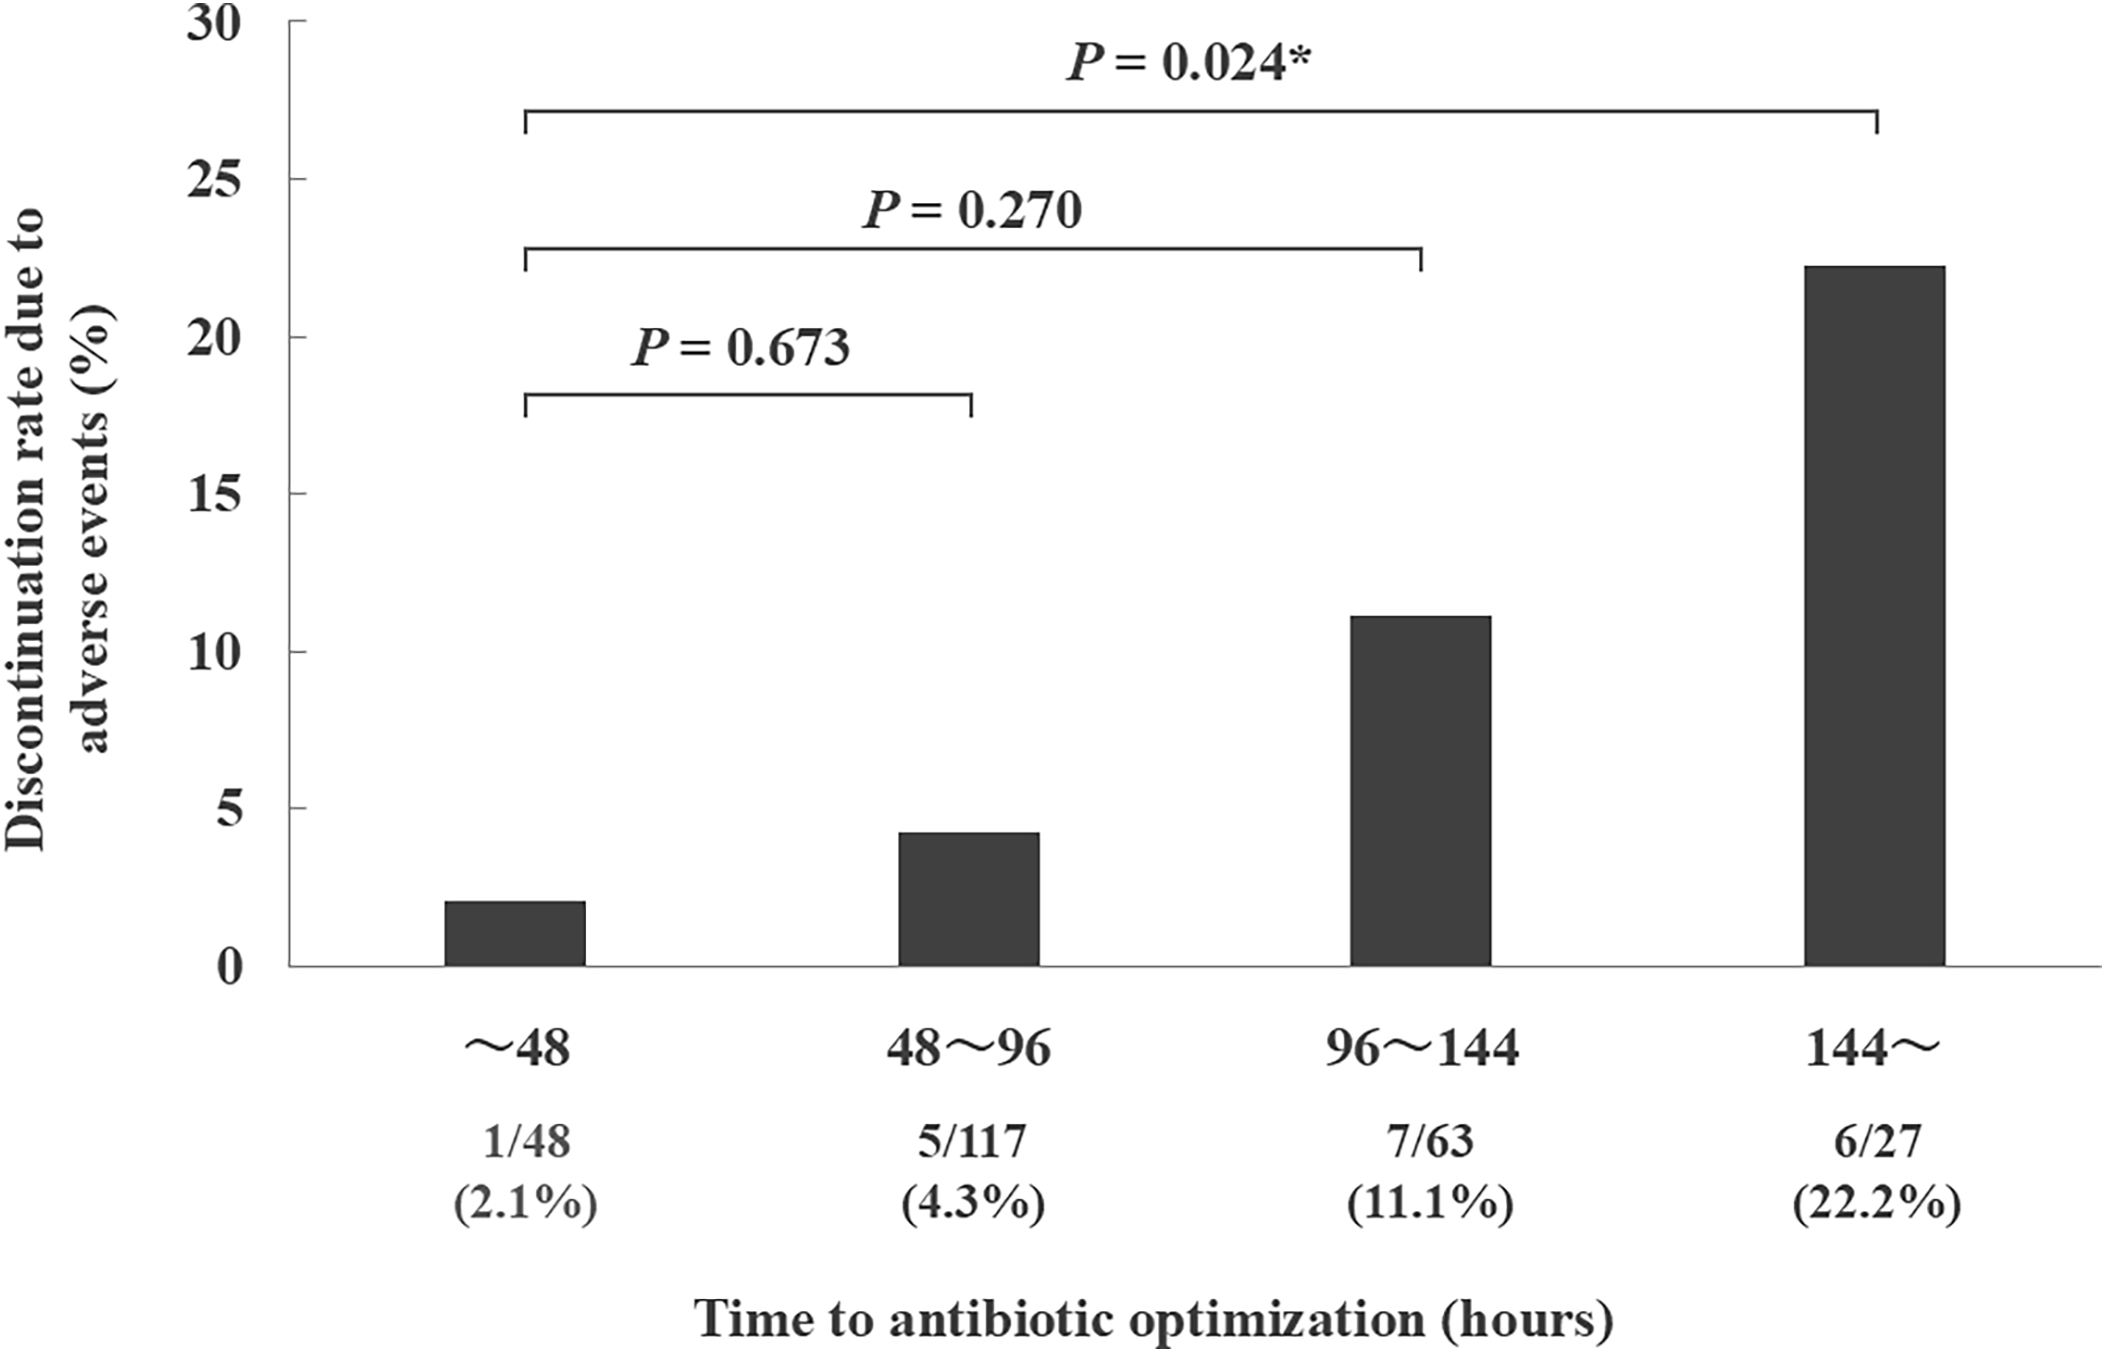
Figure 3 shows the association between the time to antibiotic optimization and adverse event–related discontinuation in the excessive group. Discontinuation rates tended to increase with longer time to antibiotic optimization, with a significant increase observed when optimization was delayed beyond 144 hours compared with that within 48 hours (6/27, 22.2% vs 1/48, 2.1%; P = .024). The optimal cutoff for predicting adverse event–related discontinuation was 100 hours (Supplementary Figure 2). Additionally, the total treatment duration was not significantly associated with discontinuation (OR 0.97; 95% CI 0.90–1.04; P = .437). In the excessive group, adverse event–related discontinuation was most common for meropenem (4/69, 5.8%) and piperacillin–tazobactam (7/127, 5.5%), and occurred occasionally with cefepime, levofloxacin, vancomycin, daptomycin, and ceftriaxone (Supplementary Table 5). All discontinuations except those for ceftriaxone occurred during empiric therapy.
Association between time to antibiotic optimization and adverse event–related discontinuation in patients who received excessive empiric therapy. The patients were stratified according to the interval between the initiation of empiric therapy and antibiotic optimization. Discontinuation rates for 48–96 hours, 96–144 hours, and ≥144 hours were evaluated relative to optimization within 48 hours. A significantly higher rate of adverse event–related discontinuation was observed when optimization occurred after ≥144 hours. The bars indicate the proportion of patients with discontinuation in each time interval. To control for the family-wise error rate in the multiple comparisons, P values were adjusted using Holm’s method. *P values ≤ .05 were considered statistically significant.

Figure 3 Long description
The bar graph compares the discontinuation rate due to adverse events in patients who received excessive empiric therapy, stratified by the time to antibiotic optimization. The x-axis represents the time to antibiotic optimization in hours, divided into four intervals: approximately 48 hours, 48 to 96 hours, 96 to 144 hours, and 144 hours and beyond. The y-axis represents the discontinuation rate due to adverse events in percentage. There are four vertical bars, each representing a different time interval. The first bar, representing approximately 48 hours, shows a discontinuation rate of 2.1%. The second bar, representing 48 to 96 hours, shows a discontinuation rate of 4.3%. The third bar, representing 96 to 144 hours, shows a discontinuation rate of 11.1%. The fourth bar, representing 144 hours and beyond, shows a discontinuation rate of 22.2%. The graph includes P values indicating statistical significance between the different time intervals. The P value between approximately 48 hours and 48 to 96 hours is 0.673, between approximately 48 hours and 96 to 144 hours is 0.270, and between approximately 48 hours and 144 hours and beyond is 0.024, which is considered statistically significant. The bars are colored in dark gray, and the graph includes annotations for the P values and the discontinuation rates. All values are approximated.
Discussion
This study investigated the effect of time to antibiotic optimization following inadequate or excessive empiric therapy on clinical outcomes. Among patients who initially received inadequate empiric therapy, the time to optimization was not associated with treatment failure, which differs from previously reported findings. Reference Paul, Shani, Muchtar, Kariv, Robenshtok and Leibovici1 This discrepancy likely reflects our cohort’s lower proportion of ICU admission. Nevertheless, some studies have reported that inadequate empiric therapy is associated with increased mortality, even without shock. Reference Kadri, Lai and Warner13,Reference Van Heuverswyn, Valik, Desirée van der Werff, Hedberg and Giske14 Kadri et al. Reference Kadri, Lai and Warner13 excluded skin commensals, whereas Van Heuverswyn et al. Reference Van Heuverswyn, Valik, Desirée van der Werff, Hedberg and Giske14 included them, although they accounted for less than 10% of isolates. By contrast, in our study, skin commensals comprised 30.0% (45/150) of isolates in the inadequate group. Although positive blood cultures for skin commensals may sometimes reflect contamination, inclusion was restricted to patients with clinical signs of infection and at least two positive sets, substantially increasing the likelihood of true bacteremia. Source control is essential in catheter-related bloodstream infections caused by skin commensals, Reference Hebeisen, Atkinson, Marschall and Buetti15 potentially limiting the impact of optimization time. However, sensitivity analyses excluding skin commensals yielded results largely consistent with the primary analysis, indicating that their inclusion did not bias the association between time to optimization and clinical outcomes. These findings underscore the importance of interpreting skin commensals alongside clinical symptoms and multiple positive blood culture sets, and suggest that careful consideration of blood culture indications may strengthen diagnostic stewardship efforts.
Additionally, we examined infection types in which the impact of antibiotic susceptibility on clinical outcomes may differ. All urinary tract infections within the inadequate group achieved treatment success. Prior studies have suggested that, in urinary tract infections, outcomes may remain unchanged even when initial therapy is microbiologically inactive against the causative organism. Reference Hashimoto, Shoji, Ishiguro and Miyairi16 This phenomenon may partially explain the absence of an association between time to optimization and treatment failure in this group.
Conversely, in patients who received excessive empiric therapy, delayed optimization (≥64 h) was associated with an increased risk of treatment failure. This finding aligns with those of previous reports that showed excessive empiric therapy and failure to perform de-escalation were associated with increased mortality. Reference Rhee, Kadri and Dekker6,Reference Zhao, Zhang, Liang, Wang and Cai17 However, the mechanism linking delayed optimization to treatment failure remains uncertain. The results of secondary analyses linked delayed optimization to adverse event–related discontinuation. Although this link might suggest prolonged cumulative antibiotic exposure, the total treatment duration showed no such association with adverse event–related discontinuation. This lack of association implies that the duration of excessive empiric therapy, rather than the overall therapy, drives adverse events. This inference is supported by evidence that higher daily spectrum exposure increases the risk of Clostridioides difficile infection, Reference Ray, Strnad and Tucker18 illustrating how the extended use of unnecessarily broad agents predisposes patients to adverse clinical consequences. Combined with the primary analysis, these observations underscore the importance of prompt optimization of empirical therapy to minimize preventable harm and improve clinical outcomes.
AST intervention was independently associated with treatment success in the inadequate group, aligning with a previous study. Reference Sarkhi, Eljaaly and Kaki19 The positive impact of AST may be attributed to comprehensive stewardship activities, such as providing recommendations for appropriate dosing, source control, and further diagnostic investigations beyond antibiotic optimization.
This study has several limitations. First, a composite endpoint was used due to low event rates. The components were selected to reflect early treatment failure within a time frame influenced by antimicrobial optimization. Later outcomes, including recurrent bacteremia and unplanned readmission, were excluded because they are strongly influenced by overall treatment duration and factors extraneous to early antimicrobial management. However, exploratory univariate analysis using 30-day mortality as a single outcome produced directionally consistent results, reinforcing the robustness of our findings. Nevertheless, larger studies are needed to evaluate mortality directly.
Second, excluding patients not optimized within two weeks might select for favorable trajectories. Although delays in optimization among the included patients might reflect slower responsiveness to antibiotics, baseline severity and source control were adjusted for in the multivariable analysis. Moreover, evidence from randomized controlled trials indicates that de-escalation based solely on culture results does not influence mortality, Reference Leone, Bechis and Baumstarck20,Reference López-Cortés, Delgado-Valverde and Moreno-Mellado21 suggesting that the impact of responsiveness on study outcomes is likely limited.
Third, patients who could not be optimized owing to severe beta-lactam allergies were excluded to maintain the consistency of our definition of antibiotic optimization. Consequently, our findings may not apply to patients with certain antimicrobial allergies.
Despite these limitations, our findings are clinically meaningful for promoting the appropriate use of antibiotics.
In summary, delayed optimization in the excessive group was independently associated with treatment failure and adverse event–related discontinuation. These findings underscore the importance of prompt de-escalation of broad-spectrum antibiotics to mitigate adverse consequences and foster appropriate antibiotic utilization.
Supplementary material
The supplementary material for this article can be found at https://doi.org/10.1017/ice.2026.10420
Data availability statement
Data supporting the findings of this study are available from the corresponding author Yoh Takekuma upon request.
Acknowledgements
We thank Editage (www.editage.com) for English language editing.
Author contributions
All authors contributed to the conception and design of this study. Yusuke Niinuma, Yuki Morikaku, and Keita Hanaoka performed material preparation, data collection, and analysis. The first draft of the manuscript was written by Yusuke Niinuma, and all authors commented on previous versions of the manuscript. All the authors have read and approved the final version of the manuscript.
Financial support
None reported.
Competing interests
All authors report no conflicts of interest relevant to this article.