

Hella Eckardt has described in these pagesFootnote 1 a study of the landscape of the Bartlow Hills, Cambridgeshire, using a Geographic Information System (GIS). These systems are now widely used, perhaps for the reason that computer processing can appear to guarantee objectivity, but certainly because in the long run such a powerful tool saves time. However, despite the benefits of GIS technology, there are also potential pitfalls.Footnote 2 The Bartlow study provides a cautionary example that is worth noting, if only to avoid repetition of the same mistake.
The GIS tool chiefly used in the Bartlow study was viewshed analysis. Roman landscape studies have employed GIS for many years,Footnote 3 but, as Eckardt states, viewshed analysis has been little used.Footnote 4 This lack of previous experience makes the Bartlow study original and interesting, but it also highlights a methodological problem.
In one respect the viewshed analysis is exemplary. Four main Roman roads, enclosing an area of some 150 square kilometres, surround Bartlow. The viewshed (the areas that can be seen from there) is intersected by three of these roads for only a small proportion of their length, and by the fourth not at all. This shows convincingly that travellers on the roads would have had little opportunity to see the Romano-British barrows, leading to the reasonable conclusion that the constructors of the Bartlow Hills had no desire to make a physical impression on the users of these roads.
However, the study is not on such firm ground when considering the intervisibility of the Bartlow Hills and other barrows. A trap for the user of GIS is created by the imprecise location of nearly all the other Roman barrows relative to the precision of the viewshed. Perhaps the worst example arises in the case of the Shudy Camps barrow. It has an abbreviated four-figure grid reference in the Historic Environment Record (HER) data, recorded as TL 62 44. This reference designates a kilometre square with its south-west corner having an easting of 62 km and a northing of 44 km within 100 km by 100 km grid square TL. It is recorded in this way because the precise location of the monument is unknown. The text in the HER claims that the barrow was ‘just south of Shudy Camps Park’, but Alyson Taylor disagrees. She identifies a mound ‘on the western side’ of the park, and suggests that it might be Roman, Bronze Age or medieval.Footnote 5 An earlier view is that of Fox, who placed two symbols identifying ‘Barrows probably of Roman Origin’ on a map,Footnote 6 one north and one south of the park. These symbols scale to about 600 m across, so the positions they indicate are almost as imprecise as those specified by a kilometre grid square.
There is a clear contrast between the uncertainty of these statements about the position of this barrow and the rather precise way in which it is represented on Eckardt's GIS-generated map and perspective view. This prompts further investigation of the way in which the data were processed.
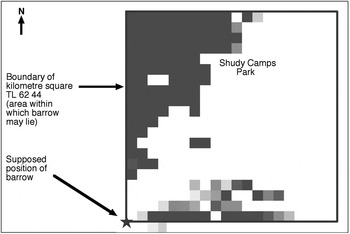
One of Eckardt's contributorsFootnote 7 supplied the author with an image showing the viewshed in square TL 62 44 (fig. 1). As in the perspective views presented in the original article, it represents the kilometre square as 400 pixels, each 50 m square. Pixels that are not in the Bartlow viewshed are white. Other pixels include those that are definitely visible, dark grey, covering 25 per cent of the square, and those less certainly visible, in lighter greys, covering an additional 7 per cent. On the basis of these figures the probability that the Shudy Camps barrow was visible from Bartlow lies between 25 and 32 per cent. Colour fig. 2 in Eckardt's article gives a different impression. The red symbol for the barrow is placed at the south-west corner of this square, as in fig. 1. This is the position a GIS will automatically show if given a reference to a grid square (in this case a square kilometre) as if it were a pair of precise coordinates. This point lies outside the viewshed so the figure makes it look as if the barrow is not visible from the Bartlow Hills and Eckardt, while noting that there is considerable debate about the date of the barrow, asserts that this is so.Footnote 8 Unfortunately, given that the estimated location is so imprecise, the barrow might logically be anywhere in the kilometre square and there is a substantial chance (between 1 in 4 and 1 in 3) that it was visible.
Bartlow viewshed in kilometre square TL 62 44.

This methodological error does not greatly affect the overall interpretation, since the other known barrows in the area appear to be on the margins of visibility or not visible, suggesting that other funerary monuments were not of prime importance to the barrow builders at Bartlow. Nevertheless, the analysis could be improved by making more use of the GIS to represent uncertainty. The viewshed created for the Bartlow study is already probabilistic;Footnote 9 it has a fringe of pixels with lower probability of being visible. In contrast, the representation of the position of sites was not treated in this way. The location of the Shudy Camps barrow, which should have been imagined as a probability covering a whole kilometre square, was reduced to a single point. This could be rectified by representing sites as areas containing an appropriate number of pixels. With a pixel size of 50 m x 50 m (as in this case) an area with a four-figure reference (defining a kilometre square) would contain 400 pixels; and an area referenced by six figures (defining a 100 m x 100 m square) would contain 4 pixels. Map algebra, an automatic replication of the counting procedure described above, could then be used to calculate, for each site, its probability of being in the viewshed. There appear to be eleven Roman (or possibly Roman) funerary sites, other than the Bartlow Hills themselves, lying within the area enclosed by the four surrounding main roads. This technique would be applicable to all but one of these sites, because the areas that define them exceed the 50 m pixel size.
Apart from these suggestions for improvement, the main purpose of this note has been to identify a potential source of error in the use of HER data. It is important to realise that an Ordnance Survey grid reference is not a set of coordinates; it is a label for a grid square whose size depends on the number of digits that the reference contains.Footnote 10 The author knows from experience that it is easy to remain in ignorance of this distinction, and hopes that this note might lead to better understanding of this potential pitfall in the use of GIS.
I would like to thank Hella Eckardt and Peter Brewer, for freely providing information, and the anonymous referees for helpful comments.