


INTRODUCTION
In laser-driven inertial confinement fusion, a symmetric, highly convergent implosion of a target is necessary (Lindl et al., Reference Lindl, Amendt, Berger, Glendinning, Glenzer, Haan, Kauffman, Landen and Sute2004). This requires not only the irradiation uniformity of laser beams or X-rays, but also the suppression of hydrodynamic instabilities. For example, the Rayleigh-Taylor instability will cause the mixing of pusher and fuel at the interface in a target, or even the target shell breakup. In experiments, to diagnose the symmetry of implosion, the hydrodynamic instability and its growth, or the area density of an imploded target, backlighting radiography is usually adopted, i.e., a kilo-electron-volt X-ray beam emitted from a backlighter goes through the target and is received by an imager to the target.
Several imagers such as pinholes, Kirkpatrick-Baez (K-B) microscopes, and curved crystals have been used for X-ray imaging (Koch et al., Reference Koch, Aglitskiy, Brown, Cowan, Freeman, Hatchett, Holland, Key, Mackinnon, Seely, Snavely and Stephens2003; Marshall et al., Reference Marshall, Allen, Knauer, Oertel and Archuleta1998; Gotchev et al., Reference Gotchev, Jaanimagi, Knauer, Marshall, Meyhofer, Bassett and Oliver2003). Pinhole imaging is the simplest, but it is limited by low collection angle and the spatial resolution by the pinhole size, on the order of 5–10 µm. The other two have larger collection angle and the theoretical resolution is better. K-B microscopes have been widely used, for example, in experiments of equation-of-state measurements, hydrodynamic instability investigations (Collins et al., Reference Collins, Dasilva, Celliers, Gold, Foord, Wallace, Ng, Weber, Budil and Cauble1998; Gotchev et al., Reference Gotchev, Jaanimagi, Knauer, Marshall, Meyhofer, Bassett and Oliver2003). Nevertheless, affected by aberrations or the surface quality of the K-B mirrors, the field of view (FOV) was limited to a few hundred microns and the best resolution 2–3 µm (Marshall et al., Reference Marshall and Bennett1999; Mu et al., Reference Mu, Wang, Yi, Wang, Huang, Zhu and Huang2009). For some issues, such as the plasma density gradient at interfaces (Azechi et al., Reference Azechi, Sakaiya, Fujioka, Tamari, Otani, Shigemori, Nakai, Shiraga, Miyanaga and Mima2007), or the filamentation of electron beams in dense plasmas (Taguchi et al., Reference Taguchi, Antonsen, Liu and Mima2001), a higher resolution is necessary for X-ray imaging diagnostics. Taking into account of FOV for imaging a laser-fusion target, an ideal imager should have an FOV on the order of 1 mm, and a spatial resolution as good as 1 µm.
Fresnel zone plate (FZP) imaging, based on the diffraction of X-rays, has provided in X-ray microscopy the highest spatial resolution, as high as 10 nm (Chao et al., Reference Chao, Harteneck, Liddle, Anderson and Attwood2005; Tian et al., Reference Tian, Li, Chen, Liu, Liu, Tkachuk, Tian, Xiong, Gelb, Hsu and Yun2008). There appeared experiments of using FZP's in high-resolution X-ray imaging of laser plasmas (DaSilva et al., Reference Dasilva, Trebes, Mrowka, Barbee, Brase, Koch, London, Macgowan, Matthews, Minyard, Stone, Yorkey, Anderson, Attwood and Kern1992; Cauchon et al., Reference Cauchon, Pichet-Thomasset, Sauneuf, Dehz, Idir, Ollivier, Troussel, Boutin and Lebreton1998; Azechi et al., Reference Azechi, Tamari and Shiraga2003). Different from X-ray microscopy in which the FOV is on the order of 10 µm, for imaging a laser-fusion target, the FOV has to be on the order of 1 mm. On the other hand, 1-μm spatial resolution should be enough for imaging a laser-fusion target. So it is necessary to reconsider the FZP imaging related to fusion diagnostics. As FZP imaging works at normal-incidence illumination, aberrations are avoided. It is anticipated that the FOV of FZP imaging should be larger than that of a K-B microscope, and the spatial resolution better as well.
In this work, the spatial resolution and the FOV of FZP imaging at the Ti-Kα line (0.275 nm) are analyzed and compared to the imaging of a K-B microscope. The work is organized as follows. First, the FOV of the K-B microscope is presented. Next the analyses of FZP imaging are presented, including the imaging principle, the numerical study on the FOV, and the influence of polychromatic light. Finally, the properties of the two imagers are compared and conclusions are given.
IMAGING OF A K-B MICROSCOPE
For a single spherical mirror, e.g., the left one in Figure 1, the imaging for paraxial rays in the meridian plane (y-z plane in Fig. 1) and the sagittal one (x-z plane) separately satisfies (Kirkpatrick & Baez, Reference Kirkpatrick and Baez1948):


The schematic diagram of K-B microscope imaging.

In which u, v, or v′ are the distances from the source to the mirror, and the mirror to the image, respectively, R is the radius of the mirror, and θ is the grazing incidence angle. Since θ is small, severe astigmatism exists so that the image in the meridian plane does not overlap with that in the sagittal plane. When the second same spherical mirror is combined orthogonally with the first one, which is called a K-B microscope (Kirkpatrick & Baez, Reference Kirkpatrick and Baez1948), and by choosing the two grazing-incidence angles θ1 and θ2, the images of the meridian and the sagittal planes could overlap, and a two-dimensional stigmatic image could be formed on the image plane. For this case:


In which w is the spacing of the two mirrors. Although a stigmatic image is formed, primary aberrations like the spherical aberration still exist (Kirkpatrick & Baez, Reference Kirkpatrick and Baez1948). Ray-tracing simulations are usually used to analyze the imaging of a K-B microscope.
A home-made code was developed for the ray-tracing simulation (Wang et al., Reference Wang, Chen and Wang2010). Briefly, the numerical recipe of the code is based on the coordinate transformation when tracing each ray of light. The point spread function is calculated for a point source, which is set to locate at different positions on the object plane, to determine the spatial resolution. The spatial resolution is defined as the object-plane size, for its corresponding size as the diameter on the image plane, the circular area contains 68% energy of the image.
Table 1 gives the parameters of the K-B microscope and the simulated setup conditions. The K-B microscope is composed of two gold spherical mirrors. The two grazing-incidence angles θ1 and θ2 are selected according to Eqs. (3) and (4). The angles are smaller than the critical angle for total reflection on a gold mirror surface, which is 1.018° at the Ti Kα line. So an efficient reflection from the mirror surfaces is expected. The image-to-source magnification is M = 10, which is typical in experiments. The collecting angle of the K-B microscope is ΔΩ = 4 × 10⁻⁷ sr.
Parameters of the K-B microscope imaging

Figure 2 presents the simulated spatial resolution of the K-B microscope along two orthogonal directions of the object plane. It shows that at the FOV center, the best resolution is 0.71 µm. Away from the FOV center, the spatial resolution of the K-B microscope decreases rapidly. The FOV for spatial resolutions better than 6 µm is about 400 µm (±200 µm from the FOV center). These results agree with experimental measurements (Marshall et al., Reference Marshall and Bennett1999; Mu et al., Reference Mu, Wang, Yi, Wang, Huang, Zhu and Huang2009). Aberrations are the main cause. With the increase of the FOV, the aberrations increase, which decrease the spatial resolution and in turn limit the high-resolution or the effective FOV of the K-B microscope.
The spatial resolution of the K-B microscope versus the point source position on the object plane. Position 0 is the FOV center. (a) Along x-axis. (b) Along y-axis.

IMAGING OF AN FZP
Principle of Imaging
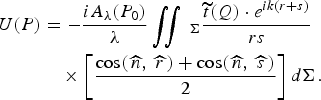
Figure 3 shows the schematic of an FZP imaging. Suppose a point source at P 0(x 0,y 0,z o) on the object plane, its monochromatic radiation amplitude is A λ(P 0). When the light goes through the FZP, whose transmission function is t, the amplitude at point P(x,y,z) on the image plane is given by the Fresnel-Kirchhoff diffraction formula (Born & Wolf, Reference Born and Wolf2001):
The schematic diagram of FZP imaging. The optical axis (z-axis) goes through the FZP center and is parallel to the FZP normal.

In which the integrating area Σ is the FZP. r and s are the distances from P 0 to point Q(ζ,η,0) on the FZP surface, and from Q to P, respectively.  are the angles between the FZP normal and the wave vectors of the incident light and the diffracted light, respectively. For applications, there is a good approximation
 . Thus,
 , and Eq. (5) is simplified to:

The intensity is |U(P)|2. It should be pointed out that in Eq. (6), the Fresnel approximation is not used, which was adopted in analyzing an FZP imaging in microscopy. By using the Eq. (6), the FZP imaging of an off-axis source could be analyzed in the regime where the Fresnel approximation cannot be applied (Wang & Wang, Reference Wang and Wang2011).
When including the spectral bandwidth of an incoherent source, the intensity at P is the incoherent superposition:

For the FZP, the outer radius of each half-wave zone is related to the primary focus, the first-order diffraction focus, of the FZP, as given by:

in which l denotes the lth zone, N is the total number of zones, f = r 12/λ is the primary focal length, λ is the X-ray wavelength. In the present work, the odd-number zones are set as transparent; the even-number zones are made of the FZP material and are partially transparent to X-rays. So the transmission function  is:

in which d is the thickness of the FZP, k = 2π/λ. β and δ are from Henke et al. (Reference Henke, Gullikson and Davis1993), related to complex refractive index ñ as: ñ = 1 − δ + iβ.
In Figure 3, p and q are the on-axis distances from the FZP to the object plane and the image plane, respectively. p, q, and f satisfy:

Eqs. (6)–(10) are the fundamentals for the following numerical studies of the FZP imaging.
The parameters of the FZP are listed in Table 2. The FZP material is gold, thickness d = 900 nm, which is optimized for the efficiency of the first-order diffraction (Kirz, Reference Kirz1974). The FZP diameter is D = 140 µm, containing a total number of half-wave zones N = 100. For the Ti Kα line at 0.275 nm, the primary focal length is 178 mm. For the FZP, the width of the outmost zone is chosen to be 0.35 µm. Albeit the narrower the outmost zone and the more the total number of the zones, the higher the spatial resolution and the larger the collection angle, fabricating such an FZP by X-ray lithography would also become more difficult (Liu et al., Reference Liu, Liu, Ying, Chen, Kang, Huang and Tian2008). As will be seen in the following, the FZP satisfies the diagnostic requirements.
Parameters of the FZP imaging

Spatial Resolution Limit
The spatial resolution limit is usually defined by the Rayleigh criterion. For this, a numerical calculation was done to consider a parallel X-ray beam incident normally onto the FZP. Figure 4 shows the intensity distribution of the primary focus at q = f. It is seen that the parallel X-ray beam is focused by the FZP to a tiny spot. The width from the intensity peak to the first minimum is 0.43 µm, corresponding to an angular width Δθm = 2.4 × 10⁻⁶ rad. Therefore, according to the Rayleigh criterion, the angular resolution limit is 2.4 × 10⁻⁶ rad, and the spatial resolution limit is Δr m = f · Δθm = 0.43 µm.
The intensity distribution of the FZP focus along x-direction.

An analytical theory (Stigliani et al., Reference Stigliani, Mittra and Semonin1967) shows that when N > 200, the angular resolution limit is Δθth = 1.22λ/D, and the spatial resolution limit is Δr th = 1.22Δr out, Δr out is the width of the outmost zone. Inserting the FZP parameters, one obtains Δθth = 2.4 × 10⁻⁶ rad and Δr th = 0.43 µm, in agreement with the numerical calculations. So the spatial resolution limit is not affected even for a total number of 100 zones.
FOV of the FZP
By placing a point source at different positions on the object plane, the FZP imaging is simulated and the FOV is obtained. For simplicity, a monochromatic point source is supposed and, for a typical case, the magnification is taken as M = 10, which means p = 1.1f, q = 11f. Figure 5 shows the image intensity distributions when the point source located at different positions in the object plane. For visibility, the intensity distributions of the off-axis images are displaced so that in all the cases the peak intensity is at position zero in the plot. When the point source is on the optical axis, the width from the intensity peak to the first minimum is 4.70 µm, the corresponding angular width Δθ = 2.4 × 10⁻⁶ rad, in consistent with the minimum resolving angle of the FZP. In the present case, p = 1.1f, the spatial resolution is then p · Δθ = 0.47 µm, still very close to the spatial resolution limit, 0.43 µm, of the FZP.
(a) The intensity distribution of the FZP image when the point source is, along x-axis, at different positions from the optical axis. Solid line: the source on the optical axis. Dot line: the source is 5 mm away from the optical axis. Dash line: the source is 13 mm away. Dash-dot line: the source is 17 mm away. (b) The change of the image's peak intensity and width in FWHM with the point source position. Position 0 means the source is on the optical axis. The corresponding spatial resolution on the object plane is, defined by the Sparrow criterion, equal to the image width divided by the magnification. The dash-dot line denotes the source position where the image's peak intensity decreases by 20%.

Figure 5a also shows that when the point source is away from the optical axis to some extent, the image pattern starts to smear. In the intensity distribution, along with the decrease of the peak intensity, the wing becomes enhanced and the first minimum disappears. In this case, the image quality could be judged from the changing of the image's peak intensity. An acceptable tolerance for high-quality imaging is, compared to the case when a point source is on the optical axis, the point source is away from the axis till its image's peak intensity decreases by 20% (Born & Wolf, Reference Born and Wolf2001). The spatial resolution could be defined more conveniently by the so-called Sparrow criterion as the size in the object plane corresponding to the full width at half maximum (FWHM) of a point source's image. Note in the case of diffraction limit, the ratio of the Rayleigh resolution limit to the Sparrow resolution limit is 1.2.
As seen from Figures 5a and 5b, when the point source is off but close to the optical axis, e.g., 5 mm away, both the image's peak intensity and the FWHM almost do not change, which means that both the image quality and spatial resolution do not change as compared to the on-axis case. When the source is 13 mm away, the peak intensity decreases to 80% of that on the axis. But the image FWHM increases from 3.95 µm to 4.27 µm, less than 10% change. So, considering the symmetry of the FZP, an effective FOV for high-quality imaging is 26 mm (±13 mm away from the optical axis), corresponding to a viewing angle of 7.6°. Within it, the spatial resolution is close to the resolution limit and a high-quality image can be obtained as well. For a laser-fusion ignition target, its size is on the order of 10 mm, the FZP should be able to image, without changing the diagnostic setup, the whole or part of the target with a high resolution.
If the point source is further away from the optical axis, its image's peak intensity decreases quickly. For example, in Figure 5a, when the source is 17 mm away, the image's peak intensity decreases to 51% of that on the axis, and the wing is evidently enhanced. Obviously, the enhancement of the wing will lower the image contrast. Along with the decrease of the peak intensity, the spatial resolution also decreases evidently, as shown in Fig. 5(b). These two effects would deteriorate the image quality.
Influence of Polychromatic Light on the FZP Imaging
When the incident light is not monochromatic, for example, it is the mix of the Kα line and continuum, or other K-shell lines, the influence of the spectral bandwidth on the FZP imaging has to be considered. Suppose the incident light is spectrally centered at λ0 = 0.275 nm, with a bandwidth λ0 ± Δλ/2, in which the spectral density is constant. By varying the Δλ/λ but keeping the same spectrally-integrated intensity, the FZP imaging of an on-axis point source is simulated using Eq. (7), the influence of polychromatic light can be found.
Figure 6 shows for M = 10 the change of image's peak intensity and FWHM versus the spectral bandwidth. When the bandwidth is increased to some extent, the peak intensity decreases, and the wing is enhanced that is similar to the phenomenon in Figure 5a, which would lower the image contrast. Compared to the monochromatic imaging, when the spectral bandwidth of a polychromatic light is increased to Δλ/λ = 1.75%, the image's peak intensity decreases to 80%. However, the FWHM of the image changes from 3.95 µm to 4 µm, only 1% variation, which means that the spatial resolution is almost unchanged. This indicates that the influence of the spectral bandwidth on the FZP imaging is mainly to lower the image contrast. Therefore, for the X-ray radiography application with the FZP as an imager, if the spectral bandwidth of the recorded image is controlled to be less than 1.75%, high-quality imaging could be realized.
The change of the image's peak intensity and width in FWHM with the spectral bandwidth. The dash-dot line denotes the spectral bandwidth, for which the image's peak intensity decreases by 20%. The inset shows the spectral intensity distribution for modeling a polychromatic incident light.

The influence of the polychromatic light on the FZP imaging could be interpreted by the chromatic property of the FZP. In Eq. (8), the FZP's focal length is f = r 12/λ. Given the objective and the imaging distances, only the light of the wavelength λ0 and those very close to the wavelength could be imaged well on the image plane at the imaging distance q = q(λ0), at which the images by the other wavelengths will be smeared. Numerical calculations reveal that for a monochromatic light of the same intensity as that of the λ0, if its wavelength is 0.5% off the λ0, the image's peak intensity will decrease to 80% of that of the λ0. Therefore, for the FZP imaging of a polychromatic light, the contributions to the image are only from the wavelength λ0 and the very nearby wavelengths. Thus, the chromatism of the FZP makes it capable of forming a monochromatic image at the λ0.
DISCUSSIONS
The above results show that for X-ray imaging, the spatial resolution and the FOV of the FZP are much better than those of the K-B microscope. The resolution of the K-B microscope is limited by aberrations. For the FZP, working at normal incidence, the aberrations are avoided, and the spatial resolution is equal or close to the diffraction limit. Second, the spatial resolution of the K-B microscope decreases rapidly as its FOV increases to ± 200 µm. But for the FZP, the spatial resolution is close to the diffraction limit within a large FOV of 26 mm. So, such a K-B microscope is only appropriate for a high-resolution imaging of smaller FOV, but the FZP can be applied to a much wider FOV. It is anticipated that the FZP will be unique in X-ray imaging of a high resolution and a large FOV.
The efficiency of the two imagers can be compared. For a single spherical mirror of golden surface, at grazing incidence of θ1 or θ2, the reflectivity at 0.275 nm is about 50% (Henke et al., Reference Henke, Gullikson and Davis1993), then the total reflection for the K-B microscope is 25%. If the surfaces of the K-B mirrors are replaced by iridium, the total reflection will be 36%. For the FZP, the efficiency is calculated to be 18%. For the same collecting angle as given in Tables 1 and 2, the efficiency of the K-B microscope with Ir surfaces is about two times of that of the FZP. If the grazing-incidence angle θ1 and θ2 are decreased to 0.4°, the total reflection of the K-B microscope will be 64%, three times higher than that of the FZP. So a K-B microscope is more appropriate for imaging a not-so-bright source.
For the FZP imaging, the direct light, or the zeroth-order diffraction of the FZP, would form a primary background on the image plane and thus degrade the image quality. Several approaches have been adopted to improve the image quality, e.g., by inserting a central stop to block the zeroth order (Kirz, Reference Kirz1974; Michette, Reference Michette1986). For the present FZP imaging, due to the phase shift caused by the FZP opaque zones, the efficiency of the first-order diffraction is increased to 18% of the incident light, and the background by the zeroth order is decreased to 9%. Thus, even not using a central stop, the image contrast is nearly 0.5, which should be enough to obtain information of the image. An advantage of the FZP imaging is to see tiny-spot structures such as filaments in an extended source. The sharp images of the tiny spots, though superimposed on the background, should be much easier to be discriminated. However, in imaging of an extended source, if the source is spatially coherent, the 0th-order light from the different positions of the source may interfere each other and cause spatial structures in the background, which would disturb the image. So a spatially incoherent extended source, which is common for laser plasmas and fusion targets and is supposed in the present analysis, should be able to avoid such interferences.
Finally, the influence of the polychromatic light on the two imagers is different. For the K-B microscope, there is no chromatic effect. By adding a reflection layer on the K-B mirror surfaces, a monochromatic image could be obtained (Mu et al., Reference Mu, Wang, Yi, Wang, Huang, Zhu and Huang2009). For the FZP, the chromatism would decrease the image quality by lowering the contrast, so a monochromatic or a narrow spectral bandwidth is preferred. By selecting a line emission (Dasilva et al., Reference Dasilva, Trebes, Mrowka, Barbee, Brase, Koch, London, Macgowan, Matthews, Minyard, Stone, Yorkey, Anderson, Attwood and Kern1992), or combining with a multilayer mirror (Cauchon et al., Reference Cauchon, Pichet-Thomasset, Sauneuf, Dehz, Idir, Ollivier, Troussel, Boutin and Lebreton1998), or adding absorption filters in the imaging setup (Azechi et al., Reference Azechi, Tamari and Shiraga2003), it should be possible to realize monochromatic imaging with the FZP.
CONCLUSIONS
The FZP imaging at the Ti Kα line is analyzed in the regime where the Fresnel approximation cannot be applied. The proposed FZP has a spatial resolution limit of 0.43 µm. For such an FZP and a typical experimental setup with an image-to-object magnification of 10, a large FOV of 26 mm could be obtained, within which the FZP imaging has a spatial resolution close to the resolution limit. Compared to the imaging by a K-B microscope under similar experimental configurations, the K-B microscope has the best resolution of 0.71 µm at the FOV center and the resolution decreases significantly to 6 µm when the FOV is increased to about 400 µm. For polychromatic light illumination in the FZP imaging, if the spectral bandwidth is within 1.75%, a high-quality image can still be obtained. These results indicate the unique advantages of applying an FZP in high-resolution, large field-of-view X-ray imaging of laser-fusion targets, laser-plasma or other X-ray sources.
ACKNOWLEDGMENTS
This work was partially supported by the China National Hi-Tech Program and by the Chinese Academy of Sciences under Grant No. KJCX2-YW-N36.



