INTRODUCTION
The development of new barley cultivars adapted to the higher abiotic stress expected as a result of climate change (Sherwood & Fu Reference Sherwood and Fu2014) is a unique problem for plant breeders. In fact, contrary to most breeding objectives, adaptation to climate change is a moving target and possibly a different target in different locations (Ceccarelli Reference Ceccarelli, Jackson, Ford-Lloyd and Parry2014), since we do not know what is the exact combination of temperature increase and rainfall decrease expected in any given target environment. For example, models from the National Center for Atmospheric Research, USA (NCAR) and the Commonwealth Scientific and Industrial Research organization, Australia (CSIRO) show substantial differences. The NCAR model predicts a substantially higher temperature than does CSIRO. The CSIRO model predicts substantial precipitation decline in Western Amazon, while NCAR predicts decline in Eastern Amazon (Nelson et al. Reference Nelson, Rosegrant, Koo, Robertson, Sulser, Zhu, Ringler, Msangi, Palazzo, Batka, Magalhaes, Valmonte-Santos, Ewing and Lee2009). If there is such a level of discordance at the macro level, then it is obvious that an even higher uncertainty of predictions will exit at the micro level. Not knowing exactly what to breed for, whether using conventional plant breeding or molecular breeding, it is difficult to set up a programme of recombination and selection or of gene introgression, either relying on conventional breeding techniques only or on molecular breeding.
Also given the environmental impacts of the ‘Green Revolution’ package (ranging from a significant loss of biodiversity to accelerated soil erosion, water pollution and consequent eutrophication, and increased greenhouse gas emissions) there is a need to shift, at least in part, from the ‘conventional’ way of producing food, which relies on high external inputs, to a way that relies on the ability of the crop to efficiently overcome environmental limitations and climate unpredictability. There is also the need to select varieties adapted specifically to those low-input systems. In fact, plant breeding is generally conducted with the use of high inputs regardless of the target environment and therefore it has systematically missed the opportunity to exploit genetic differences at low-input levels (Ceccarelli Reference Ceccarelli1994, Reference Ceccarelli1996), for which it has been much less efficient (Ceccarelli Reference Ceccarelli2015). That this is possible is shown by differences among cultivar performance that have been found in agronomic systems with different input levels (Sinebo et al. Reference Sinebo, Gretzmacher and Edelbauer2002; Brancourt-Hulmel et al. Reference Brancourt-Hulmel, Heumez, Pluchard, Beghin, Depatureaux, Giraud and le Gouis2005; Murphy et al. Reference Murphy, Campbell, Lyon and Jones2007).
With the rapid disappearance of landrace populations from their primary and secondary centres of diversity, heterogeneous populations such as composite cross populations (CCPs) or line mixtures, left to evolve in low-input conditions, may represent the optimal source material for the selection of new cultivars (Smithson & Lenné Reference Smithson and Lenné1996; Horneburg & Becker Reference Horneburg and Becker2008). Lines to be used in CCP development or in mixtures can be chosen among old breeding lines, varieties or landraces because the specific characteristics required for low-input or organic farming systems might have disappeared in the actual breeding materials by selection under modern, high-input conditions (Lammerts Van Bueren et al. Reference Lammerts van Bueren, van Soest, de Groot, Boukema and Osman2005, Reference Lammerts van Bueren, Jones, Tamm, Murphy, Myers, Leifert and Messmer2011; Jalata Reference Jalata2011; Torricelli et al. Reference Torricelli, Ciancaleoni and Negri2014). However, due to difficulty of access to gene banks for retrieving landraces, and/or to the lack of locally adapted materials, parental lines could also be chosen among purposely developed heterogeneous populations that are maintained on-farm.
Considering the renewed interest in evolutionary breeding, understanding the evolution of diversity in heterogeneous population multiplication is critically important. In fact, the interactions between plants in these types of populations are extremely complex and depend on a number of dynamic factors (Phillips & Wolfe Reference Phillips and Wolfe2005). It is generally expected that natural selection affects and drives the evolution of both genetic and morphological diversity of heterogeneous populations multiplied without conscious selection, with more competitive types making up a greater and greater proportion of populations in later generations (Harlan & Martini Reference Harlan and Martini1938). Allard & Hansche (Reference Allard, Hansche and Norman1964) suggested that yield increase over time is the result of natural selection and competition among plants in broadly based populations. In the case of barley composites evolution, Jain & Qualset (Reference Jain, Qualset and Gaul1975) reported directional selection for seed yield per plant and stabilizing selection for days to heading, seed size, spike length and spike density; Mak & Harvey (Reference Mak and Harvey1982) underlined shifts towards later maturity, increasing tallness and small grain size and, finally, Patel et al. (Reference Patel, Reinbergs, Mather, Choo and Sterling1987) observed lines that were higher yielding, later heading and taller than the originals. More recent studies on the effects of natural selection on evolution and adaptation of cultivated bread wheat heterogeneous populations, multiplied in different environments in France, suggested uniform increase of plant height, divergent evolution of earliness (in relation to the multiplication environments) (Goldringer et al. Reference Goldringer, Prouin, Rousset, Galic and Bonnin2006) and an evolution of disease resistance linked to pathogen pressure in the specific environment (Enjalbert et al. Reference Enjalbert, Dawson, Paillard, Rhoné, Rousselle, Thomas and Goldringer2011); these traits are of particular interest as breeding targets for organic or low-input agriculture.
In the late 1990s we developed a barley CCP, namely AUT DBA (where AUT indicates autumnal sowing and DBA is the acronym of the former Department), by crossing seven different parental populations (PP). Molecular characterization of both PP and AUT DBA, carried out using simple sequence repeat (SSR) molecular markers and after 13 years of multiplication without any human selection, indicated that the CCP was composed of a high number of multi-locus genotypes and that the mean genetic diversity parameters were not statistically different from those of the PP (Raggi et al. Reference Raggi, Ceccarelli and Negri2015). However, some degree of differentiation between PP and the CCP was found, suggesting that evolution occurred during the years of multiplication, and selection effects were detected for some loci co-localized with quantitative trait loci (QTLs) for adaptedness or tagging genes related to abiotic stress response. In particular, SSR loci associated with QTL for peduncle extrusion, plant height and grain yield were identified as potentially targeted by selection. Altogether, these observations clearly highlighted a need to improve knowledge of the population and, in particular, of its morphological diversity. Therefore, the main objectives of the current investigation were to: (i) characterize the morphological diversity existing in the AUT DBA population and its potential value as a source of breeding materials for low-input/organic agriculture; and (ii) identify the traits that contributed to the adaptive success of individuals of certain morphological and genetic groups in the population studied.
MATERIALS AND METHODS
Origin and principal characteristics of AUT DBA barley
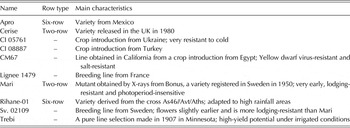
Different PP (Table 1, footnote), derived from crosses of cultivars, landraces and promising lines (Table 2) and which showed good agronomic performances under low-input conditions in Central Italy (Negri & Petti Reference Negri, Petti, Santucci and Zanoli1995), were inter-crossed in 1997 to produce the AUT DBA. Both two-row and six-row types were included in the PP to represent a very large array of germplasm of diverse origin. Consequently, the CCP resulting from their inter-crossing was expected to display large genetic diversity for several traits (lodging and stress tolerance/resistance, photoperiod responsiveness, etc.), which is required for this type of study. In particular, to develop the AUT DBA, the same number of plants of each of the seven PP was used as maternal parents and manually pollinated using a pollen bulk of all of the (other) PP. The same number of F1 seeds was then bulked, so that the AUT DBA was originally a balanced representation of the initial genetic variation. The AUT DBA was then multiplied for 13 years without any conscious human selection under a low-input management system (46 kg N/ha per annum and without the application of any other chemicals) in the Department experimental field (43°02′N, 12°25′E, 174 m a.s.l.). Each year, no fewer than 30 000 individuals were multiplied.
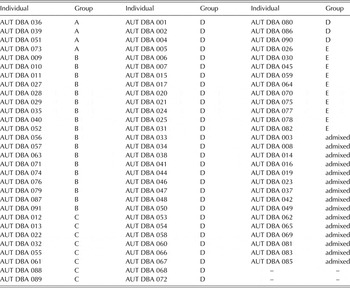
List of the AUT DBA individuals with genetic group assignment according to STRUCTURE results obtained by Raggi et al. (Reference Raggi, Ceccarelli and Negri2015)

All individuals in group A derive from Parental Population (PP) 3568 (CM67/Apro//Sv.02109/Mari). Individuals in group B are mainly related to the PP 3570 (Cerise/Lignee 1479), those in group C to 3571 (CI 08887/CI 05761//Cerise), those in group D to 3572 (Rihane-01/Trebi) and, finally, those in group E to 3573 (Rihane-01/Trebi//unknown).
Main characteristics of cultivars, landraces and promising lines crossed to produce the PP

Plant material, experimental design and data collection
The plant material for the present study included: (i) 88 of the 91 barley plants randomly extracted from the AUT DBA and characterized by Raggi et al. (Reference Raggi, Ceccarelli and Negri2015) using SSR molecular markers (only 88 were successfully grown and analysed in the present study); and (ii) five control cultivars selected among the best-performing cultivars under low-input conditions in Italy (namely Nure, Ketos, Cometa, Aliseo and Express). Each of the 88 barley plants is identified by the acronym AUT DBA followed by a progressive number.
The experimental design was a partially replicated (p-rep) row and column design in which five different genotypes (identified in Raggi et al. Reference Raggi, Ceccarelli and Negri2015) were replicated between three and seven times. Randomization was done with the software PrDigger (http://www.austatgen.org/software), which uses a user's specified blocking sequence to distribute replicated treatments in a balanced way across the design to provide an unbiased estimate of the error variance.
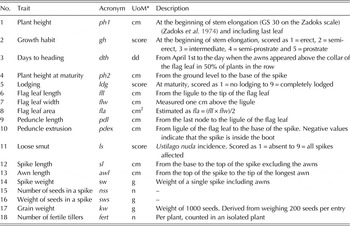
The morphological characterization was carried out at the Department experimental field under a low-input management system. Each barley plant was sown as 1-m long head-row (50 seeds) with 1-m spacing between rows. Head-rows were sown on 24 October 2012 and harvested on 29 July 2013. Eighteen morphological traits were recorded (Table 3). Plant height at maturity, length, width and area of the flag leaf, peduncle length, spike weight and the number of seeds in a spike were measured on three random plants/row, while plant height at the beginning of stem elongation, loose smut susceptibility, spike length and awn length were measured on five random plants/row. All the other traits were measured (or scored) on the entire row. The spike traits were all measured on the same spikes and, for each line, the row type (two or six) was also recorded. During the growing season, rainfall and monthly average maximum, minimum and mean temperatures (°C) were recorded. In addition, soil texture, soil total organic carbon, available phosphorus and exchangeable potassium of the experimental field were determined using standard protocols.
List and description of recorded morphological traits

* Unit of measurement.
Morphological data analysis
The selected design allowed for a bi-dimensional spatial analysis (Singh et al. Reference Singh, Ceccarelli and Grando1997, Reference Singh, Malhotra, Ceccarelli, Sarker, Grando and Erskine2003). For each trait, the Best Linear Unbiased Estimates (BLUEs) of the genotype effects were calculated using the most suitable spatial model determined for the row and column field layout following Singh et al. (Reference Singh, Malhotra, Ceccarelli, Sarker, Grando and Erskine2003). The procedure consists of gauging the spatial variability by the best of nine applicable models. These models include factorial combinations of: (i) three ways of accounting for linear trends in column direction, with or without a linear trend and random cubic smoothing spline (CS) in column number; and (ii) three structures for plot errors – first-order autoregressive (AR) errors along rows, AR errors along rows as well as AR along columns and independent errors. These models are further described in Rollins et al. (Reference Rollins, Drosse, Mulki, Grando, Baum, Singh, Ceccarelli and von Korff2013). Each model is then fitted using the plot position as indicated by the row and column number. To fit the models by setting the associated directives, i.e. the VCOMPONENTS, that declare the fixed and random components in the model, and VSTRUCTURES, that declare the error structures (e.g., first-order auto-correlated errors along rows/columns), the restricted maximum likelihood method of the GenStat software was used (Payne et al. Reference Payne, Harding, Murray, Soutar, Baird, Glaser, Welham, Gilmour, Thompson and Webster2011).
The Akaike information criterion (AICD), produced by GenStat, was used to compare models with the same fixed effect terms and to select the best model (Singh et al. Reference Singh, Malhotra, Ceccarelli, Sarker, Grando and Erskine2003). The AICD is expressed as deviance, i.e. AICD = deviance + twice the number of linear and nonlinear variance components of the models. The best model out of the nine models was finally used for estimating the experimental variances and the genetic parameters. Means of the genotypes were estimated as BLUEs by fitting the model with genotype effects assumed as fixed. The variance components were used to estimate broad-sense heritability (h 2) of each trait, along with its standard error, on a plot basis as:
 $${h^2} = \displaystyle{{\sigma _g^2} \over {\sigma _P^2}} \times 100$$
where
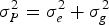 $\sigma _P^2 = \sigma _e^2 + \sigma _g^2 \; $
(phenotypic variance),
 $\sigma _g^2 = $
genotypic variance and
 $\sigma _e^2 \; = {\rm error \;variance}$
.
An approximate test of significance for the estimate of broad sense heritability was obtained by dividing the estimate by its standard error: the ratio was compared with the z-value for one-sided test, since heritability cannot be negative.
For each trait, several simple univariates were used for a description of the variability existing in the CCP and in comparison with the controls. Normality was tested using the Shapiro–Wilk test; Spearman's rank correlation coefficients between the recorded traits and significance were also calculated. Since only plant height at the beginning of stem elongation (growth stage 30 on the Zadoks scale; Zadoks et al. Reference Zadoks, Chang and Konzak1974), plant height at maturity and flag leaf width were normally distributed in the CCP (P ⩽ 0·05), non-parametric tests were performed to compare medians of different classes. In addition, due to the relevant morphological differences between two-row and six-row plants, correlations were calculated separately for the two different row types.
In order to find hypothetical variables accounting for as much as possible of the variance in the multivariate dataset, a principal component analysis (PCA) was carried out on recorded morphological traits after normalization. The PCA results were graphically summarized in a scatterplot where two-row, six-row individuals and controls are represented with different symbols. A biplot (Gabriel Reference Gabriel1971) projection of the original axes (variables) was also included in the scatterplot. In the biplot, angles between vectors are proportional to the correlations between the variables, angles between 90° and 270° indicate the negative correlation. All the above-described analyses were performed using Past software version 3 (Hammer et al. Reference Hammer, Harper and Ryan2001).
To better identify clusters of morphologically similar individuals in the CCP, a hierarchical cluster analysis was also performed based on Manhattan distances using the Ward method in the ‘hclust’ package in R version 2.15.1 software (R Development Core Team 2013). Before calculating distances, all the traits were standardized by subtracting the mean value and dividing by the standard deviation to remove scale effects. Aiming at identifying traits underlying the arrangement of the clusters obtained in the analysis, differences among medians of the morphological clusters were tested using the non-parametric Kruskal–Wallis method. The Mann–Whitney test (P ⩽ 0·05) was used to test the significance of each pairwise cluster comparison. Finally, for each morphological cluster, medians of all the recorded traits were calculated and are represented by histograms as percentages of the highest value.
Relationships between STRUCTURE results and morphological data
According to the highest ancestry proportion assigned by STRUCTURE (Raggi et al. Reference Raggi, Ceccarelli and Negri2015), each AUT DBA individual was assigned to one of the six genetic groups identified (Table 1). The Pearson χ2 test was performed to test the null hypothesis that genetic groups are equally numerous (i.e. no statistically significant differences exist among the number of individuals in each group). Obviously, admixed individuals were not included in this analysis. In addition, frequency distributions for categorical data relative to morphological traits were obtained and a contingency analysis was performed to test the null hypothesis that phenotypes are independent of STRUCTURE assignment. Significance was assessed by the Pearson χ2 test. Qualitative traits that showed significant departure from homogeneity were used for further analyses.
Aiming to find a linear combination of the original variables that maximize the ratio of between/within genetic group variation, a canonical variates analysis (CVA) was performed. Inter-group-mean Mahalanobis distances were calculated. Mean scores, unit scores and 95% confidence regions around the means (Krzanowski Reference Krzanowski1988) were graphically summarized in a scatterplot. Dimensions 1 and 2 were plotted on the x- and y-axes, respectively. A biplot representation was also produced using the ‘predictive’ axes function in GenStat. Differences among medians of the genetic groups were tested for statistical significance using the non-parametric Kruskal–Wallis method. The Mann–Whitney test was used to test the significance of each pairwise cluster comparison.
RESULTS
Agronomic management and climatic characteristics
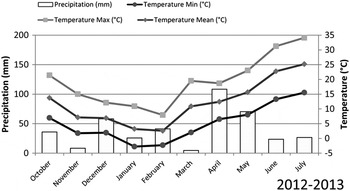
Proportions of clay, silt and sand in the experimental field soil were 0·28, 0·50 and 0·22 by volume, respectively. The sand fraction was 0·32 coarse and 0·68 fine particles. The content of organic matter was low (13·1 g/kg); available phosphorus was high and exchangeable potassium was average. Soil pH was slightly basic (pH = 7·8). The nitrogen application as well as the crop rotation was the same as used during the AUT DBA multiplication and no phosphorus or potassium was applied, as in standard cultivation practices. No herbicides or pesticides were applied. Regarding both temperature and precipitation, climatic conditions were average (Fig. 1).
Monthly precipitation and mean minimum, maximum and average temperature (°C) during the barley growing season 2012/13.

Morphological characterization
Plant height at the beginning of stem elongation (GS 30 on the Zadoks scale) (Zadoks et al. Reference Zadoks, Chang and Konzak1974) and at maturity ranged from 21·0 to 43·9 cm, and from 67·0 to 103·7 cm, respectively (mean ± s.e. = 32·7 ± 0·55 and 84·9 ± 0·93 cm, respectively). Flag leaf length and width ranged from 9·3 to 25·0 cm and from 0·4 to 1·3 cm, respectively (14·8 ± 0·27 and 0·9 ± 0·02 cm, respectively), while peduncle length and extrusion ranged from 14·3 to 22·4 cm and from –1·4 to 18·7 cm, respectively (20·1 ± 0·15 and 9·7 ± 0·46 cm, respectively). Days-to-heading ranged from 16 to 39 days (23·6 ± 0·52 days). Spike length and awn length ranged from 4·1 to 12·6 cm and from 4·1 to 14·7 cm, respectively (7·5 ± 0·26 and 8·8 ± 0·23, respectively). The number of seeds in a spike ranged from 18 to 77 (44·1 ± 4·70 seeds). Spike weight and weight of seeds in a spike ranged from 1·2 to 3·8 g (2·3 ± 0·24 g) and from 0·9 to 3·6 g (2·0 ± 0·22 g), respectively and grain weight from 33·7 to 67·6 g (47·4 ± 0·74 g). Fertile tillers per plant ranged from 4 to 75 (25·7 ± 1·63 fertile tillers). Most of the CCP individuals had an erect growth habit (class 1 proportion = 0·66), were characterized by very low lodging (class 1 proportion = 0·93) as well as very low loose smut susceptibility (class 1 proportion = 0·92).
In the AUT DBA, the six-row type was predominant with 66 individuals being six-row and 22 two-row. On average, two-row and six-row types differed widely for spike morphology related traits like spike weight (mean ± s.e. = 1·7 ± 0·05 and 2·5 ± 0·07, respectively), weight of seeds in a spike (1·4 ± 0·04 and 2·2 ± 0·07, respectively), and number of seeds per spike (26·2 ± 0·56 and 50·1 ± 1·39, respectively). Several CCP individuals were superior to the best controls for at least one of the four yield-related traits, namely spike weight, number of seeds per spike, weight of seeds in a spike and grain weight. A proportion of 0·60 of the CCP individuals had spike weights higher than the best control (Ketos with 2·2 g), 0·50 had higher numbers of seeds per spike than the best control (Express with 45·7 seeds) and 0·56 had higher weights of seeds in a spike value than the best control (Express with 1·9 g), whereas only a proportion of 0·07 had higher grain weight than the best control (Nure with 58·9 g). Finally, nearly half (0·48) of the AUT DBA individuals were better than the best control for three of the four traits (spike weight, number of seeds per spike and weight of seeds per spike).
Morphological data analysis
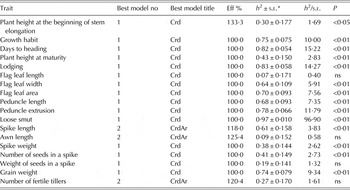
The spatial analysis was more efficient than the completely randomized design only in the case of four variables, namely plant height at the beginning of stem elongation, spike length, awn length and number of fertile tillers. In these cases, the superior efficiency of the spatial models was between 18 and 33% (Table 4). This is not surprising since the trial was performed in an experimental field where spatial variation is generally low. The estimates of heritability were generally high (Table 4); however, they were not significantly different from 0 in the case of flag leaf length, awn length, seed weight of one spike and the number of fertile tillers. In all the other cases the estimate of heritability was significantly different from 0 (P < 0·01); in the case of plant height at the beginning of stem elongation, the heritability was significantly different from 0 (P < 0·05).
Spatial models used for the estimation of BLUEs, efficiency of the spatial model over the Crd (completely randomized design), broad sense heritability and its standard error (h2 ± s.e.), ratio between broad sense heritability and its standard error and, significance level of h2

ns, not significant.
*Based on the one-sided z-test as heritability cannot be negative.
Correlation coefficients between morphological traits are reported in Table S1 (Supplementary Materials available from: http://journals.cambridge.org/AGS). In both two-row and six-row individuals, several expected correlations were observed, particularly among spike traits (i.e. spike weight with number of seeds in a spike). In addition, an interesting positive correlation between plant height at maturity and peduncle extrusion and a strong negative correlation between early plant height and days to heading were detected (P ⩽ 0·01). Finally, plant height at maturity was correlated with lodging only to a limited extent (0·29).
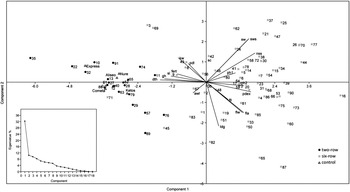
In the PCA, the first six principal components (having eigenvalues > 1) explained 74·3% of the total variation and the first two components 43·4% (Fig. 2, scree plot). Component 1, explaining 33·5%, was mainly linked (r > |0·7|) to traits related to spike characteristics. It was positively correlated with number and weight of seeds in a spike, spike weight and peduncle extrusion, and negatively correlated with days to heading. Component 2, explaining 9·9%, showed a positive correlation with spike weight and weight of seeds in a spike and a negative correlation with lodging (r > |0·5|). Finally the third PC, explaining 9·1% of the total variation, was positively correlated with flag leaf length (r > |0·5|).
Principal component analysis of AUT DBA morphological diversity. Individuals are represented according to the following code: ● (two-row), ■ (six-row) and Δ (controls). A scree plot of the percentage of variation explained by each component is also reported.

Two principal morphological groups in the AUT DBA were able to be distinguished in the PCA scatterplot (Fig. 2). The first group, characterized by a negative value of Component 1 (Fig. 2, left hand side), comprised all five control varieties and 34 individuals from the CCP (all the 22 two-row and 12 of the 66 six-row individuals). According to the projection of the original variables in the scatterplot, individuals in this group mainly have a semi-erect/intermediate growth habit and are characterized by high fertility, long peduncle and high grain weight, late ear emergence, long spikes with long awns. On the right side of Fig. 2, the second group comprised 46 individuals (all six-row) which have tall straw, highly extruded peduncles and, in particular, heavy spikes with high grain number. In addition, they are generally erect, early flowering and with a low number of fertile tillers. Interestingly, regardless of spike type, all the best varieties tested in the present study as controls showed a different plant architecture compared with the individuals most frequent in the CCP (Fig. 2).
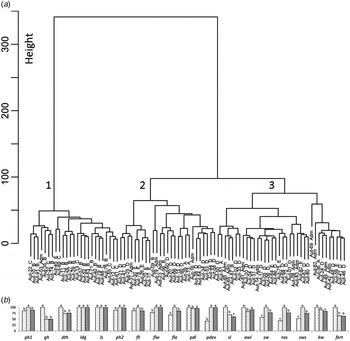
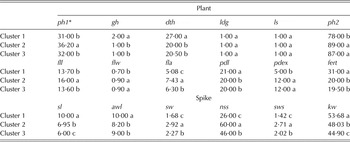
Traits recorded on AUT DBA individuals were also used to perform a cluster analysis where three main morphological clusters were detected (Fig. 3(a)). According to the cluster height, the distance from cluster 1 to clusters 2 and 3 is great, whereas the separation between 2 and 3 is less evident. Morphological cluster 1 included 25 individuals (all the two-row plus AUT DBA 03, 045 and 071 six-row plants), morphological cluster 2 included 27 individuals (all six-row) and morphological cluster 3 included 36 individuals (all six-row). It is noteworthy that AUT DBA 03 is a late-flowering plant with a high number of fertile tillers, AUT DBA 071 is also late-flowering with an intermediate growth habit and, finally, AUT DBA 045 is characterized by a long, thin spike. Medians of all the 18 studied traits, represented by histograms as proportions of the highest values in Fig. 3(b), were statistically different in the comparison between morphological clusters 1 v. 2 and 3 with the exceptions of lodging and loose smut, which were almost absent in the whole CCP (Table 5).
(a) Dendrogram of dissimilarity of the AUT DBA individuals based on 18 morphological traits with main morphological clusters (numbered 1–3). Here individuals are named ‘Aut-’ followed by individual number and genetic group. (b) Bar plots of the median values of each cluster (plotted as percentage of the highest value) are reported for each trait. Values with different letters are significantly different according to the Mann–Whitney test (P ⩽ 0·05). ph1, plant height at the beginning of stem elongation; gh, growth habit; dth, days to heading; ldg, lodging; ls, loose smut incidence; ph2, plant height at maturity; fll, flag leaf length; flw, flag leaf width; fla, flag leaf area; pdl, peduncle length; pdex, peduncle extrusion; sl, spike length; awl, awn length; sw, spike weight; nss, number of seeds in a spike; sws, weight of seeds in a spike; kw, 1000 seed weight; fert, number of fertile tillers.

Medians of the traits of different morphological clusters identified using the Ward method

Values with different letters are significantly different at P ⩽ 0·05. Traits related to the plant and spike characteristics are presented separately.
* See Table 3 for the explanation of acronyms.
Relationships between STRUCTURE results and morphological data
According to STRUCTURE results (Table 1), the 88 individuals of the AUT DBA belong to five genetic groups (plus admixed) that differ for the number of plants (χ2 = 34·6, d.f. = 4, P ⩽ 0·001). Group D is the largest, including 33 individuals, followed by group B with 18, group E with ten, group C with eight and group A with four individuals. Genetic groups D, B, E and C are mainly related to PP 3572, 3570, 3573 and 3571, respectively, while group A is entirely related to PP 3568. Main characteristics of cultivars, landraces and promising lines crossed to produce the PP are reported in Table 2. All the plants in genetic groups A, D and E are six-row, while the majority of those in B and C are two-row (22 out of 26). Among the three qualitative traits studied, only growth habit was distributed differently among the genetic groups (χ2 = 45·1, d.f. = 10, P ⩽ 0·001). Plants with erect growth habit were prevalent in A, D and E. Finally, it is noteworthy that all the 15 individuals in admixed group were six-row, even those with the genome built up with large segments of genomes from two-row individuals (AUT DBA 03, 016, 019, 023, 042, 049, 065 and 085).
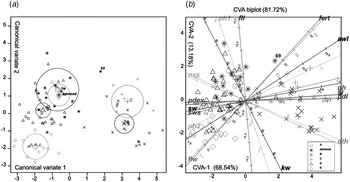
The CVA results, based on assignment of the genetic groups, showed that 68·5% of the between-group variation is in the direction of the first and 13·2% in the direction of the second axis (Fig. 4(a)). The analysis classified the individuals into two major sets, separating those belonging to A, D and E and the admixed genetic groups from those belonging to B and C (Fig. 4(a)). The greatest distance was between C and E (5·869), while the lowest was between A and admixed (0·321). Low distances were also detected among genetic groups B and C and D and admixed (1·286 and 1·266, respectively). The position of admixed individuals in the projection shows a close morphological similarity with the A and D genetic groups. An exception is represented by AUT DBA 069 characterized by a high value of growth habit, spike and peduncle length and low values of peduncle extrusion, spike weight and weight of seeds in a spike (Fig. 4(a)).
Canonical variates analysis of AUT DBA morphological diversity. Individuals belonging to the different genetic groups are represented according to the following code: □ (A), × (B), + (C), Δ (D), ◇ (E) and  (admixed). (a) 95% confidence ellipses around the means, represented by the same above-mentioned symbols in a bigger shape, are reported. (b) Variates name and range.

The biplot representation shows that the most important traits that distinguish the two major sets are peduncle extrusion, spike weight, weight of seeds in a spike, plant height at maturity, number of seeds in a spike, with high values in A, D, E and admixed, and growth habit, spike length and peduncle length with high values in B and C. Accordingly, the axes representing these traits are parallel to CVA-1 (Fig. 4(b)). Differences between groups in the same set are mainly due to plant height at the beginning of stem elongation, flag leaf length, grain weight and number of fertile culms that are parallels to CVA-2.
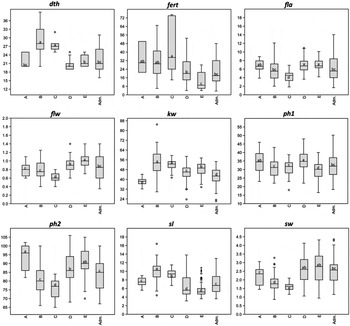
The comparison of morphological characteristics among the more similar genetic groups (i.e., B and C and A, D, E and admixed) revealed that plants in group B have higher median values than those in group C for flag leaf related traits: flag leaf area and width and traits related to spike morphology: spike length and spike weight (P ⩽ 0·01). Plants in group B were also taller at maturity than those in group C (P ⩽ 0·05) (Fig. 5). Compared with plants of group E, individuals in group D (the most numerous group) were taller at the beginning of stem elongation (P ⩽ 0·001), flowered generally earlier and produced a higher number of fertile tillers (P ⩽ 0·05). In addition, they surpassed those in group A for some relevant spike traits such as spike weight (P ⩽ 0·05) and grain weight (P ⩽ 0·001) (Fig. 5). On the opposite side, individuals in group E had higher grain weight and were characterized by wider flag leaf (P ⩽ 0·01) than those in group D and individuals in group A by higher plant height at maturity (P ⩽ 0·05) (Fig. 5).
Box plot of the most relevant traits distinguishing AUT DBA individuals belonging to different genetic groups. In the representation, genetic groups with different lowercase letters are different according to the Mann–Whitney test (P ⩽ 0·05). The ‘whiskers’ are drawn from the top of the box up to the largest data point less than 1·5 times the box height from the box (the ‘upper inner fence’), and similarly below the box. Values outside the inner fences are shown as circles. ‘Adm.’ is the abbreviation of admixed.

DISCUSSION
Due to a renewed interest in the use heterogeneous populations in organic agriculture, both for breeding material or as production crops (Phillips & Wolfe Reference Phillips and Wolfe2005; Wolfe et al. Reference Wolfe, Baresel, Desclaux, Goldringer, Hoad, Kovacs, Löschenberger, Miedaner, Østergård and Lammerts van Bueren2008; Lammerts van Bueren et al. Reference Lammerts van Bueren, Jones, Tamm, Murphy, Myers, Leifert and Messmer2011), the evolution of diversity in these populations is a particularly relevant research topic. It has been reported that ‘selection for competitive ability’ can produce dramatic changes in the composition of heterogeneous populations even in a time-frame much shorter than that considered in the present study (Harlan & Martini Reference Harlan and Martini1938; Blijenburg & Sneep Reference Blijenburg and Sneep1975). Therefore, confidence is high that after 13 years of multiplication without any conscious human selection, the proportion of individuals with different morphological characteristics (that are related to both row type and the origin of different genetic groups) is strongly connected to their competitive ability in the multiplication environment. However, it should be recognized that some changes in the CCP may also be due to random effects and some ‘non-adapted’ lines could have remained in the population. Since >30 000 individuals were multiplied each year, changes due to drift should have been considerably reduced.
In the barley CCP used in the present study, the six-row individuals were predominant, forming a high proportion of the total (0·75), and this could be the result of their superior performance and competitive ability. The hypothesis of the existence of a selective advantage for six-row plants in the AUT DBA is also supported by the observation of the spike morphology of admixed individuals that are all six-row. In fact, in the absence of a selective advantage for the six-row condition, admixed individuals obtained by crossing two-row with six-row parents, after several generations of selfing, should be both two-row and six-row. In addition, since in barley the six-row condition is determined by a recessive mutation of the Vrs1 locus (Komatsuda et al. Reference Komatsuda, Pourkheirandish, He, Azhaguvel, Kanamori, Perovic, Stein, Graner, Wicker, Tagiri, Lundqvist, Fujimura, Matsuoka, Matsumoto and Yano2007), the two-row phenotype should be found in all the heterozygous individuals. Indeed, all the 15 CCP admixed individuals were six-row, even the eight with the genome built up with large segments of two-row plant genomes (Raggi et al. Reference Raggi, Ceccarelli and Negri2015).
In order to identify groups of morphologically similar individuals, both bi-dimensional spatial analysis and cluster analysis were carried out. The PCA and cluster analysis results were highly comparable even if the latter allowed three morphological clusters instead of two to be identified. In fact, individuals in morphological clusters 2 and 3 were quite similar and mainly corresponded to those with a positive value of component 1 in the PCA scatterplot. Together, clusters 2 and 3 grouped the largest part of AUT DBA individuals which, compared with those in cluster 1, were mainly characterized by heavier spikes with higher seed number, taller culms and early flowering.
These observations suggest a relevant role of seed number in comparison with seed size in determining the competitive success in this heterogeneous population, although it has been suggested that seed size (higher in morphological cluster 1) can positively influence the competitive ability of a variety determining high vigour at the earliest plant developmental stage (Sandfær Reference Sandfær1970). However, no significant correlation was found between plant height at the beginning of stem elongation and 1000 seed weight. A negative correlation between number of seeds per spike and grain weight was also found in the present study. A shift towards small grain size during the evolution of a barley CCP under natural selection was also reported by Mak & Harvey (Reference Mak and Harvey1982).
Regarding plant height, individuals in morphological clusters 2 and 3 were taller than those in cluster 1 (at both maturity and the beginning of stem elongation); they were also characterized by greater peduncle extrusion. Carrying out an analysis of SSR loci under selection in the same population, Raggi et al. (Reference Raggi, Ceccarelli and Negri2015) identified traces of selection for two markers that have been reported as co-localized with important QTLs for peduncle extrusion and plant height (Rollins et al. Reference Rollins, Drosse, Mulki, Grando, Baum, Singh, Ceccarelli and von Korff2013). This is an additional indication that selection in favour of tall plants and peduncle extrusion occurred during the CCP evolution. Plant height has already been recognized as one of the most relevant traits in determining the success of an individual in heterogeneous populations since it plays a relevant role in the competition for light and nutrients between plants of various heights and stages of vegetative development in wheat and barley (Mak & Harvey Reference Mak and Harvey1982; Patel et al. Reference Patel, Reinbergs, Mather, Choo and Sterling1987; Hensleigh et al. Reference Hensleigh, Blake and Welty1992; Raquin et al. Reference Raquin, Brabant, Rhoné, Balfourier, Leroy and Goldringer2008). On the contrary, Denison et al. (Reference Denison, Kiers and West2003) considered the effect of natural selection on plant height as evidence that selection for competitive ability does not necessarily favour traits associated with higher yields per unit area and hence evolutionary plant breeding cannot be a substitute for conventional plant breeding. However, it is noteworthy that in the population studied there was only a low correlation between plant height at maturity and lodging and that the most numerous morphological clusters were characterized by high culm length showing the usefulness of this trait under low-input and organic conditions. Indeed low-input systems may require a plant architecture different from that which is considered ideal for high input (Lammerts van Bueren et al. Reference Lammerts van Bueren, Struik and Jacobsen2002 and references therein). The morphological grouping of control varieties, in comparison with AUT DBA individuals, further supports these indications.
Using the information from the molecular analysis performed by Raggi et al. (Reference Raggi, Ceccarelli and Negri2015) on the same individuals characterized in the present study, phenotypic data were also analysed according to the STRUCTURE group assignment of each CCP individual. This approach allowed a better understanding of the traits that potentially determined the success of a particular genetic group of individuals in the AUT DBA. The comparison between genetic groups D and E is of particular interest since the two groups represent a relevant proportion of the total individuals (0·49). In addition, group D is the largest including more than one third of all individuals (0·38). According to Mann–Whitney test results, only four traits differed significantly between D and E genetic groups, namely plant height at the beginning of stem elongation, days to heading, flag leaf width and number of fertile tillers. Therefore, early competitive ability could have played a significant role in determining the success of plants from group D (which have higher plant height at the beginning of stem elongation and number of fertile tillers) over group E.
Early & Qualset (Reference Early and Qualset1971) suggested that, in barley mixtures, competition at the time of tillering had an important role in determining yield and consequently line survival. In a comprehensive study on mechanisms of competition among rice genotypes, Jennings & Aquino (Reference Jennings and Aquino1968) recognized a great value of leaf and stem for competitive ability in early vegetative development. In the same study, an important role in increasing competitive ability was also attributed to tiller number which, with other traits (i.e. leaf number, plant height and plant dry weight) was postulated to determine early plant vigour.
The competitive ability of leaf and culm dimension is still a matter of debate since it is difficult to define their relative contribution to a complex trait such as competitive ability. In general, however, longer leaves could be a relevant trait of a strong competitor (Jennings & Aquino Reference Jennings and Aquino1968). In the present study, width, length and area of flag leaf were considered. Flag leaf width was strongly and positively associated with two yield-related traits, namely spike length and spike weight in two-row plants, and with flag leaf length and with number of seeds per spike in six-row plants, respectively, suggesting that these traits positively contribute to high seed yield. In a seed-propagated species like barley, the highest yielding genotypes are often the fittest genotypes: fitness largely depends on the number of seeds produced per plant which, in turn, is a component of yield. Flag leaf width and area clearly differentiate plants belonging to group B from those belonging to group C; the two traits could therefore contribute to determining the higher competitiveness of the former group, numerically more represented in the CCP.
Finally, the current data suggest that earliness could have been an advantage in the environment where the population was multiplied since, in the AUT DBA, the most numerous genetic group of individuals is the earliest according to flowering time. In addition, in this heterogeneous population, all the admixed individuals are early flowering. As suggested by Nevo et al. (Reference Nevo, Fu, Pavlicek, Khalifa, Tavasi and Beiles2012), the observed shift towards earliness could be due to the progressive increase in temperature of this period. However, climatic variation among years allowed diversity in flowering time to be maintained, which could be extremely beneficial in responding to climatic unpredictability and drought stress characterizing the present day climate (see the Discussion in Raggi et al. Reference Raggi, Ceccarelli and Negri2015).
CONCLUSIONS
The barley population described in the present study was produced with the specific aim of increasing agronomic performances under low-input conditions and of maintaining sufficient genetic diversity to allow continuing evolution (V. Negri, personal communication, 2010). In fact, AUT DBA PP were specifically selected for low-input and organic farming on the basis of their agronomic performances (Negri & Petti Reference Negri, Petti, Santucci and Zanoli1995). Since a wide range of morphological diversity was observed, which reflects the diversity of parental lines (Raggi et al. Reference Raggi, Ceccarelli and Negri2015), AUT DBA can be useful as a gene-pool for selecting lines. The high heritability calculated for the studied traits and the high percentage of lines that show favourable combinations of different traits confirm its value for breeding activities. Accordingly, both two-row and six-row lines have already been extracted from AUT DBA, whose agronomic performances are comparable to the best varieties available on the market (L. Raggi, personal communication, 2015).
Further use of the AUT DBA for breeding purposes could be limited by its possible evolution towards complete composition of six-row, tall and low seed weight plants. However, in order to counteract undesirable changes, easy practices addressing CCP evolution can be applied without great economic and/or technical efforts (i.e. removing the tallest plants, sieving seeds or harvesting seeds for the next harvest only from two-row or six-row plants). These practices can easily be performed also by farmers interested in cultivating evolutionary populations. Finally, regarding the weight of 1000 seeds, medians calculated for morphological cluster with lower values were similar to six-row controls; hence a detrimental effect on population agronomic potential due to reduction of the seeds weight seems unlikely.
The fact that a number of evolutionary responses were observed in this CCP shows that the prediction that phenotypic microevolution in natural systems may be limited by low genetic variances in harsh environments and low selection pressure in good environments (Wilson et al. Reference Wilson, Pemberton, Pilkington, Coltman, Mifsud, Clutton-Brock and Kruuk2006) is not necessarily true for this type of low-input system. Here, it is likely that the intensity of stress was not high enough to reduce genetic variance, as indicated by the sizable amount of heritability for most of the traits and the high number of multi-locus genotypes (Raggi et al. Reference Raggi, Ceccarelli and Negri2015). In addition, evolution was indeed observed. Also, the prediction that natural selection increases the frequency of genotypes that are not necessarily those that maximize yield per unit area (Denison et al. Reference Denison, Kiers and West2003) does not necessarily apply to low-input agricultural systems where tall plants are advantaged and are favoured by natural selection. Finally, the positive effects reported here of natural selection on traits related to early crop vigour suggests a particular relevance of evolutionary plant breeding in the selection of varieties for organic and/or low-input agriculture.
The research leading to these results received funding from the European Community's Seventh Framework Programme (FP7/2007–2013) under grant agreement no. 245058 SOLIBAM. The authors are grateful to the two referees for their suggestions for improving the presentation of this paper. The English editing has been done by Sister Nancy Ann Hutchinson.
SUPPLEMENTARY MATERIAL
The supplementary material for this paper can be found at http://www.journals.cambridge.org/AGS