In this article, we examine the financial crisis of 2008, consider how it was propagated from country to country and compare it with the crisis of 1931. We choose these two particular crises because they were both global in scope, they both affected the world's principal financial centres and the crisis of 1931 had catastrophic consequences. In section I we describe the international flows of funds in the two crises. In Sections II to V we analyse several channels through which the recent crisis was propagated internationally – namely, the flight to safety and liquidity, the collateral squeeze, central bank reserve management and the unwinding of carry trades – and examine, in each case, the parallel with 1931. Section VI compares the international transmission channels in the two crises.
I
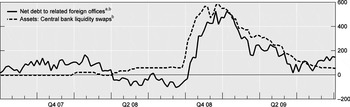
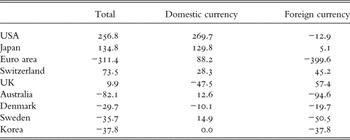
The recent financial crisis began in 2007 but became acute when Lehman Brothers filed for bankruptcy on 15 September 2008. This event falsified the prevailing assumption that no systemically important financial institution would be allowed to fail, and shocked US financial markets severely; it was followed by very heavy international flows of funds, which this section describes. In Section II, we analyse the very large domestic-currency-denominated flows to the United States and Japan (see Table 1, which shows flows through commercial banks in the second half of 2008). The inflow of funds to the United States was concentrated in the period after Lehman Brothers failed (Figure 1).
US commercial banks' net debt to related foreign offices and Fed swaps outstanding (in US$ billion)
aAll commercial banks; not seasonally adjusted. bWednesday level.
Sources: Federal Reserve tables H8 and H4.1.

Exchange-rate adjusted changes in commercial banks' net external liabilities in the second half of 2008 (US$ billion)

Source: BIS international banking statistics, table 2.
Note: countries are included in this table if the total net external liabilities of banks located in that country changed by more than $30 billion in 2008Q4.
The large flows of dollars to the United States created shortages elsewhere, and caused severe stresses in foreign financial markets. It became impossible for commercial banks located outside the United States that had been financing longer-term US dollar-denominated assets with shorter-term wholesale funding to renew their funding from commercial sources. The shortages were largely relieved by swap lines provided by the Fed, but some of the financial market stresses persisted (see Allen and Moessner Reference Allen and Moessner2010). The withdrawal of external funding from commercial banks outside the United States caused their domestic lending to contract (Aiyar Reference Aiyar2011). The provision of dollar funds through Fed swap lines to foreign central banks was closely correlated with the inflow of funds to the United States through banks located in the United States (Figure 1).
During the spring and summer of 1931, following the collapse in May of Creditanstalt, the largest bank in Austria, there was an epidemic of severe banking or exchange rate crises in Europe, and some European countries suffered heavy outflows of gold from their reserves while trying vainly to support their banking systems.Footnote 2 It is now conventional wisdom that the disastrous events of 1931 were crucial in turning the recession following the stock market crash of 1929 into the Great Depression of the 1930s.Footnote 3
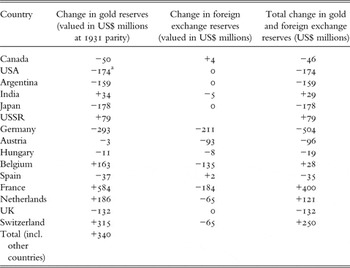
The turmoil in financial markets led to large international flows of funds. Total gold reserves actually rose somewhat in 1931, but they were redistributed among countries and some countries lost large amounts of gold (Table 2). The redistribution was the natural consequence under the gold standard of international flows of funds, which in the turbulent conditions were dominated by financial flows rather than current account flows.
Changes in gold and foreign exchange reserves in 1931

Note: Countries which experienced a change of $30 million or more in their gold reserves are included in the table, along with certain countries which experienced banking crises.
aIncludes holdings of US Treasury as well as Federal Reserve.
Source: League of Nations Statistical Yearbook 1936–7, available at www.library.northwestern.edu/govinfo/collections/league/
The central banks of the Netherlands, Switzerland and above all France experienced heavy inflows of funds during 1931, amounting in all to $771 million (increase in gold reserves net of reduction in foreign exchange reserves).Footnote 4 There were heavy outflows from Germany, Austria and Hungary, where there were banking crises, and from the UK, where a banking crisis was avoided, but probably only because the country left the gold standard (in September 1931) rather than face the prospect of continued outflows and their deflationary consequences for the economy.Footnote 5 The scale of these countries' financial problems was larger than Table 2 suggests, because they all received official loans which partly offset their gold and foreign exchange losses. The United States also lost gold, but this was entirely the result of official loans to countries in distress, which increased by $306 million during 1931 (authors' calculation).
II
The recent crisis was propagated internationally by means of a flight to liquidity and safety, a collateral squeeze and the unwinding of carry trades. This and the following sections describe how these channels operated and examine, in each case, the parallel with 1931. We start here with the flight to liquidity and safety.
A flight to liquidity and safety began in 2007 when growing doubts about the value of mortgage-backed securities caused the ‘shadow banking system’ to begin to contract. The ‘shadow banking system’ consists of financial companies which were not banks but which performed maturity transformation by holding inventories of longer-term assets financed and collateralised by shorter-term liabilities such as asset-backed commercial paper (ABCP). This definition of shadow banks therefore includes many broker-dealers and hedge funds, but it excludes most money market mutual funds, which are strictly speaking not leveraged, because investors buy shares which have no guarantee of capital value.Footnote 6 Many shadow banks had acquired back-up liquidity guarantees from commercial banks in order to make their ABCP programmes attractive to investors, so that the growing doubts about the assets of the shadow banks, as well as about the mortgage assets of commercial banks themselves, led inevitably in turn to doubts about the soundness of commercial banks.Footnote 7 The flight intensified and turned into a crisis after Lehman Brothers failed.
The flight to liquidity and safety was manifested in many ways. For example, yield differentials between eurodollar deposits and US government liabilities widened sharply after August 2007. Not all government liabilities were considered safe, however, and yield differences between the securities issued by different governments widened. At the extreme, the government of Iceland had to impose exchange controls in 2008, while the governments of Greece and Ireland sought emergency official support in 2010. Commercial banks based in Iceland and Ireland were suspected of having negative net worth of such a size as to threaten the sustainability of their governments' finances, on the assumption that the governments would guarantee the deposits and perhaps some other liabilities of the banks. This undermined the credit standing of those countries' governments (and the banks). Other governments, such as in Spain, Portugal and the United Kingdom, tightened fiscal policy out of anxiety that their credit standing would otherwise deteriorate.
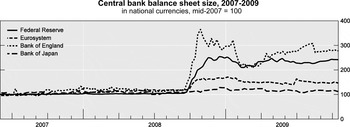
The liabilities of central banks in countries with stable public finances were also regarded as liquid and safe, and the demand for them surged. Central banks, having learned the lessons of the Great Depression, generally supplied deposits and other liabilities in large quantities, using the proceeds to acquire additional assets. In doing so they fulfilled the role of ‘lender of last resort’ in defence of financial stability. The balance sheets of some central banks, including those of the United States, the euro area and the United Kingdom, ballooned in size (Figure 2).
Central bank balance sheet size, 2007–2009 (in national currencies, mid 2007 = 100)
Sources: Datastream, national data.

We doubt whether anxiety on the part of US banks about foreign banks' solvency was the main cause of the post-Lehman inflow to the United States. It is true that the yield differentials between commercial bank and government liabilities widened still further at that time. However, as Table 6 shows, most of the increase in late 2008 in amounts due from commercial banks in the United States to their foreign offices was on account of foreign banks, not US-chartered banks; moreover, there was no reason why the failure of Lehman Brothers (and the rescue of AIG, which occurred at much the same time) should have increased US banks' unease about foreign banks.
In 1931, doubts developed about some countries' ability to sustain the gold standard, and the dominant concerns of international investors were liquidity and safety. This meant avoiding currencies which might leave the gold standard and be either devalued or subjected to standstill agreements or other administrative obstructions to scheduled payments, and avoiding exposures to commercial banks whose soundness was in doubt.Footnote 8 It is interesting to consider the counterparts to the flows of gold in the countries that were most affected by the crisis.
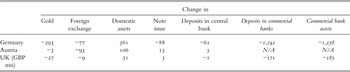
Table 3 provides such information in respect of the three main gold-losing countries, namely Germany, Austria and the United Kingdom. In Germany and Austria, the central bank's loss of gold and foreign exchange reserves was more than compensated by an increase in its domestic assets, largely if not entirely accounted for by emergency assistance provided to distressed domestic commercial banks. In the United Kingdom, the central bank's balance sheet (with the Issue and Banking Departments consolidated) contracted slightly during 1931 and the increase in domestic assets was slightly smaller than the fall in gold and foreign exchange.
Changes in central and commercial bank balance sheets in gold-losing countries in 1931 (US$ million, except where shown)

Sources: Central bank data: Board of Governors of the Federal Reserve System (1976); Commercial bank data: Deutsche Bundesbank (Reference Bundesbank1976), Sheppard (Reference Sheppard1971).
Central bank liabilities (notes and deposits) increased moderately in Austria and the UK, but they fell sharply in Germany, where the banknote circulation fell by 7.8 per cent. It can safely be assumed that central banks supplied banknotes on demand, and that the fall in the note circulation was driven by demand, not supply. Real GDP in Germany fell by 7.6 per cent in 1931,Footnote 9 and retail prices fell by 8.5 per cent,Footnote 10 and it is plausible that the fall in incomes caused the fall in demand for banknotes. However, it was less than a decade since Germany had experienced hyperinflation, and the fall in demand for banknotes might also have reflected a loss of confidence in the Reichsmark and in Germany's ability to remain on the gold standard.
France, the Netherlands and Switzerland all ran down their foreign exchange reserves in 1931, but in each case total reserves of gold and foreign exchange rose by a large amount (Table 4). In each case there were large increases in both the banknote issue and in deposits with the central bank; and the percentage increases in the banknote issues were far larger than could be explained by changes in domestic economic conditions.Footnote 11 It seems highly likely that banknotes were among the destinations of the flight to liquidity and safety. It is also quite possible that deposits in the three central banks were also flight destinations. In particular, the Banque de France dominated the French banking scene in that era; its note circulation alone was much larger than the total of commercial bank deposits; and it did a great deal of what would now be regarded as commercial banking.Footnote 12
Changes in central and commercial bank balance sheets in gold-receiving countries in 1931 (US$ million)

Sources: France: Federal Reserve Board, Banking and Monetary Statistics 1914–1941; Netherlands: Nederlandse financiële instellingen in de twintigste eeuw: Balansreeksen en naamlijst van handelsbanken. De Nederlandsche Bank Statistische Cahiers no. 3, 2000; Switzerland: Swiss National Bank www.snb.ch/en/iabout/stat/statpub/histz/id/statpub_histz_actual.
III
The heavy inflow of funds to the United States after Lehman Brothers failed was partly a side-effect of a collateral squeeze which took place in the United States at that time. A collateral squeeze affects companies such as shadow banks which use their assets as collateral for their borrowings. The mechanics of a collateral squeeze are described in detail by Adrian and Shin (Reference Adrian and Shin2009 and Reference Adrian and Shin2010) and Allen and Moessner (Reference Allen and Moessner2011). In this section, we illustrate the effects of the collateral squeeze by reference to the experiences of a large broker-dealer, Morgan Stanley, and explain how the squeeze affected commercial bank balance sheets and sucked dollar funds into the United States from other countries.
The realisation that Lehman Brothers had been allowed to fail suddenly undermined the credibility of other broker-dealers, of which Goldman Sachs, Merrill Lynch and Morgan Stanley were by far the largest.Footnote 13 Not only did lenders of money require them to pledge much larger margins of surplus collateral, but their market trading counterparties, mainly hedge funds to which the broker-dealers provided prime brokerage services, became much less tolerant of unsecured exposures to them. These developments put immense pressure on broker-dealers to find new sources of capital and unsecured liabilities.
Gorton and Metrick (Reference Gorton and Metrick2009) provide data obtained from dealers showing how ‘haircuts’, i.e. margins of surplus collateral demanded from borrowers of cash under bilateral repurchase agreements, increased very sharply, especially after Lehman Brothers failed.Footnote 14 Copeland, Martin and Walker (Reference Copeland, Martin and Walker2010) report that in the tri-party repo market, haircuts did not increase much, and suggest reasons for the difference in behaviour between the bilateral and tri-party markets. They also suggest that some of the lenders in the bilateral repo market were prime brokers lending cash to their hedge fund clients, who may have had no other source of funds. Some of the prime brokers will have been broker-dealers who were themselves under liquidity pressure, and they may have demanded more collateral from their clients in order to ease their own liquidity situations. And the FCIC (2011, p. 361) say that, after Lehman Brothers failed, the two clearing banks in the tri-party market became concerned about their intra-day exposures to broker-dealers and demanded more collateral.
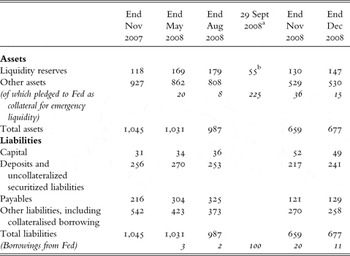
An impression of the nature and scale of the resulting collateral squeeze on broker-dealers is provided in Table 5, which shows a condensed version of Morgan Stanley's balance sheet, as at its 10-K and 10-Q reporting dates. Between September and November 2008 Morgan Stanley experienced a massive withdrawal of unsecured funding. The main element was an outflow of $203 billion on account of ‘payables', which we surmise included reductions in collateral provided by trading counterparties to Morgan Stanley, and notably by the hedge funds to which Morgan Stanley provided prime brokerage services.Footnote 15 Prime brokerage clients also exercised their contractual rights to borrow from Morgan Stanley. The FCIC reports that cash and securities withdrawn from non-bank prime brokers were transferred to prime brokers which were in bank holding companies, and to custodian banks (see FCIC, p. 360).
Condensed balance sheet of Morgan Stanley, 2008 (US$ billion)

Sources: 10-K and 10-Q reports, information released by Federal Reserve about use of credit and liquidity facilities (see www.federalreserve.gov/newsevents/reform_transaction.htm).
Notes: aDate of peak usage of Fed facilities; see text for more details. bEnd of September.
Source: FCIC (2011, p. 363).
Morgan Stanley's total unsecured funding fell by $239 billion in September–November 2008. The company drew down $49 billion of liquid assets, so that its liquid assets met about a fifth of the loss of unsecured funding. The company reduced its other assets by $279 billion, or 35 per cent, in the three months, so that its total assets decreased by $328 billion.Footnote 16 It also raised new capital from investors. The company used its liquid assets to buy time, while making large reductions in total assets. The reduction in total assets in September–November was about one and a half times the reduction in capital and unsecured borrowing. Morgan Stanley had surplus collateral at the beginning of the crisis, in addition to its liquidity reserve, which it was able to deploy with the help of the emergency liquidity facilities provided by the Fed, in order to soften the immediate impact of the outflows of funds on its balance sheet.Footnote 17
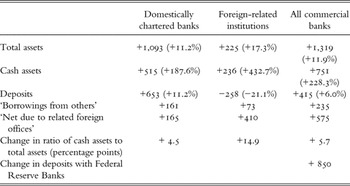
Between 3 September and 31 December 2008, the net debt of commercial banks located in the United States to their foreign offices increased by $575 billion, of which $410 billion was accounted for by foreign-related banks. This suggests that the flow of dollars to the United States reported in Table 1 was largely or entirely concentrated in flows to banks located in the United States from their foreign affiliates (Cetorelli and Goldberg Reference Cetorelli and Goldberg2009). Table 6 shows how the commercial banks' balance sheets changed over the same period.
US commercial banks: changes in selected balance sheet items from 3 September 2008 to end December 2008 (US$ billion)

Source: Federal Reserve tables H8, H4.1.
The increase in bank assets, other than cash, is not hard to explain. Commercial banks had provided liquidity guarantees to issuers of commercial paper, including shadow banks issuing asset-backed commercial paper, and as the ABCP market dried up, the guarantees were called. The increase arising from this source appears to have outweighed the decrease that will have arisen from debt repayments by shadow banks which had sold assets as a necessary reaction to the collateral squeeze. On the liabilities side, it may seem remarkable that the deposits of US-chartered commercial banks increased at all during this turbulent period. We attribute the phenomenon to two factors. The first is federal deposit insurance (100 per cent of deposits up to $250,000 were insured, the limit having been temporarily increased from $100,000 in the Emergency Economic Stabilization Act of 2008, signed by President Bush on 3 October). The second is that there was a flight, which had begun in 2007, from other asset types which had come to be regarded as risky. These included certain kinds of commercial paper, notably ABCP, and money market mutual funds after 16 September 2008, when the Reserve Fund announced that two of its funds were worth less than 100 cents in the dollar (see Baba, McCauley and Ramaswamy Reference Baba, McCauley and Ramaswamy2009; Pozsar et al. Reference Pozsar, Adrian, Ashcraft and Boesky2010).Footnote 18 The funds coming out of the commercial paper market, money market mutual funds and other stressed markets had to be placed somewhere, and Treasury securities were in fixed supply. Investors who did not roll over their ABCP holdings on maturity left the money in the bank. There was nowhere else for them to go, except perhaps to banknotes or real assets, and the outlook for bank deposits was not bad enough for that (though the price of gold rose very sharply). The increase in bank deposits caused by the flight from money market mutual funds and the shadow banking system evidently outweighed the reduction that will have arisen from the purchases by real-money investors of assets sold by shadow banks.
Thus the contraction of the shadow banking system led to changes in bank balance sheets but had no effect on aggregate commercial bank liquidity. The acquisition of additional assets by commercial banks as the shadow banking system contracted did not affect their aggregate cash flow, because the contraction of the shadow banking system also provided them with additional deposits; in other words, it involved no pressure at all on the liquidity of the banking system in aggregate. The enforced deleveraging of some shadow banks will have led to a fall in the bank deposits of real-money investors, who must have bought the assets that shadow banks sold, but the funds withdrawn by real money investors will have been used by the shadow banks to repay commercial bank loans, so that the effect on the commercial banks' aggregate cash flow will again have been zero. Individual banks, however, cannot have been sure that the amounts of money that they had to find to finance additional assets on their balance sheets would all come back to them in additional deposits, or that lost deposits would all come back to them in the form of loan repayments. In the turmoil, they must have become much more uncertain about their future cash flows. The increase in cash assets recorded in Table 6 can therefore be interpreted as additional precautionary demand for liquid assets.
During a collateral squeeze, unsecured borrowing (or drawing down of unsecured deposits) was especially valuable, since it generated cash without any immediate loss of collateral. Unsecured borrowing was difficult during the 2008 crisis, but some financial companies had foreign affiliates which they could induce to place funds with them in the form of new deposits or loans, or to repay existing debts owed to them, as part of intra-group funds transfers. Against this background, the increase of $575 billion in commercial banks' ‘net debt to foreign offices’ shown in Table 6 is understandable. Foreign bank affiliates (branches and agencies of foreign banks) in the United States were under greater pressure than US-domiciled banks. They had lost much of the funding they had previously received from money market mutual funds.Footnote 19 Foreign bank branches (the most common type of affiliate) were not allowed to take deposits of less than $100,000 from US citizens and residents, and could therefore not receive smaller deposits that were fleeing from money market mutual funds. Moreover, deposits in foreign bank branches established after 19 December 1991 were not covered by US deposit insurance. Foreign bank affiliates' deposits fell by $258 billion (Table 6). Their ‘borrowings from others’ – presumably mainly from the Fed – increased by $73 billion,Footnote 20 and they raised $410 billion from their foreign offices, compared with the $165 billion that US- chartered banks raised from their foreign offices during the same period.
In fact, most of the external inflow to the United States took place in October and November. Commercial banks' net debt to foreign offices increased by just $74 billion between 3 September and 1 October, but it had increased by a further $457 billion by 3 December. The inflow was facilitated by swap lines provided by the Fed to foreign central banks, which enabled the foreign offices of commercial banks located in the United States to remit dollar funds to the United States (Allen and Moessner Reference Allen and Moessner2010).Footnote 21 The inflow of funds from abroad thus played a large role in easing the collateral squeeze in US financial markets during October and November, and in financing the large repayments of borrowings from the domestic emergency liquidity facilities provided by the Fed.
Collateral seems to have been less widely used in 1931 than in 2008, and the liquidity squeeze was propagated directly from the countries immediately affected by the crisis to London, which was the world's main international financial centre. People and companies needing liquidity on account of the crises would naturally have drawn it from London. In particular, London merchant banks had provided extensive acceptance credits to central European borrowers, especially in Germany.Footnote 22 After the crises, the borrowers could not pay the bills on time, and the acceptors were therefore liable to the holders of the bills. Standstill agreements were reached under which the creditors agreed not to call in the debts, and the existing credits were frozen on their original terms but interest payments were guaranteed (Forbes Reference Forbes1987, p. 575). The German agreement provided that there was to be no discrimination among the creditors, but that the German authorities would discriminate in favour of remittances due under the agreement (Sayers Reference Sayers1976, pp. 506–7). German debtors were required to provide eligible bills for acceptance. As Roberts (Reference Roberts, Roberts and Kynaston1995, p. 164) aptly says, ‘Under this agreement German bills remained in the [London] market and were repeatedly renewed on expiry, the sort of practice which had hitherto caused apoplexy in the Discount Office [of the Bank of England].’
The central European crisis and the standstill agreements put great strain on the liquidity (and capital) of the London accepting houses and seriously aggravated the existing lack of liquidity of the London money market as a whole. The Bank of England's initial position, before the standstill agreements had been reached, had been that bills drawn against frozen credits, once renewed, would not be eligible for rediscount, and that no loans would be made to accepting houses with large frozen positions (Sayers Reference Sayers1976, p. 505), though the Bank encouraged the clearing banks to provide support to the accepting houses.Footnote 23 The Bank's attitude is not surprising, since the total debts in London covered by the standstill agreement were £66 million, compared to the Bank of England's gold reserves of £132 million at the end of July 1931. However, the standstill agreement with Germany required the debtors to provide eligible bills for acceptance. Eligibility was a matter for the Bank of England, and Sayers reports that ‘the Bank [of England] leaned over backwards to ensure marketability’ of standstill bills, and that ‘in the first half of 1932 nearly half the bills discounted at the Bank [of England] were of German origin’ (Sayers Reference Sayers1976, pp. 507 and 509 footnote 1). It is impossible to trace through time the amounts of such bills that the Bank purchased. But whatever the amounts may have been, the residual liquidity problems of the merchant banks represented a kind of contingent liability of the Bank of England, and the inadequacy of the Bank's own liquidity was in any case already threatening the sustainability of sterling's gold parity.Footnote 24
Using such bank-by-bank data as are publicly available, Accominotti (Reference Accominotti2009) shows that the banks which were most exposed to standstill bills also experienced large deposit outflows during 1931, and thus faced a double threat to their liquidity. Nearly all of the accepting houses' deposits were of foreign origin, according to Truptil (Reference Truptil1936, p. 314), and it is plausible that those banks whose acceptances were largely central European also had a high proportion of central European deposits, which would naturally have been withdrawn during the crisis to meet the depositors' liquidity needs.
The alternative to the standstill agreements would have been a default by the debtors, which ‘threatened to bankrupt several of the merchant banks, probably some of the discount houses, and possibly to provoke a crisis in the banking system’ (Roberts Reference Roberts1992, p. 253). The artificial maintenance of the fiction that standstill bills were high-quality liquid assets in London was the price of avoiding that outcome. The experience of J. Henry Schröder and Co., one of the accepting houses hardest hit by the crisis, illustrates this. In July 1931, Schröders' frozen debts were £4.9 million, compared with partners' capital of £3.2 million at the end of 1930 (Table 7) (Roberts Reference Roberts1992, p. 264). Schröders were required to withdraw standstill bills from the money market during the 1930s, but the withdrawal was very gradual and was not completed until September 1939.
J. Henry Schröder and Co., balance sheet 1929–39 (£ million)

Source: Roberts Reference Roberts1992, appendix IV(i).
The British clearing banks, of course, had much larger liquid liabilities than the accepting houses,Footnote 25 but the vast majority of their liabilities were presumably of domestic origin and not very vulnerable to flight. Their demand and time deposits fell by £58 million between June and October 1931, but as Billings and Capie (Reference Billings and Capie2010) recount, they were able to withstand the shocks of 1931 without any special support, and to provide support themselves to accepting houses and other banks in distress.Footnote 26 We agree with Billings and Capie that there was no financial crisis in Britain in 1931.Footnote 27 That was because the ability and willingness of the monetary authorities to defend the gold parity fell far short of the liquid assets of the clearing banks. According to the British Government statement issued on 20 September 1931, when the gold standard was suspended, ‘since the end of July funds amounting to more than £200 millions have been withdrawn from the London market’.Footnote 28 The cash and liquid assets of the London clearing banks had amounted to £586 million in June 1931, however.Footnote 29
IV
Central banks themselves contributed to the liquidity problems of commercial banks in both crises, as their reserve managers joined in the flight to liquidity and safety. In the middle of 2008, global foreign exchange reserves were $7.4 trillion. They were, and are, generally managed by central banks separately from domestic market operations. Typically, the pursuit of returns by central banks is subject to a low tolerance for the risk of losses and lack of liquidity. In this respect, the operations of central banks are very similar to those of many commercial asset managers with conservative investment mandates. However, quite extensive information is available about the reserve management behaviour of central banks, thanks to the data released under the IMF Special Data Dissemination Standard, to the BIS international banking statistics and to US sources.
Pihlmann and van der Hoorn (Reference Pihlmann and Van der Hoorn2010) show that, after a period in which they appeared willing to take increasing amounts of risk in pursuit of additional returns, reserve managers withdrew $150 billion of unsecured deposits from banks between August 2007 and August 2008 (before Lehman Brothers failed), and a further $150 billion between September and December 2008 (of course, not all of the deposit withdrawals will have been from banks in the United States). McCauley and Rigaudy (Reference McCauley and Rigaudy2011) show that central banks also retreated from US federal agency debentures and securities lending, and describe how they redeployed the funds withdrawn from commercial banks, e.g. in government debt.
On plausible assumptions, the unsecured deposits that central bank reserve managers withdrew from commercial banks will have been replaced by collateralised loans extended to the commercial banks concerned by their home central banks. Thus the net effect of the withdrawal of unsecured deposits will have been a drain of collateral assets from commercial banks to central banks.
In 1931, there were widespread reductions in foreign exchange reserves (Table 2), which continued in 1932 (Eichengreen and Flandreau Reference Eichengreen and Flandreau2008). The Genoa Conference of 1922 had recommended economising on gold in order to enable the world monetary system to adapt to the higher price levels that followed the inflation of the Great War while retaining the essential features of the gold standard (Brown Reference Brown1940, ch. 20; Eichengreen Reference Eichengreen1995, pp. 157–62). One technique was for foreign exchange reserves to supplement gold as backing for national currencies; they had the attraction for the holder that, unlike gold reserves, they were interest-bearing. In addition, in many countries gold coins, which had circulated freely before being withdrawn at the outbreak of war in 1914, were not returned to general circulation, so that the available gold could be concentrated on central bank reserves. However, when it became clear that national currencies might depart from the gold standard, foreign exchange reserves were hastily liquidated. By the end of 1932, foreign exchange holdings of central banks had fallen to 25 per cent of their pre-crisis total. The Bank for International Settlements (1933, p. 10) estimated that the reduction had involved the disposal of CHF 2.5 billion of foreign exchange reserves in settlements by debtor central banks which might otherwise have been made in gold, and outright sales of CHF 5 billion of foreign exchange reserves for gold. The total was therefore CHF 7.5 billion ($1,450 million).
Just as the addition of foreign exchange to gold as a medium for the holding of national reserves had enabled a larger amount of credit and bank deposits to be extended on the foundation of a limited global supply of gold during the 1920s, so the conversion of foreign exchange reserves back into gold caused a contraction in credit and bank deposits in the 1930s.Footnote 30
If the reserve managers' withdrawals from bank liabilities during the two crises are measured relative to the annual GDP of the United States (of course, in neither crisis was the withdrawal from claims on banks by reserve managers confined to US banks), then the withdrawal of $300 billion in 2007-8 (roughly 2 per cent) appears slightly larger than the CHF 7.5 billion of 1931-2 (1 ½ per cent). However, if the comparison is made relative to total short-term international indebtedness, then the 1931-2 withdrawal appears much larger (more than 10 per cent compared to roughly 1 per cent).Footnote 31
V
Carry trades involve borrowing in a currency in which interest rates are relatively low in order to finance the purchase of assets denominated in a currency in which interest rates are higher. The carry trader earns the difference between the interest (or other) returns on the purchased asset and the interest due on the borrowing, but is of course exposed to foreign exchange risk.
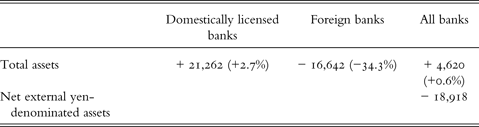
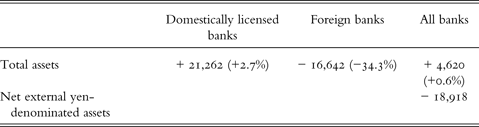
The long period after 1997 when interest rates were kept very low in Japan in order to help stimulate the economy provided ample opportunity for carry traders to borrow yen very cheaply and invest in high-yielding currencies, in many cases in fixed-income securities. The total amount of yen carry trades has been estimated at around $1 trillion (Cecchetti, Fender and McGuire Reference Cecchetti, Fender and McGuire2010). The attractiveness of yen carry trades diminished with the onset of the financial crisis, as the differentials between interest rates in yen and in other currencies narrowed and exchange rate volatility increased (Bank of Japan 2009, p. 65). Japanese banks' net external yen-denominated assets had continued to increase in the second half of 2007 and the first half of 2008, but there was a large flow of yen-denominated funds into Japanese banks in the second half of 2008 (Table 8), which is most naturally interpreted as the unwinding of yen carry trades. The unwinding was reflected mainly in a fall in the assets and liabilities of foreign banks located in Japan; domestically owned banks were barely affected. The dollar equivalent of the fall in the banks' net external assets between September 2008 and the end of 2009 was about $185 billion.
Selected assets and liabilities of banks located in Japan: changes from end July 2008 to end December 2009 (JPY billion)
Source: Bank of Japan.
The unwinding of yen carry trades affected the countries in which the proceeds had been invested. The pre-crisis inflows to New Zealand were into bonds rather than bank deposits, so that the crisis did not cause a liquidity shortage there. However, the New Zealand dollar depreciated heavily, and 10-year bond yields remained little changed, after a brief dip, despite short-term interest rates falling from around 9 to around 3 per cent. New Zealand's current account balance of payments deficit narrowed from 8.7 per cent of GDP in 2008 to 2.9 per cent in 2009.
Carry trades were also undertaken in Swiss francs, notably in Hungary and Poland where Swiss franc-denominated mortgages became very popular. In 2008, more than half of total outstanding mortgages in both countries were denominated in foreign currencies, mainly Swiss francs. The lending banks had financed themselves largely with short-term wholesale market borrowing and when they were unable to roll over the borrowings they were forced to swap their domestic currencies, or sell them outright, for Swiss francs. The pressures thus created led to the drying up of FX swap markets and the Hungarian and Polish currencies depreciated sharply in the spot foreign exchange market. The pressures were partly relieved when the Swiss National Bank provided facilities for the central banks of Hungary and Poland to swap euros from their reserves for Swiss francs (Allen and Moessner Reference Allen and Moessner2010, section 11).
The nearest interwar analogue to carry trades was perhaps the international flows of funds which took place in the 1920s and 1930. In discussing the risks of present-day carry trades, Eichengreen (Reference Eichengreen2010) comments that ‘I could cite various historical illustrations of the danger. The locus classicus again is the Great Depression. The carry trade contributed to the unstable equilibrium of the 1920s, as investors funded themselves at 3% in New York to lend to Germany at 8%. Then as now, the migration of capital from low- to high-interest-rate countries was predicated on the mirage of stable exchange rates.’ Investors in the United States, for example, were attracted by the higher yields available on foreign bonds than on domestic ones. The principal borrower was Germany, whose current account deficit was much larger than its postwar reparation payments. Germany's issuance of long-term foreign loans between 1924 and 30 June 1931 amounted to RM 9.6 billion ($400 million, 9.6 per cent of Germany's GDP in 1931) and its short-term external debts in July 1931 were RM 12.0 billion ($500 million, 20.5 per cent of GDP). However, the flows were not unwound after the banking crises of 1931; rather, there was a wave of bond defaults, standstill agreements and exchange controls, following the banking crises in the debtor countries.Footnote 32
VI
The propagation of the two crises had some common features. The flight to liquidity and safety was a leading characteristic of both. There was a sudden wave of suspicion about the safety of assets which had hitherto been regarded as secure, and institutions which were thought to be over-exposed to such newly doubtful assets were subject to the risk of liquidity crises if they had short-maturity liabilities fixed in money value. In both crises, deposit outflows were not the only important sources of liquidity pressure on banks: in 1931, the central European acceptances of the London merchant banks were a serious problem, as, in 2008, were the liquidity commitments that commercial banks had provided to shadow banks. And in both crises, the managers of central banks' international reserves participated in the flight to liquidity and safety in the same way as other market participants. In 1931, the international transmission of the liquidity pressure was direct, since the London accepting houses were creditors of the debtors who could not repay; by contrast, in 2008 it was indirect, as the collateral squeeze which originated in the mortgage market put great pressure on foreign banks in the United States, which in turn transmitted it to other countries.
In both crises, the behaviour of creditors towards debtors, and vice versa, and the valuation of assets by creditors, were very important. The decision of the creditors of the central European countries during the 1931 crisis to reach standstill agreements, rather than declaring loans in default, meant that higher valuations could be placed on the debts. This made a difference to the immediate outlook for financial and economic stability in both central Europe and in the creditor countries, since defaults would probably have precipitated bank failures in the latter. The standstill agreements, together with the Bank of England's forbearance with regard to standstill bills, gave the accepting houses time to adjust while remaining in business (eight years, as it turned out), and thus performed a similar function to the Fed's provision of emergency liquidity to banks and broker-dealers in 2008. Market participants knew that the standstill bills might not be repaid, and in that sense they had full information. Nevertheless, it is arguable that the Bank of England's forbearance involved a deliberate distortion of the valuation of the bills and in that sense was not transparent, and that this instance of non-transparency helped to protect financial stability in the UK in 1931.
In 2008, the environment was very different. Gorton (Reference Gorton2010, chapter 3) argues that wholesale financial markets dried up because it was very difficult for holders of mortgage-backed securities to know how far they were exposed to subprime mortgage risk, and impossible for wholesale financial market participants to know how far their trading counterparties were exposed to it. In the absence of active markets, it was impossible to mark holdings of mortgage-backed securities to market for valuation purposes, and holders were driven to value them by reference to proprietary models, which, even though approved by regulators, did not carry conviction in the market. Audited accounts showing positive net worth did not provide reassurance as to solvency. In 2008, non-transparency was seriously damaging to financial stability.
However, there was a very important difference between the two crises, in the range and nature of assets that were regarded as ‘safe havens’ – i.e. which were regarded as liquid and safe. Central banks provided much more liquidity after the 2008 crisis than they had done in 1931, when they had been inhibited by the constraints of the gold standard. And inter-central bank co-operation worked far better: official international liquidity provision in 1931 was inadequate, whereas in 2008 Federal Reserve swap lines relieved many of the financial stresses in countries outside the United States that had followed Lehman Brothers' failure (Moessner and Allen Reference Moessner and Allen2011).
The gold standard set a benchmark for liquidity and safety that could be met only by assets of a certain kind, namely gold and assets which could be confidently expected to be convertible into gold at the parity rate. Commercial banks had experienced financial stress in many countries, there was no deposit insurance, and commercial bank liabilities were in many cases not regarded as safe. Budget deficits were regarded as incompatible with continued adherence to the gold standard. When doubts arose about particular classes of assets, such as claims on commercial banks, there was a scramble for assets in the elite group. The group included the liabilities (notes and deposits) of central banks which were regarded as being securely attached to the gold standard, but those central banks felt unable to expand their balance sheets much, partly for fear of undermining their ability to remain on the gold standard. They were unable to implement Bagehot's remedy for a banking crisis, of lending freely against good collateral at a high interest rate (Bagehot Reference Bagehot1892, pp. 198–201). As a result, monetary policy was very tight in gold standard countries, despite the depression, and countries abandoned the gold standard when its effects became intolerable, notably the United Kingdom in 1931 and the United States in 1933. As countries left the gold standard and their currencies depreciated, the pressures on those that remained increased. In fact, no country was still on the gold standard after 1936. The supply of liquid and safe assets was not only inelastic, but it also contracted over time, and the gold standard, being therefore incompatible with satisfactory management of the crisis, collapsed.
In 2008, a wider range of assets was regarded as liquid and safe, even though the relative prices of assets within the group could change. The group included deposits in a wide range of central banks, including those of the countries with the largest banking systems, and a wide range of government securities. Market participants were much more tolerant of budget deficits than they had been in the 1930s. Most governments accepted contingent liability for the safety of at least some bank deposits, and in some cases expanded deposit insurance even though the recession induced by the financial crisis had weakened their own finances. Crucially, it was possible to implement Bagehot's remedy and to expand the supply of liquid and safe assets massively without undermining their credibility among market participants. Thus central banks were able in effect to take on the function of money market intermediaries, as wholesale deposits migrated onto their balance sheets, and as they on-lent the funds to relieve shortages elsewhere in the market. Large budget deficits (which would have been anathema in 1931) emerged as automatic fiscal stabilisers came into operation and as some countries additionally undertook discretionary fiscal easing, and the contingent liabilities that most governments accepted for the security of at least some bank liabilities became more threatening. Nevertheless there was no serious loss of confidence in the safety of most governments' debts.Footnote 33
Thus the international monetary system, comprising both official institutions and the set of prevailing market beliefs, was much less fragile and much more resilient in 2008 than it had been in 1931. As a result, the near-term consequences of the recent crisis have been much less severe. It is too early to tell what the longer-term consequences might be.