Introduction
Dendrites of electrum and native gold or, more rarely, of other ore minerals (galena, sphalerite, acanthite, naumannite, etc.) are common in bonanza ores of low-sulfidation epithermal Au–Ag deposits, as recently reviewed by Tharalson et al. (Reference Tharalson, Taksavasu, Monecke, Reynolds, Kelly, Pfaff, Bell and Sherlock2023). The most common explanation for dendrite formation is transport of gold nanoparticles by hydrothermal fluid and subsequent deposition through aggregation simultaneously to the deposition of the silica colloids (Lindgren, Reference Lindgren1915; Boydell, Reference Boydell1925; Frondel, Reference Frondel1938; Chukhrov, Reference Chukhrov1955; Betekhtin et al., Reference Betekhtin, Genkin, Filimonova and Shadlun1958; Saunders, Reference Saunders1990; Saunders and Burke, Reference Saunders and Burke2017 and references therein). However, although there have been many publications on gold dendrites very few attempts have been made to study their internal structure. Petrovskaya (Reference Petrovskaya1973) classified morphological varieties of gold dendrites and found a mosaic texture in some of them. Saunders and Schoenly (Reference Saunders and Schoenly1995) showed the fractal nature of gold dendrites. The surface of electrum has been investigated with high-resolution Scanning Electron Microscopy (SEM) (Borisova, Reference Borisova2010; Saunders et al., Reference Saunders, Burke and Brueseke2020; Monecke et al., Reference Monecke, Reynolds, Taksavasu, Tharalson, Zeeck, Guzman, Gissler and Sherlock2023) and Burke et al. (Reference Burke, Rakovan and Krekeler2017) has investigated the internal structure of gold dendrites with Transmission Electron Microscopy (TEM) but no attempt has been made to investigate the 3-dimensional morphology of dendrites. It should also be noted that there is no precise definition of dendrites. They are commonly defined as having a tree-like morphology with no reference to the internal structure. Investigating the latter would help to reveal the mechanisms of dendrite growth and might give a clue to understanding the processes of deposition of bonanza ores.
In the last few years electron back-scattered diffraction (EBSD) has been proven as an effective tool to investigate micro- to nanoscale internal structures of minerals (Schwartz et al., Reference Schwartz, Kumar, Adams and Field2009). This is of critical importance for cubic minerals, where internal structures, such as twinning, recrystallisation, etc. cannot be revealed by optical microscopy. In particular, EBSD has been applied successfully to natural native gold (Grimshaw et al., Reference Grimshaw, Chapman and Pearce2017; Butt et al., Reference Butt, Hough and Verrall2020; Chapman et al., Reference Chapman, Banks, Styles, Walshaw, Piazolo, Morgan, Grimshaw, Spence-Jones, Matthews and Borovinskaya2021; Kozin et al., Reference Kozin, Stepanov, Palamarchuk, Shilovskikh and Zhdanova2023; Palyanova et al., Reference Palyanova, Kutyrev, Beliaeva, Shilovskikh, Zhegunov, Zhitova and Seryotkin2023), its synthetic analogues (Jhabvala et al., Reference Jhabvala, Boillat and Glardon2011, Bauer et al., Reference Bauer, Mougin, Faye, Buch, Ponthiaux and Vignal2020), and even to archaeological gold (Northover and Northover, Reference Northover, Northover, Meeks, Cartwright, Meek and Mongiatti2012). This article presents the results of a comprehensive study of electrum dendrites and associated minerals from the Ametistovoe Au–Ag epithermal deposit in Kamchatka and focuses on the internal structure and regularities of electrum dendrite growth. The approach includes the study of fluid inclusions in co-existing minerals, X-ray computed tomography, electron microprobe analysis and EBSD.
Brief outline of geology and mineralogy of the Ametistovoe Au–Ag epithermal deposit
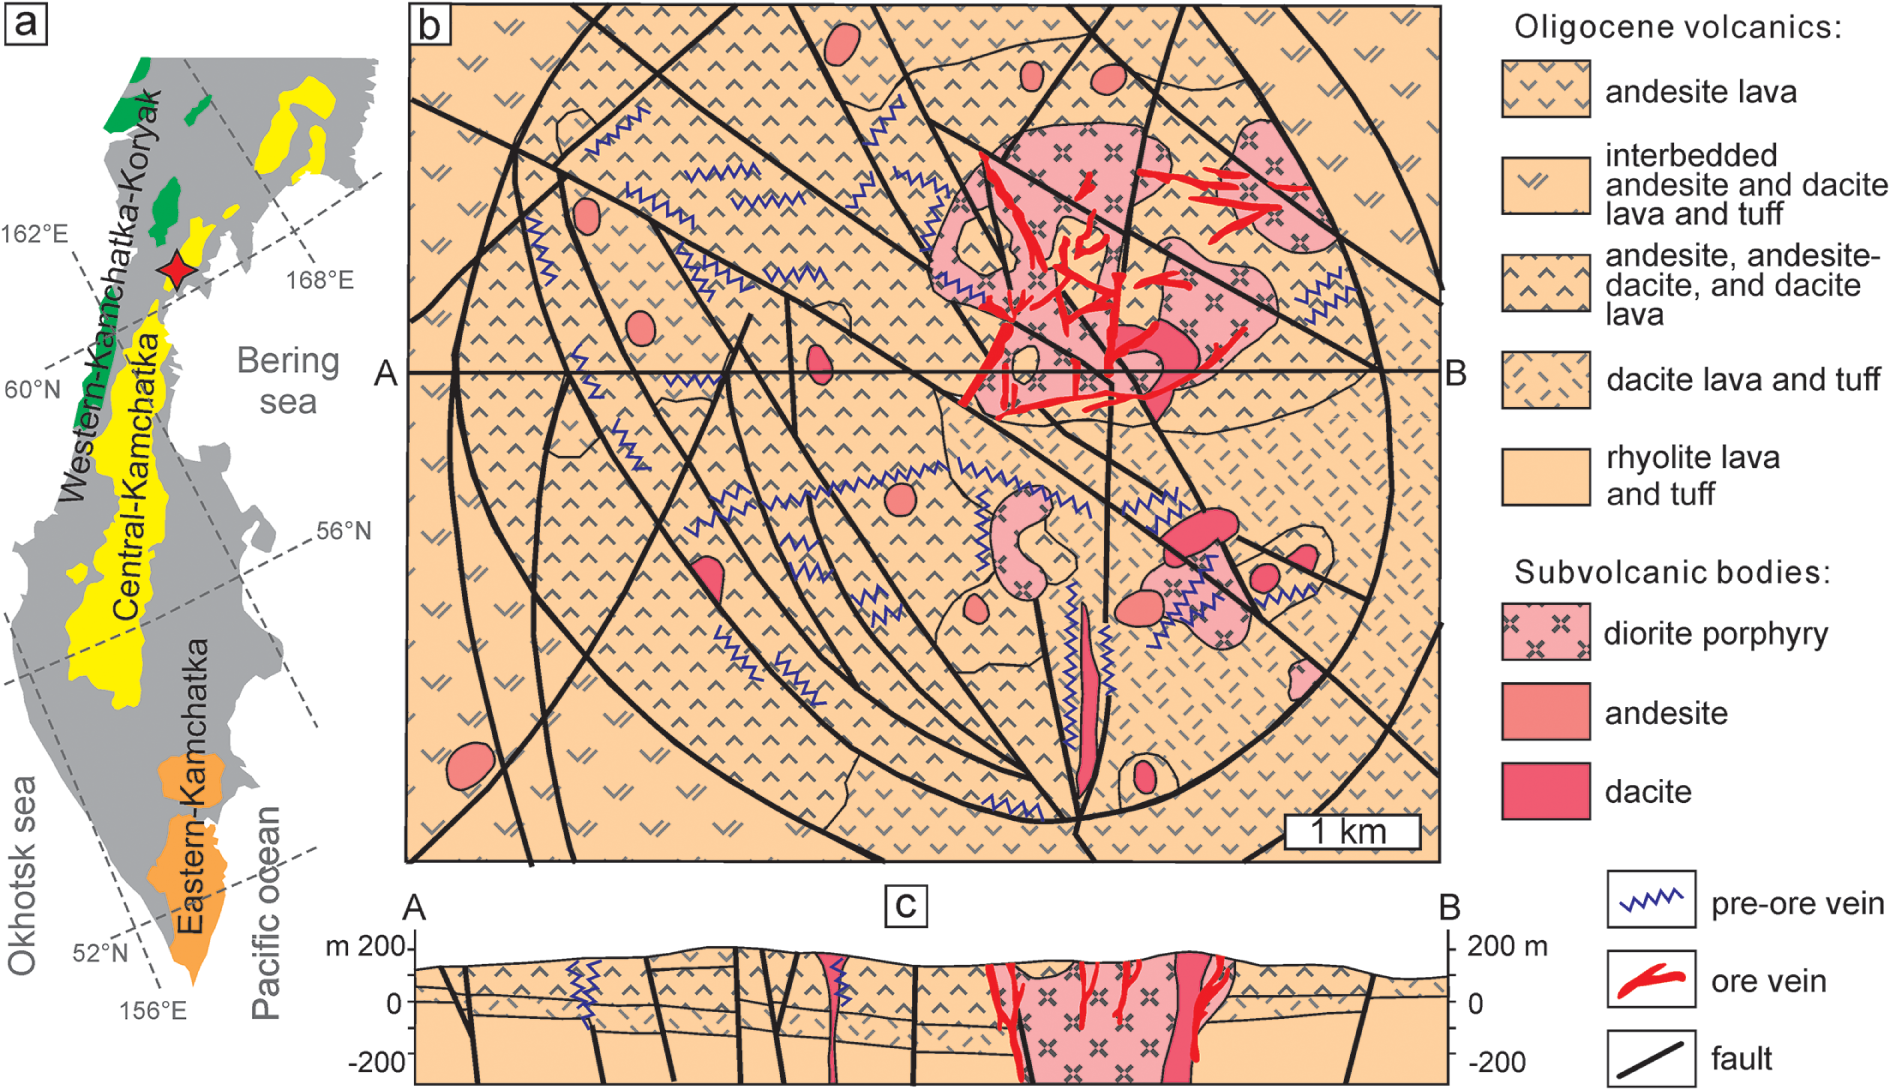
The Ametistovoe Au–Ag epithermal deposit is located in the northern part of the Kamchatka peninsula (Fig. 1a), ca. 100 km northwest of the Korf settlement. The Kamchatka peninsula, representing the northernmost part of the Pacific Rim, hosts dozens of epithermal Au deposits and occurrences which are confined to three volcanic belts (Litvinov et al., Reference Litvinov, Patoka, Markovsky, Frolov, Koliada, Pozdee and Pavlova1999; Petrenko, Reference Petrenko1999): Koryak-Western Kamchatka (submarine volcanics of Eocene-Oligocene age); Central Kamchatka (Oligocene to Quaternary rhyolite, dacite, andesite and basalt volcanics); and Eastern Kamchatka (basalts of Pliocene to Quaternary age). The Ametistovoe deposit is located in the northern part of the Central Kamchatka volcanic belt (Fig. 1a).
Schematic geological map (b) of the Ametistovoe ore field (Vartanyan et al., Reference Vartanyan, Oreshin, Khvorostov, Narseev, Timofeevsky and Yanovsky1988; North Kamchatka survey data) and the cross-section (c); the inset (a) shows the position of the deposit marked by a diamond symbol, modified after Litvinov et al. (Reference Litvinov, Patoka, Markovsky, Frolov, Koliada, Pozdee and Pavlova1999).

The deposit was discovered in 1967 during a 1:200,000 scale geological survey. Prospecting and exploration started in the 1970s and lasted until 1995. Ametistovoe has been exploited since 2012 by open pit and underground mining since 2019 (https://nedradv.ru/nedradv/invetsp?obj=37cbccbf7c0d2e5d6f9ac69fea1efebe#services). Proven reserves for 2021 are ca. 34.4 tons of Au and ca. 106 tons of Ag (Nedrav, Reference Nedrav2025). The Ametistovoe orefield is confined to the central part of the Tklavayam caldera composed of Oligocene volcanic sequences and subvolcanic bodies (Fig. 1b,c). The bottom of the sequence, up to 20 m in thickness, is represented by rhyolite, rhyolite–dacite and felsic tuff with interlayers of tuffstone and coal typical in a deep caldera lake. The upper part is composed of dacite, andesite–dacite, andesite, andesite–basalt lava and tuff with a total thickness of 200–400 m. Numerous subvolcanic diorite, andesite and dacite porphyry stocks mark the main and subordinate vents. The Ametistovoe ore field, ca. 35 km2, comprises ca. 300 steeply dipping quartz and kaolinite–quartz veins; the largest ones reach hundreds of metres along strike and are up to several metres in thickness. Veins are joined in bunches and ore zones which extend up to 1.5 km. Ore textures include massive, veinlet-disseminated, crustiform features. Sulfides are abundant and make up 3–5 to 30–50 vol.% of ore. Wall–rock alteration is represented by vuggy silica, quartz–kaolinite, kaolinite–hydromica–quartz and carbonate chlorite–quartz (Vartanyan et al., Reference Vartanyan, Oreshin, Khvorostov, Narseev, Timofeevsky and Yanovsky1988). Nekrasov (Reference Nekrasov1996) referred this alteration as an argillic type.
Vartanyan et al. (Reference Vartanyan, Oreshin, Khvorostov, Narseev, Timofeevsky and Yanovsky1988) proposed four distinct stages of ore formation: I – pyrite–quartz (pyrite, arsenopyrite, minor magnetite, rutile, chlorite, hydromica, etc.); II – sulfide–quartz (quartz, sphalerite, chalcopyrite, galena, pyrite, minor pyrrhotite, marcasite, stannite, scheelite, native gold, calcite, albite, etc.); III – gold–kaolinite–chlorite– sulfide–quartz or the main ore stage (quartz, kaolinite, chlorite, pyrite, galena, sphalerite, native gold (electrum), acanthite, minor adularia, hydromica, dickite, calcite, tetrahedrite group, naumannite, Ag sulfosalts, etc.); and IV – carbonate–quartz (quartz, calcite, stibnite, cinnabar, etc.).
Native gold finenessFootnote 1 varies from 960 in the early generation to 220 in late generation (Nekrasov, Reference Nekrasov1996) but most values are within 500–730 (Petrenko, Reference Petrenko1999).
Previous researchers have classified the deposit as a low sulfidation or adularia–sericite type deposit (Vartanyan et al., Reference Vartanyan, Oreshin, Khvorostov, Narseev, Timofeevsky and Yanovsky1988; Petrenko, Reference Petrenko1999; Bortnikov and Tolstykh, Reference Bortnikov and Tolstykh2023), but given its relation to the volcanic caldera, alteration type and abundance of sulfides, perhaps it is more akin to the intermediate sulfidation type in the classification of Sillitoe and Hedenquist (Reference Sillitoe and Hedenquist2003).
Methods
SEM-EDX and electron microprobe analysis
Ore and gangue minerals were analysed with a Jeol-5900 SEM with Oxford Instruments EDX detector (Natural History Museum, London). Electron microprobe analysis (EMPA) of electrum and sphalerite was performed with a Cameca SX-100 microprobe (NHM, London) equipped with five wavelength-dispersive X-ray detectors (WDX). The following conditions were used: accelerating voltage = 20 keV, sample current = 20 nA and beam diameter = 2 µm. For electrum the following lines were used: Kα for S, Cu, As, Se, Ag, Sb, Te, Au and Hg and Mα for Pb and Bi. For sphalerite: Kα for S, Cu, Fe, Zn and Mn, Lα for Cd, standards: ZnS for S and Zn, CdS for Cd and pure metals for Mn, Fe and Cu.
Fluid inclusion study
Microthermometric measurements of fluid inclusions were carried out on doubly polished thin sections using a LINKAM THM-600 heating–freezing stage in the Institute of Experimental Mineralogy Russian Academy of Sciences, Chernogolovka, Russia. The temperature of phase transitions was measured within the range –196 to +600°C with an accuracy of ±0.2°C between –20 and +20°C and no less than ±1.0°C outside of this interval. The salt composition of the fluids was determined from the eutectic temperature (Te) according to Crawford (Reference Crawford, Hollister and Crawford1981); the salinity was estimated from the temperature of ice melting (Tm) using the NaCl–H2O phase diagram (Bodnar and Vityk, Reference Bodnar, Vityk, Vivo and Frezzotti1994). The measurements were carried out for groups of inclusions with similar relationships of phases to avoid errors related to the disintegration of vacuoles after fluid heterogenisation (Roedder, Reference Roedder1984).
X-ray computed microtomography
Four cylinders with a diameter of ca. 2 to 2.5 mm were drilled from polished sections. The cylinders were scanned via an X-ray tomography analysis facility at the Centre for X-ray Diffraction Studies of the Research Park of St. Petersburg State University (analyst: L.Yu. Kryuchkova) using a SkyScan-1172 microtomography scanner (Bruker microCT, Belgium). The equipment settings were: accelerating voltage 100 keV; a current of 100 µА, an acquisition time of 3.8 to 5 seconds per image, and 5 to 10 frames. An Al+Cu filter was used to minimise the hardening of the X-ray beam. Samples were scanned with a rotation of 180 and 360°. To reconstruct the array of shadow images, NRecon software (Bruker microCT) was used, which permits levelling instrument artifacts and can set the range of grey gradations corresponding to the value of X-ray absorption and, accordingly, X-ray density. To analyse the obtained microtomographic data, DataViewer and CTVox software (Bruker microCT) were used.
Electron back-scattered diffraction (EBSD)
All samples were treated with Ar plasma via Oxford IonFab300 plasma etcher (10 min exposure, 500 V accelerating voltage and 200 mA beam current) at the ‘Nanophotonics’ centre of SPbU, (Saint-Petersburg University, Russia). The electron back-scattered diffraction study was carried out with a Hitachi S-3400N electron microscope equipped with an Oxford NordlysNano EBSD detector and energy dispersive spectrometer (EDS) Oxford X-Max 20 at the SPbU, ‘Geomodel’ centre (Saint-Petersburg, Russia). Operating conditions were: 30 kV (accelerating voltage), 2 to 5 nA (beam current), 4×4 pixels binning, averaging 2–3 images and total dwell time 30–60 µs per pixel. The images obtained were indexed automatically in real time based on quartz (P3221) and native gold (Fm3m) due to the high probability of mis-indexing for native gold/galena/sphalerite/chalcopyrite. Subsequently, cubic phases were separated manually on the basis of element-distribution maps obtained by EDS. Data were processed with Oxford Channel5 software. Phase maps, band contrast (pattern quality) maps, inverse pole figure (IPF) maps and misorientation measurements were generated (Prior et al., Reference Prior, Boyle, Brenker, Cheadle, Day, Lopez, Peruzzo, Potts, Reddy, Spiess, Timms, Trimby, Wheeler and Zetterstrom1999; Maitlan, and Sitzman, Reference Maitland, Sitzman, Zhou and Wang2007; Brodusch et al., Reference Brodusch, Demers and Gauvin2018 and references therein). The band contrast maps show the intensity of diffraction patterns, revealing the distribution of grain boundaries, twin boundaries, and microstructures within crystals. Grains with higher quality of diffraction pattern are coloured by light grey, whereas ones with low quality are darker. Orientation data is represented in inverse polar figure (IPF) colour schemes, which depicts coincidence of sample coordinate axis with the crystal’s orientation. This colour scheme was chosen as more visual compared to universal ones. The choice of exact sample coordinate axis is conditioned by higher visual contrast for reader’s convenience.
Results
Mineral assemblages and composition
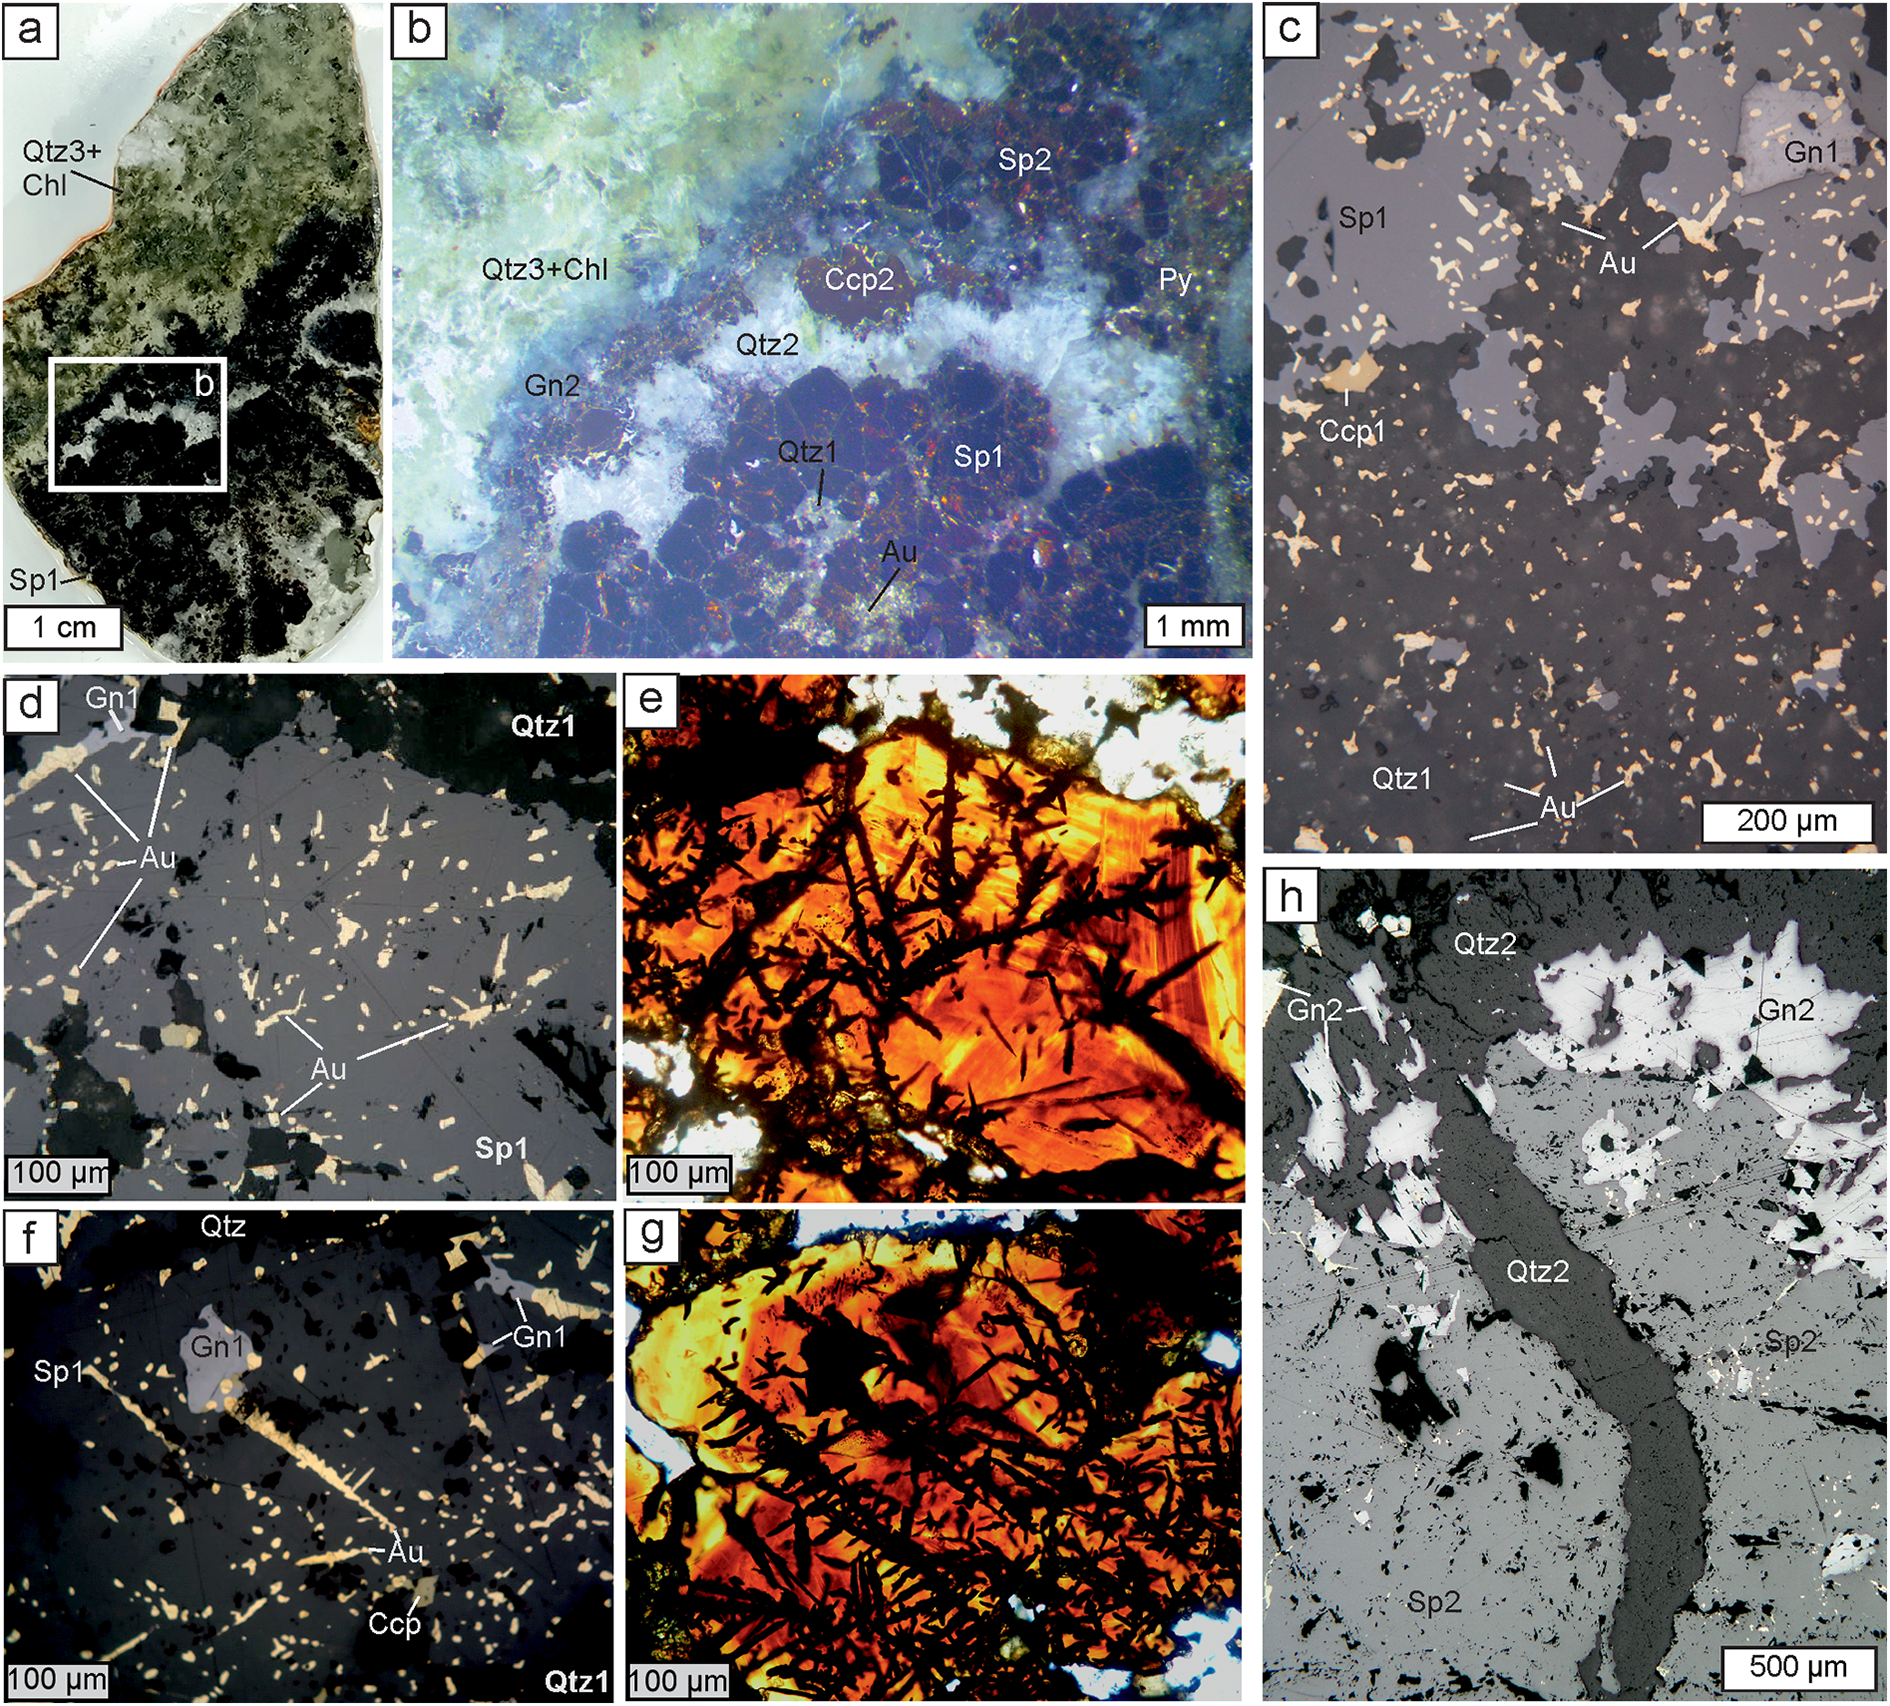
The sample collection comprised 14 specimens of quartz–sulfide veins from Ametistovoe representing all four vein formation stages. For detailed investigation the sample which was visually most enriched in electrum was selected. This sample represents mineralisation of the gold–sulfide–kaolinite–chlorite–sulfide–quartz (main ore) stage. Several polished sections and two double-polished sections were prepared. In these sections the main ore stage is represented by aggregates of quartz and reddish-brown sphalerite (Fig. 2). Pyrite, chalcopyrite, galena and electrum are also common.
Images of the typical ore textures of the samples studied. (a) Photograph of a polished section of a zoned quartz-sulfide veinlet. The location of (b) is shown in the box. (b) Photograph of a portion of (a) using a stereomicroscope, showing mineral sequence within the veinlet. (c) Photomicrograph (reflected light) showing sphalerite-1 with galena, both with oval inclusions of electrum and also irregularly shaped electrum in (mosaic) quartz-1. (d,e) Paired photomicrographs of a doubly-polished section showing electrum dendrites and inclusions within sphalerite-1 in reflected light (d) and transmitted light (e). (f,g) Paired photomicrographs similar to (d,e) showing electrum dendrites and inclusions within sphalerite-1 and locally galena-1 (reflected light, f, and transmitted light, g). (h) Photomicrograph (reflected light) showing electrum-free sphalerite-2 and galena-2 overgrown by quartz-2 and crosscut by a later quartz-2 veinlet. Abbreviations: Qtz – quartz, Chl – chlorite, Sp – sphalerite, Gn – galena, Ccp – chalcopyrite, Au – electrum; 1, 2, 3 indicate distinct generations of a mineral.

The mineral sequence observed in successive vein filling is as follows (Fig. 2a). The majority of a vein is composed of microcrystalline quartz and sphalerite-1. Sphalerite forms crystals 1–2 mm and contains small inclusions of galena-1 and chalcopyrite-1 (Fig. 2b,c). Quartz, sphalerite-1 and, sometimes, galena-1 and chalcopyrite-1 contain abundant inclusions of electrum, generally 10 to 40–50 μm in size (Fig. 2c). Within quartz, electrum forms xenomorphic grains with an irregular habit. In reflected light within sphalerite and other sulfides electrum has regular rounded or oval habits, sometimes elongated up to 500 μm (Fig. 2d,f). In transmitted light, however, electrum appears to form dendrites within sphalerite (Fig. 2e,g). Rare hessite and Au–Ag tellurides, which could not be analysed due to their small size, were found in intergrowths with electrum.
The aggregate of electrum-bearing quartz and sulfides is overgrown by a transparent quartz druse with idiomorphic transparent–white crystals followed by pyrite, sphalerite-2, chalcopyrite-2 and galena-2 (Fig. 2b,h). These late sulfides can also fill cracks in sphalerite-1. Electrum was not observed here. The axial part of vein is filled with quartz-3 and minor chlorite (Fig. 2a,b).
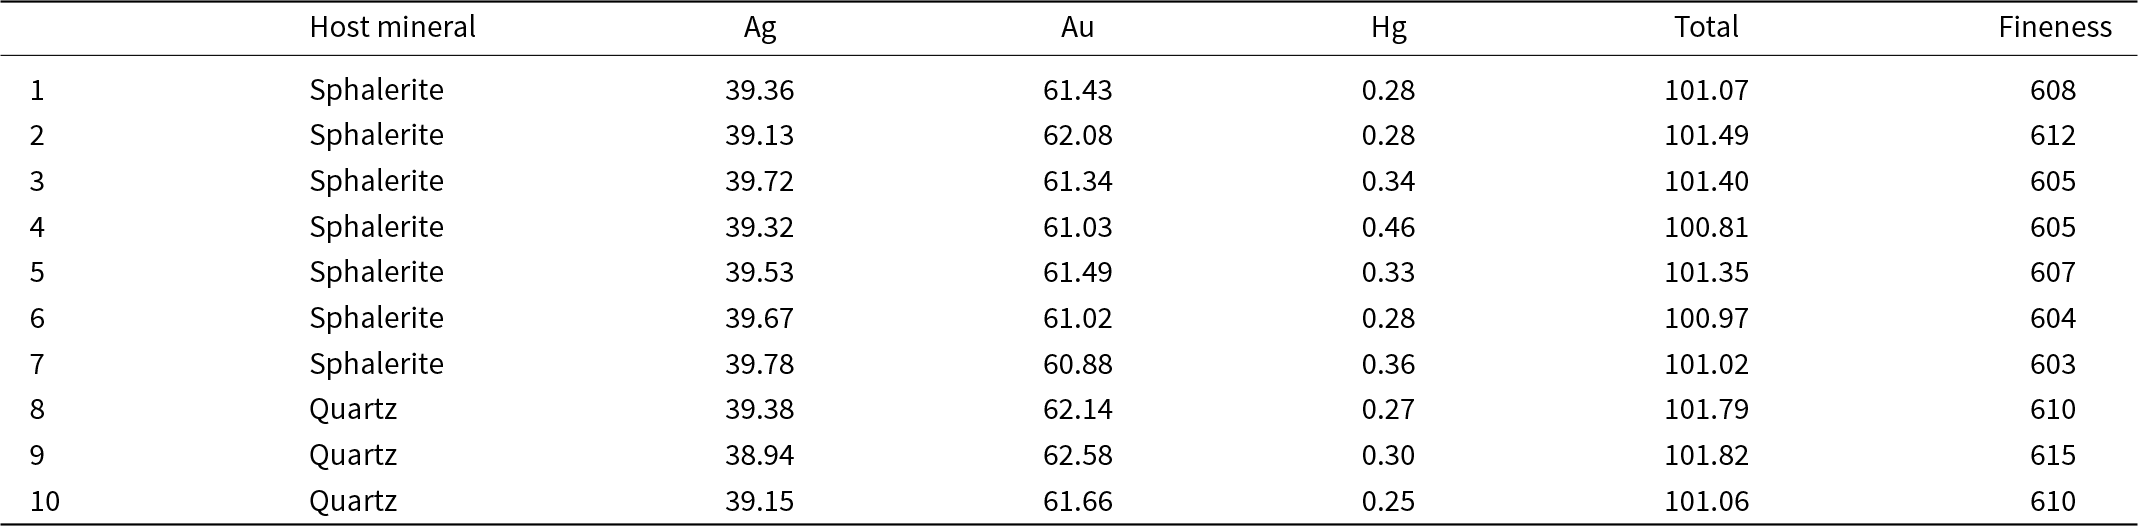
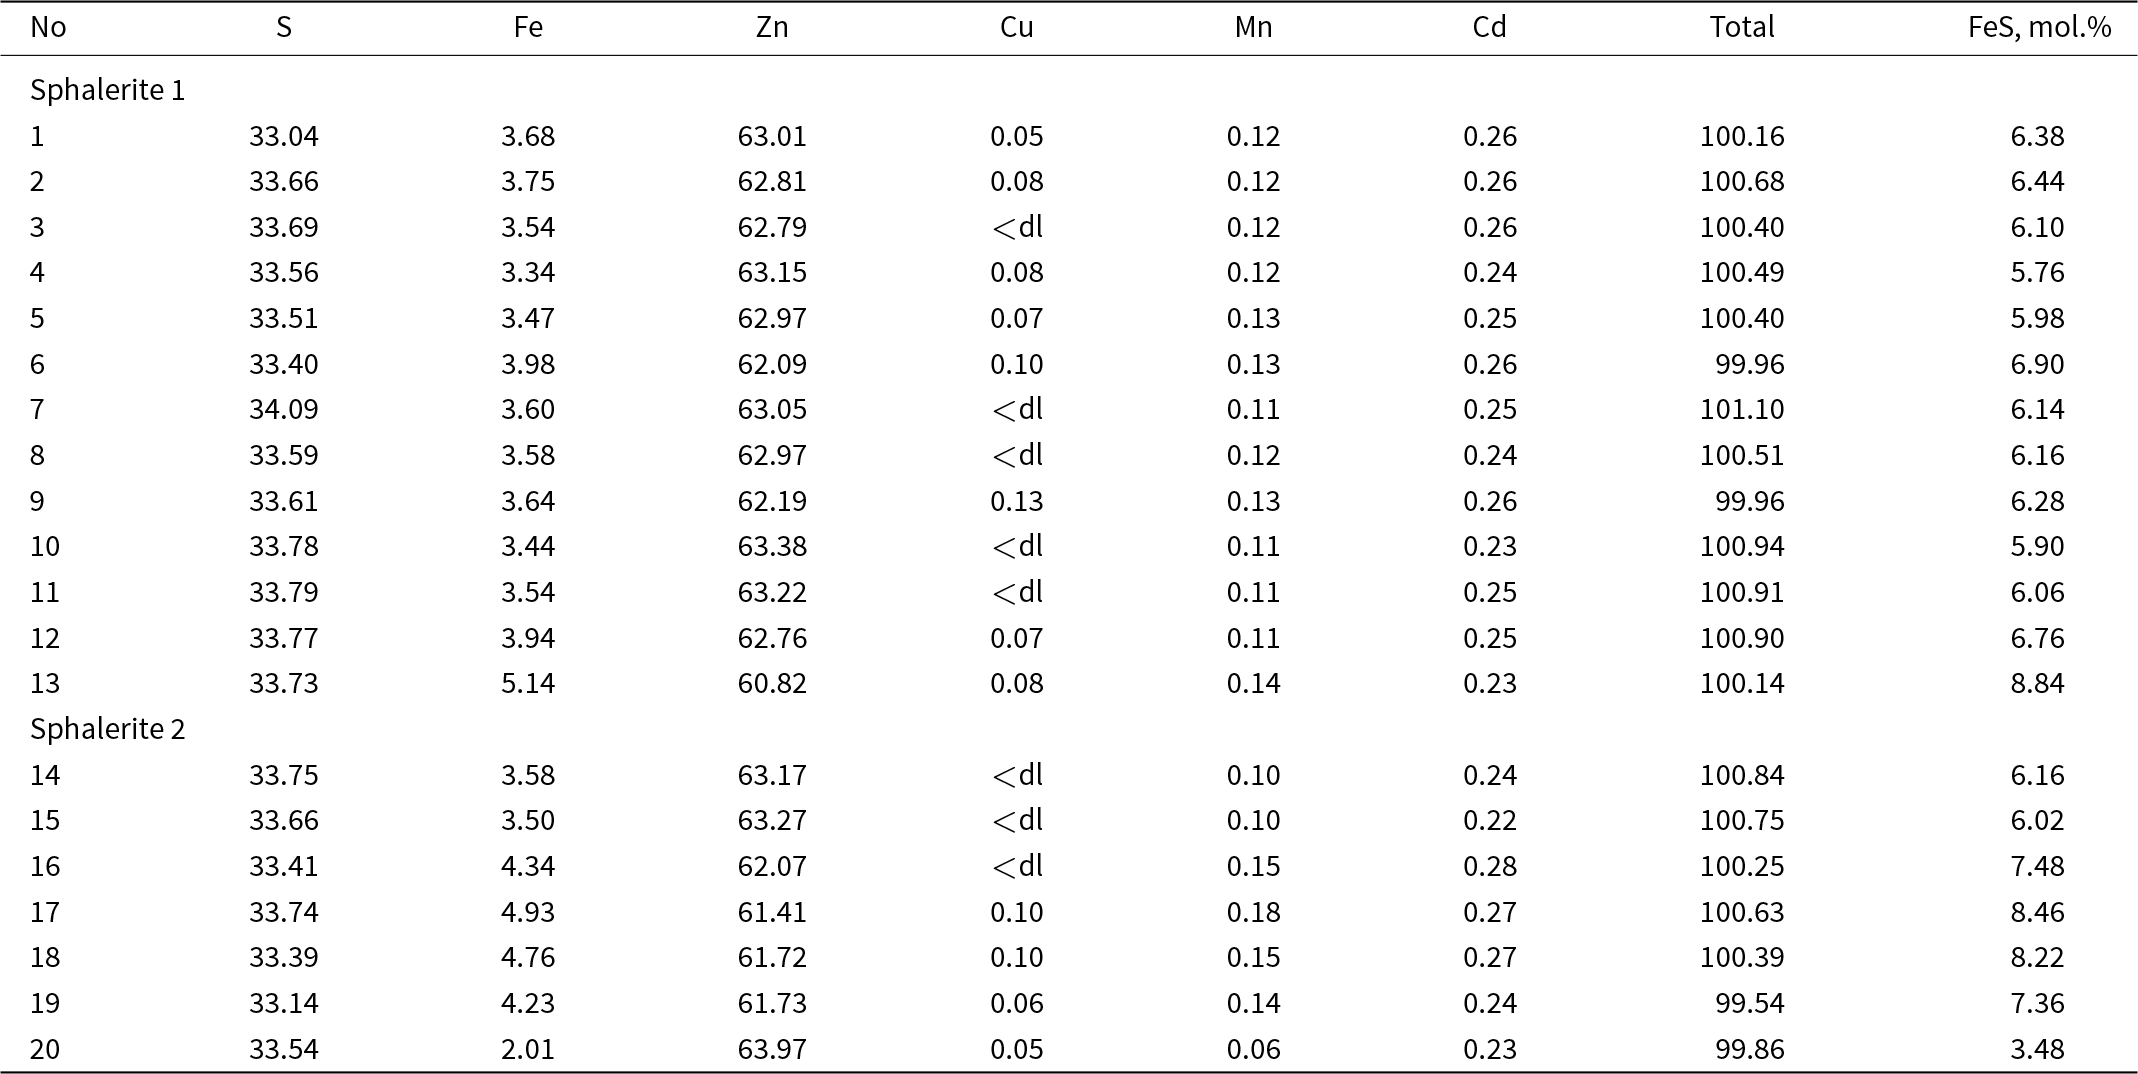
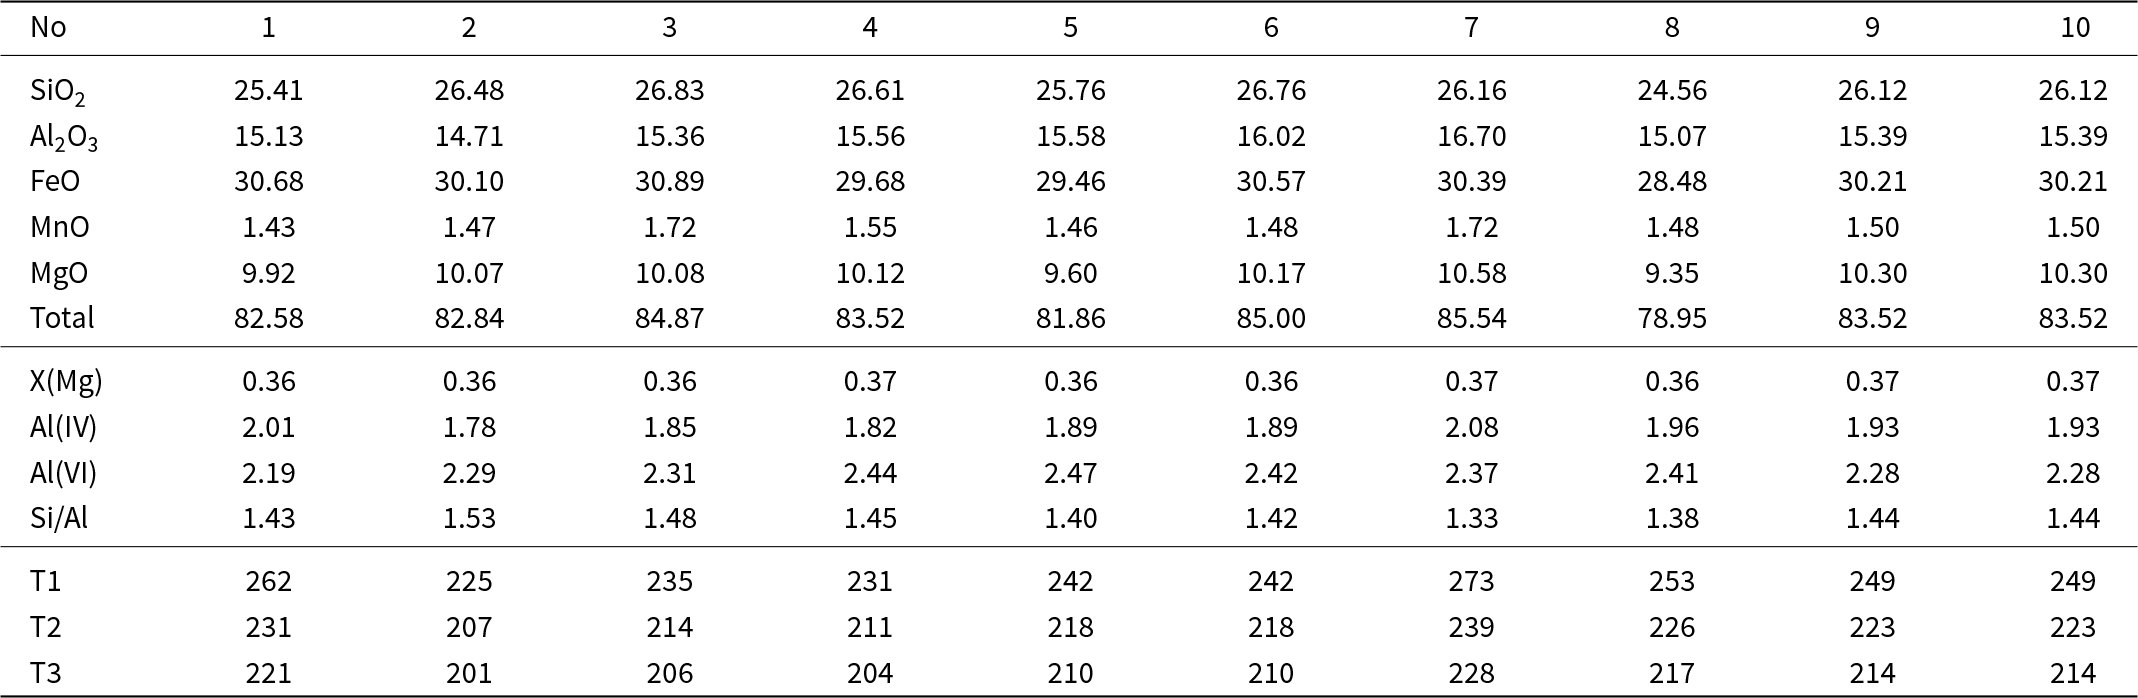
Electrum exhibits a general uniform composition (Table 1 and Supplementary material 1) with Au from 60.88–62.58 wt.%, Ag 38.94–39.78 wt.% and Hg 0.25–0.46 wt.%; which corresponds to a fineness of 603–615. No correlation between composition and the host mineral was noted. Sphalerite contains 2–8.15 wt.% of Fe (3.5–14.2 mol.% FeS), Data from EMPA revealed up to 0.13 wt.% Cu, up to 0.18 wt.% Mn and 0.22–0.28 wt.% Cd (Table 2). Sphalerite-1 intergrown with electrum has 4.7–8.8, mean 6.3 mol.% FeS. This has compositional zoning (Fig. 2 d,f), with the core from 7.4–8.2 mol.% FeS and the rim with ca. 4.7 mol.% FeS. Sphalerite-2 is characterised by chalcopyrite emulsion and has 3.5–14.2, mean 8.1 mol.% FeS (Table 2 and Supplementary material 1). The chlorite (Table 3) belongs to the clinochlore–daphnite series with insignificant amounts of sudoite (Bailey, Reference Bailey and Bailey1988). The X(Mg) is 0.36–0.37 and the Si/Al ratio varies from 1.33–1.53. MnO is always present (1.43–1.72 wt.%) and Ti, Cr, Ca, Na and K not detected. Chlorite formation temperatures were calculated according to Cathelineau (Reference Cathelineau1988), Kranidiotis and McLean (Reference Kranidiotis and McLean1987) and Kotelnikov et al. (Reference Kotelnikov, Suk, Kotelnikova, Tschekina and Kalinin2012) and all lie between 201°C and 273°C (Table 3).
Representative compositions of electrum (wt.%)

Representative compositions of sphalerite (wt.%)

Notes: ‘dl' detection limit
Composition of chlorite (wt.%)

Note: T1– Cathelineau (Reference Cathelineau1988), T2– Kranidiotis and McLenan (Reference Kranidiotis and McLean1987), T3– Kotelnikov et al. (Reference Kotelnikov, Suk, Kotelnikova, Tschekina and Kalinin2012)
Fluid inclusion data
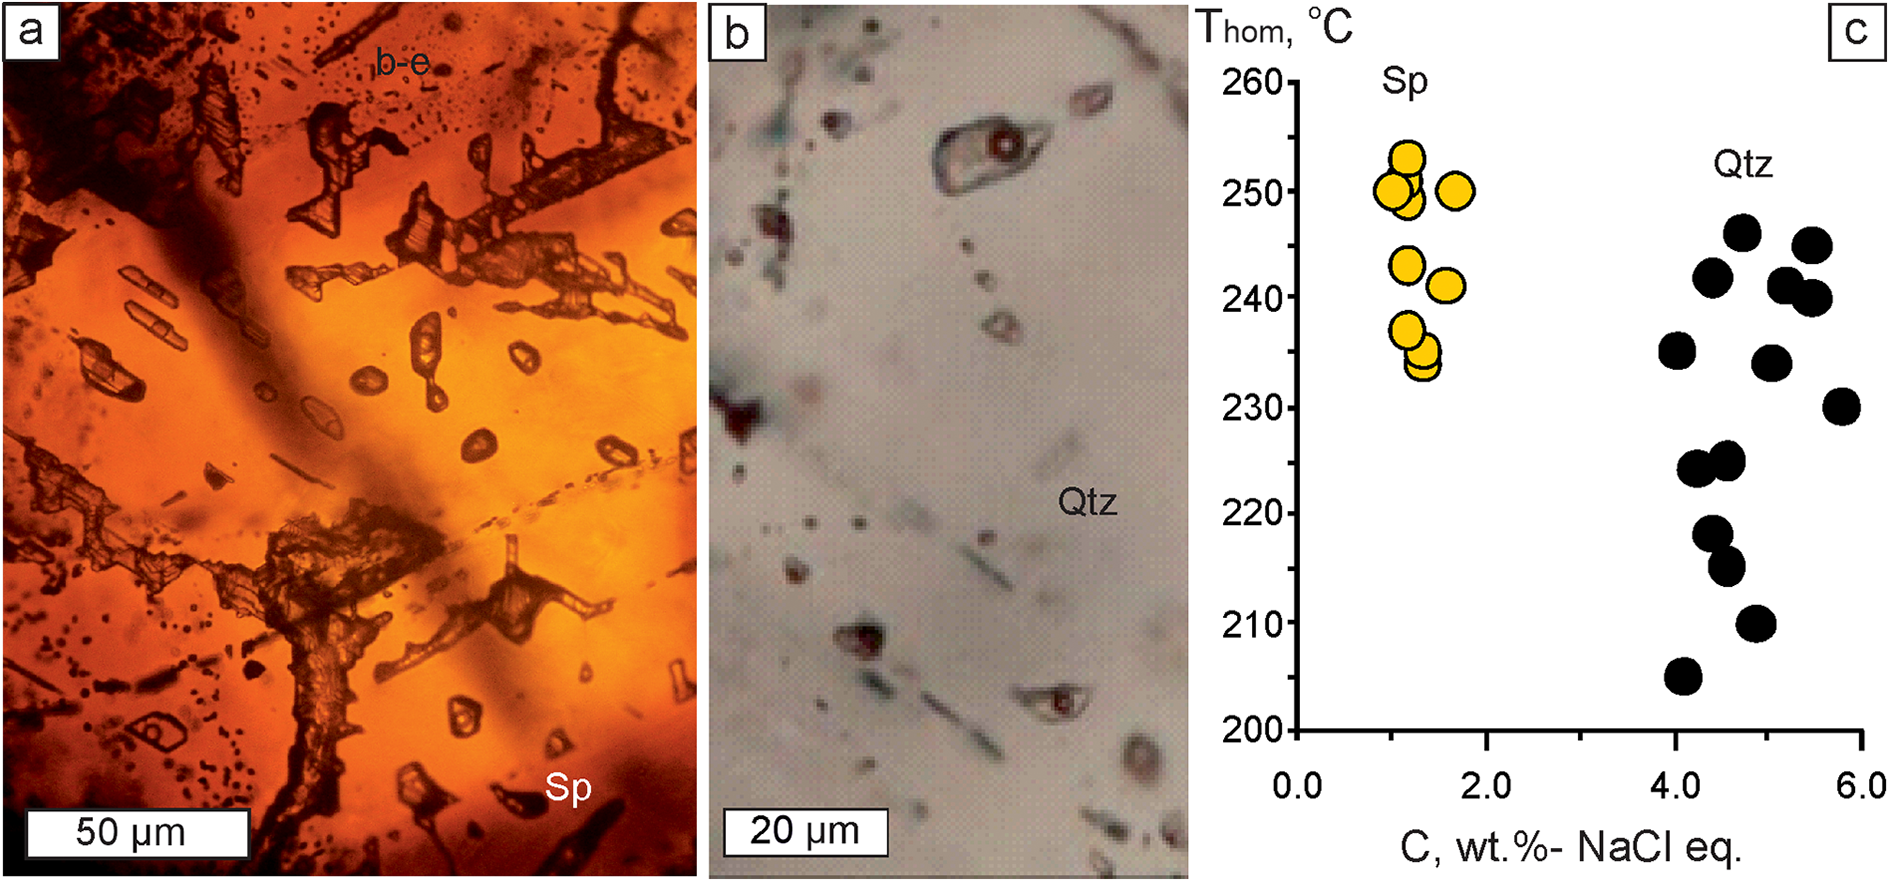
Fluid inclusions were observed in quartz-2 and in electrum-bearing sphalerite-1. In quartz, fluid inclusions are confined to central parts of crystals whereas in sphalerite they are scattered randomly. For microthermometric study we selected fluid inclusions closest to electrum. All fluid inclusions are considered to be primary according to the criteria proposed by Roedder (Reference Roedder1984). At room temperature all fluid inclusions have an oval shape and are up to 20 μm in size; they consist of aqueous liquid and vapour bubbles (ca. 20 vol.%). No daughter minerals or trapped solids were observed.
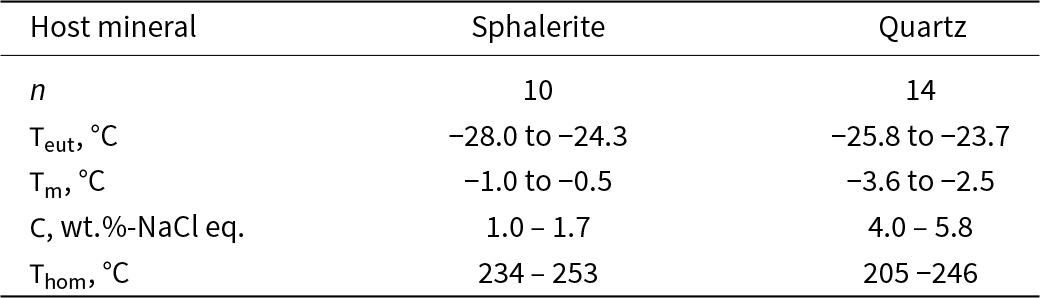
All the fluid inclusions studied homogenise into a liquid phase upon heating. The results of a microthermometric study are presented in Table 4 and Fig. 3. Fluid inclusions in quartz-2 show low salinities (4.0– 5.8 wt.% NaCl equiv.) and eutectic temperatures (Teut) of –23.7 to –25.8°C indicating that NaCl is dominant. They homogenise upon heating at 205 to 246°C. Fluid inclusions in sphalerite-1 are even more diluted (1.0–1.7 wt.% NaCl equiv.) and also are NaCl dominant (Teut makes up –24.3 to –28.0°C). Homogenisation temperature (Thom) of fluid inclusions in sphalerite ranges from 234 to 253°С.
Fluid inclusions in sphalerite-1 (a) and quartz-2 (b), transmitted light; (c) homogenisation temperature vs. salinity diagram for fluid inclusions in quartz and sphalerite.

Summary of fluid inclusions data for sphalerite and quartz

Notes: Teut – eutectic temperature; Thom – homogenisation temperature; Tm – melting temperature; C – salinity
No boiling or CO2 effervescence was documented, hence the estimates of Thom can be regarded as minimum trapping temperatures (Roedder, Reference Roedder1984). There is no reliable pressure estimate for the Ametistovoe deposit but taking into account its epithermal features the maximum depth of ore deposition did not exceed 1–1.5 km (Simmons et al., Reference Simmons, White and John2005 and references therein). i.e. the maximum pressure for a hydrostatic environment was ca. 100 bar. Pressure corrections for the homogenisation temperatures (Potter, Reference Potter1977) will, in this case, increase the temperature estimate by no more than 10–15°C, to between 220–260°C in quartz and to 245–270°С in sphalerite. Both pressure-corrected and non-corrected Thom intervals overlap with the temperature estimates obtained for chlorite (Table 3). A similar homogenisation temperature was also obtained for the gold–sulfide–chlorite quartz stage by Granovsky (Reference Granovsky1993).
X-ray computed microtomography
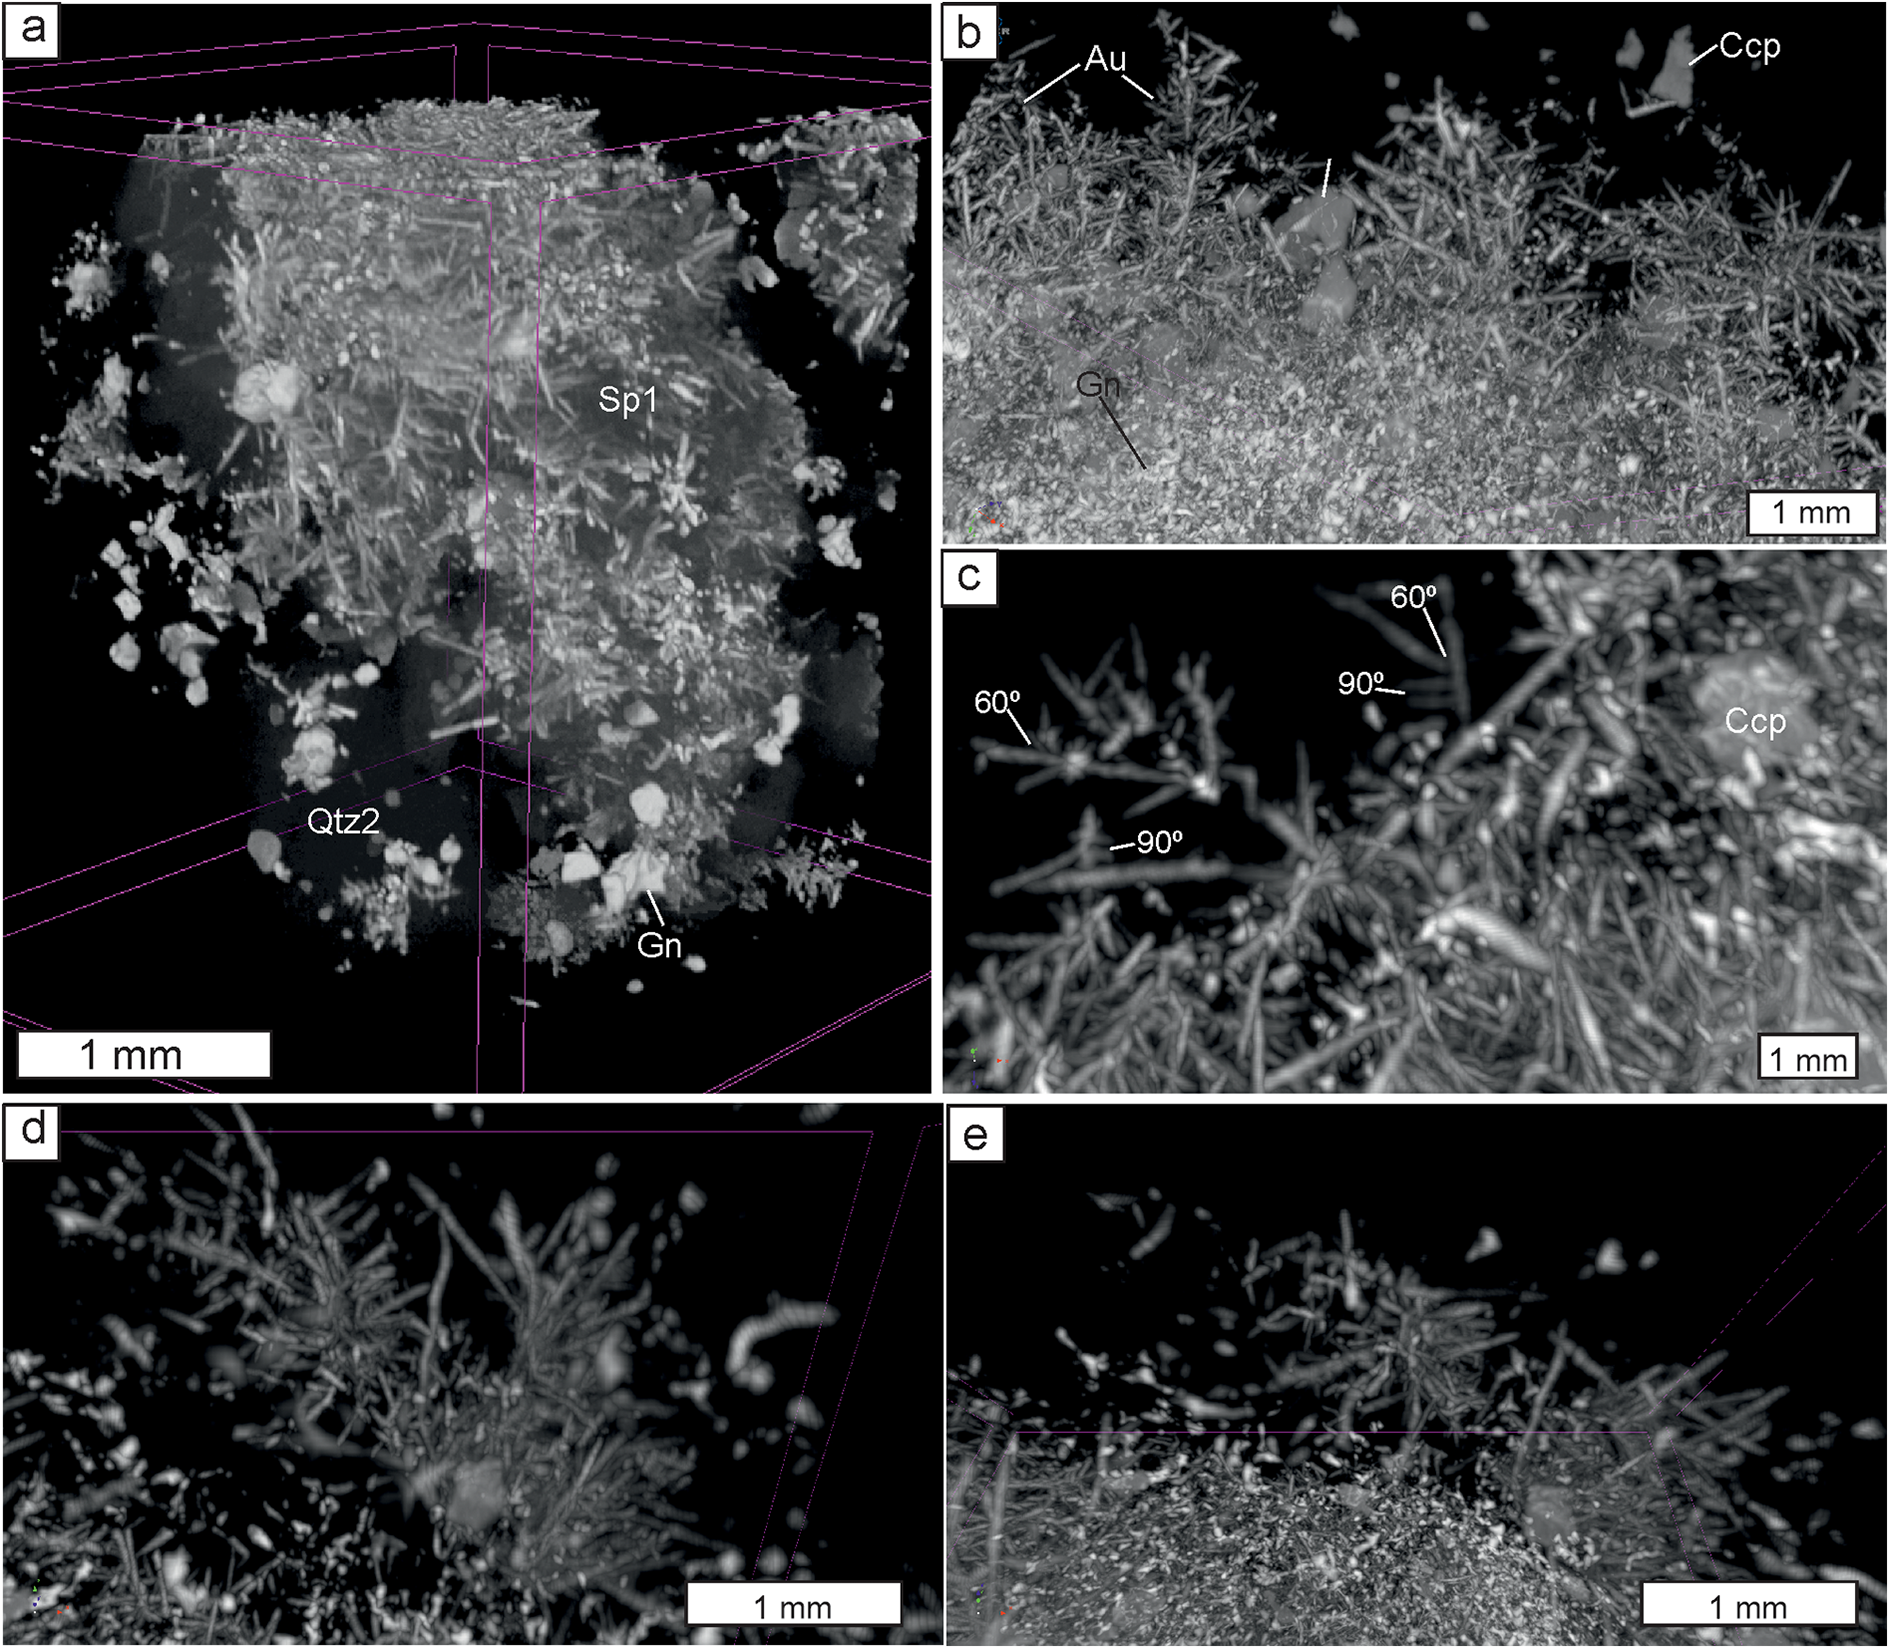
X-ray computed microtomography was carried out for four cylinders drilled from two polished sections. This confirmed the dendritic morphology of electrum within sphalerite (Fig. 4a,b). Electrum dendrites are distributed relatively homogenously and their size rarely exceeds 1 mm. They consist of a relatively long acicular ‘trunk’ and numerous ‘branches’ which are much shorter; ‘branches’ of the second order are rare and small. Most branches develop in one plane making 2-dimensional dendrites. Angles between the ‘trunk’ and ‘branches’ are usually 90° and, less commonly, 60° (Fig. 4c). In addition, single ‘bush-like’ dendrites were noted. These comprise several (usually three to five) ‘branches’ growing from one point (Fig. 4d,e). Though electrum particles are abundant in quartz and commonly form clusters they show no regular distribution and no dendrites were found within quartz.
X-ray computed tomography 3-dimensional images of 2 mm cylinders where the different grey levels represent the different minerals. General view (a) and fragments where quartz and sphalerite were reduced to liberate electrum dendrites (b to e). (b) several dendrites; (c) dendrites with angles between ‘trunk’ and ‘branches’ closed to 90° and 60°; (d and e) 3-dimensional ‘bush’, side (d) and top (e) views. Abbreviations as in Fig. 2.

Electron back-scattered diffraction (EBSD)
Electron back-scattered diffraction patterns were obtained for sites containing electrum and, where possible, maximum variability of hosting minerals, i.e. sphalerite, quartz, galena and sphalerite (Figs 5, 6 and 7).
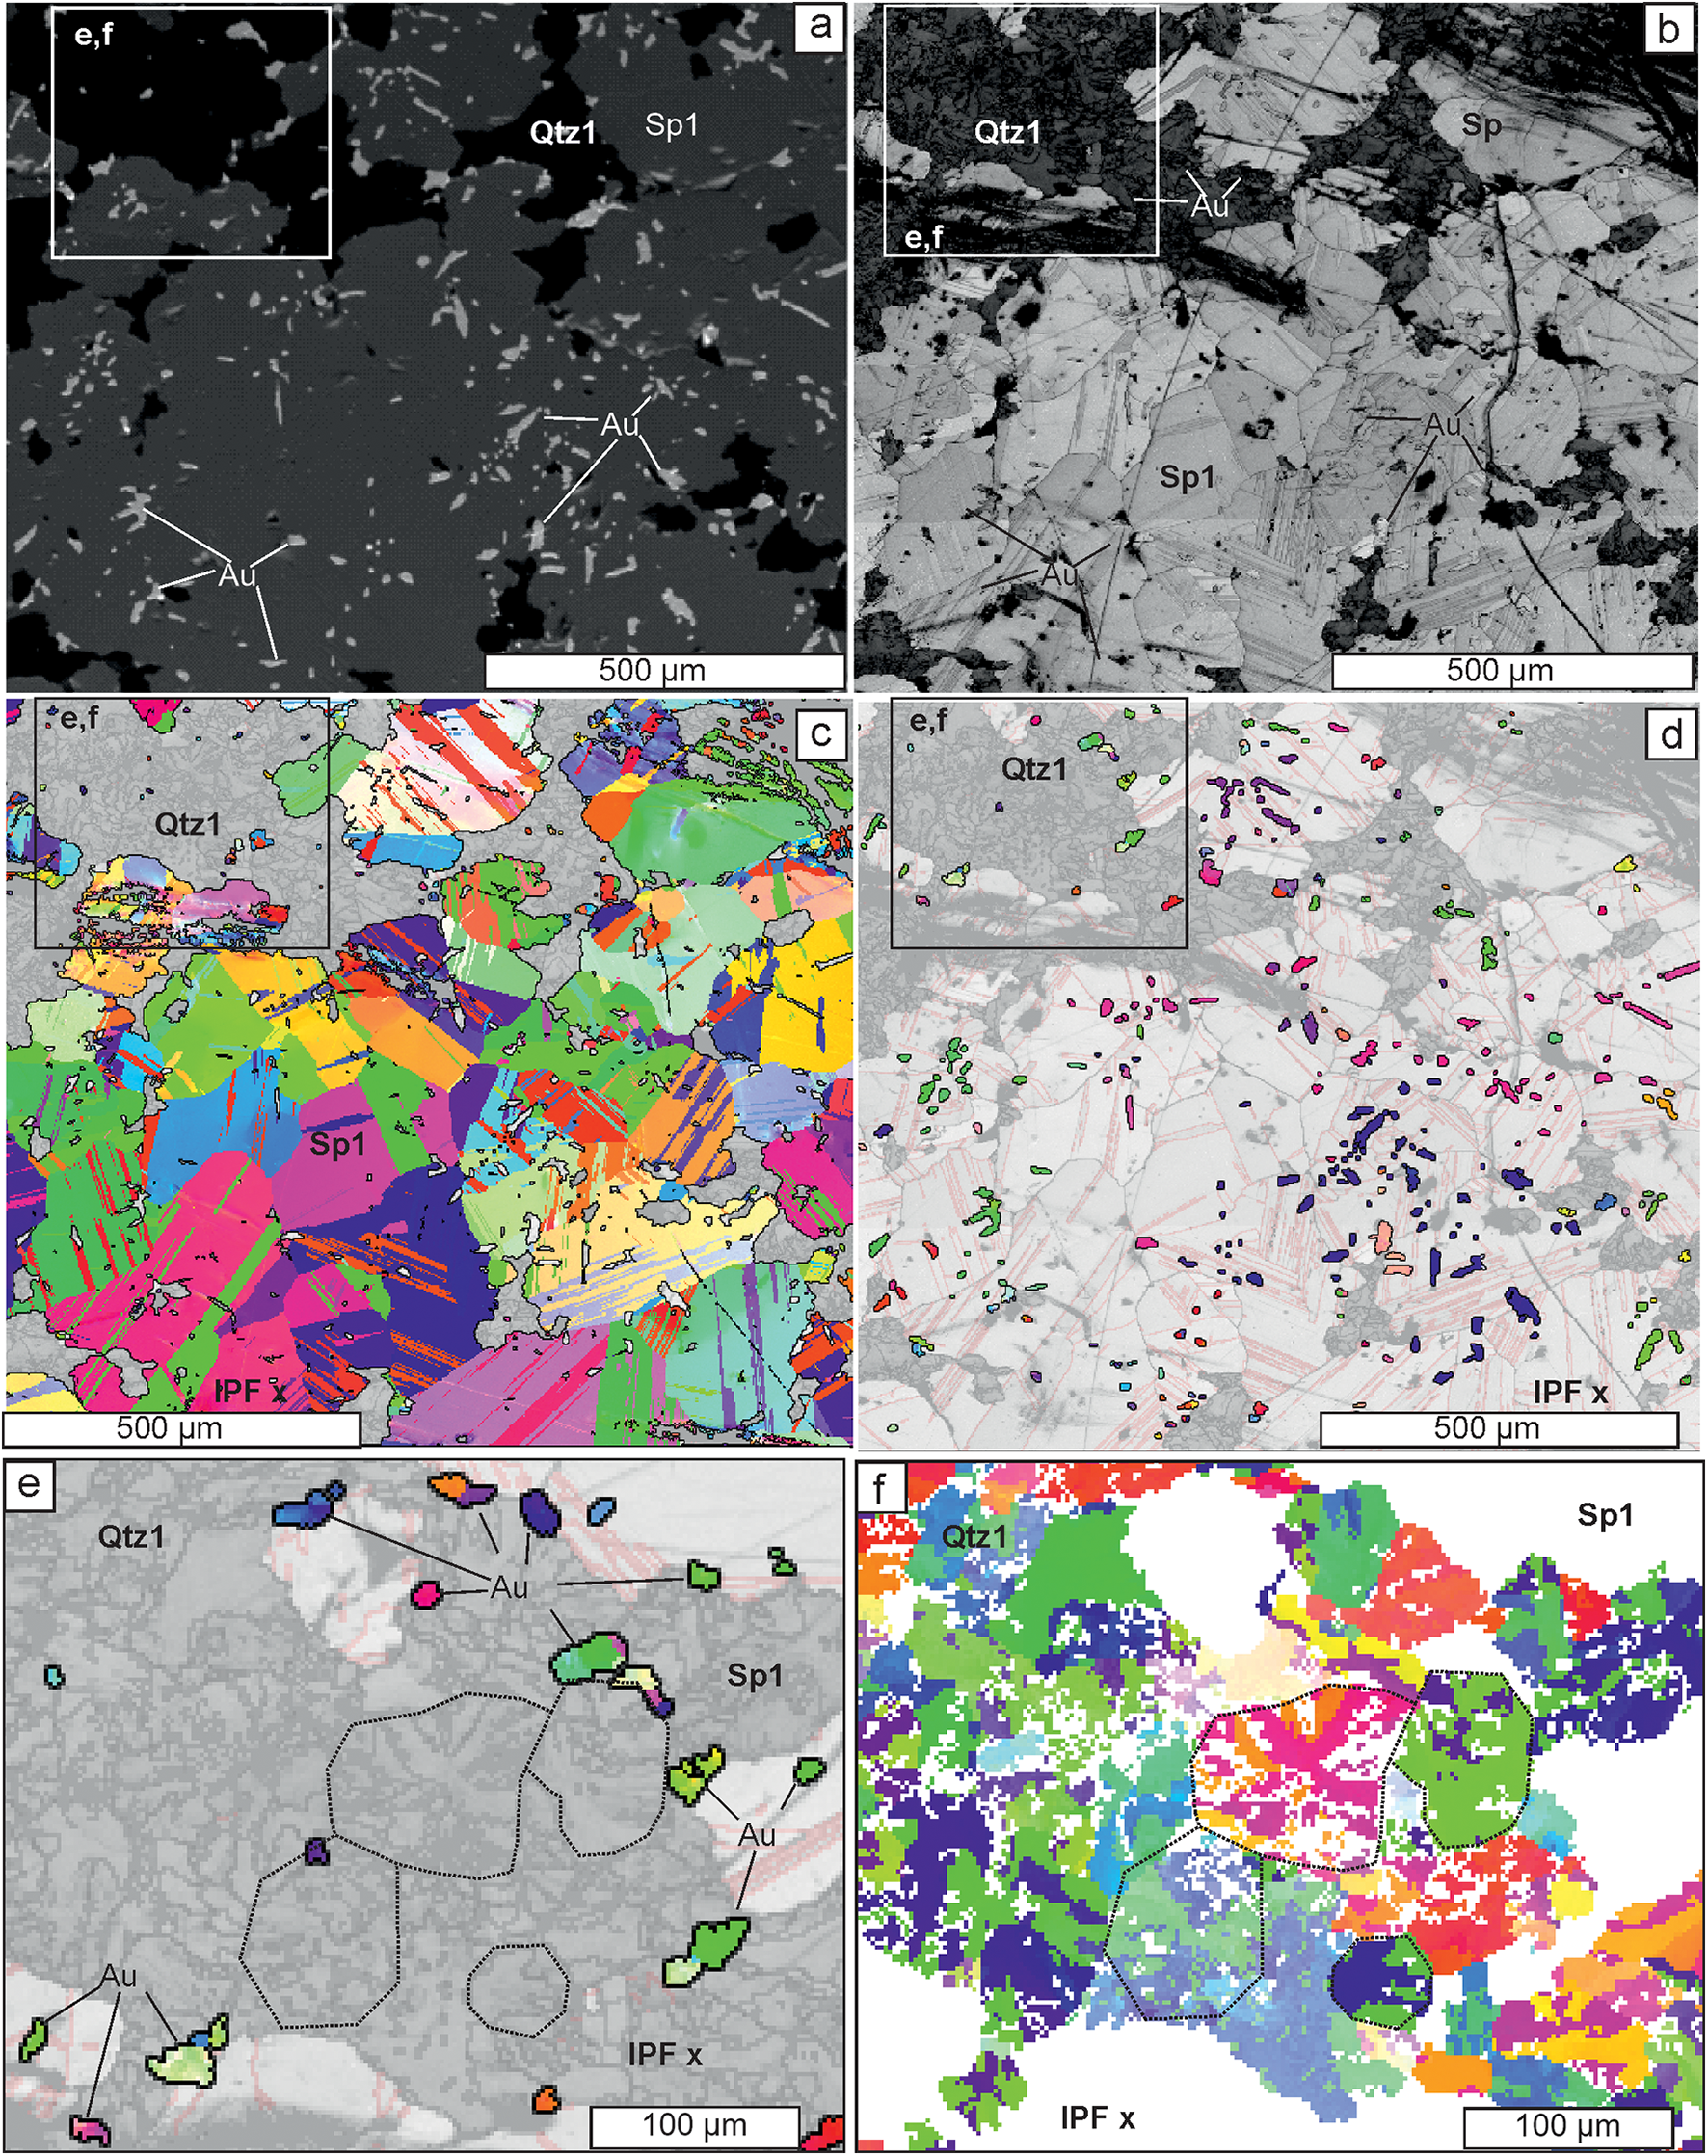
Back-scattered electron (BSE-SEI) and EBSD images for electrum intergrown with quartz-1 and sulfides. (a–d) Relationships between electrum, quartz-1 and sphalerite-1 in the same site (box shows the position of e and f): (a) BSE image showing oval electrum within sphalerite-1 and irregularly shaped electrum within quartz-1; (b) band contrast map (step 2 µm) showing lighter colour (i.e. higher crystallinity degree) for electrum within sphalerite-1 compared to electrum within quartz-1; (c) inverse pole figure, IPF(z), orientation maps for sphalerite-1 only, overlapped onto band contrast map, showing twinning in large anhedral sphalerite crystals; and (d) IPF(x) orientation map for electrum only, overlapped onto band contrast map, note each cluster with a unique colour corresponds to a separate dendrite within sphalerite. Images (e) and (f) highlight mineralogical details in the box in top left of (a–d): (e) shows the random orientation of electrum (‘Au’) and mosaic texture of quartz and electrum within it; and (f) is an IPF(x) figure for quartz showing mosaic texture and radial twinning, highlighted by the dotted lines. Abbreviations as in Fig. 2.

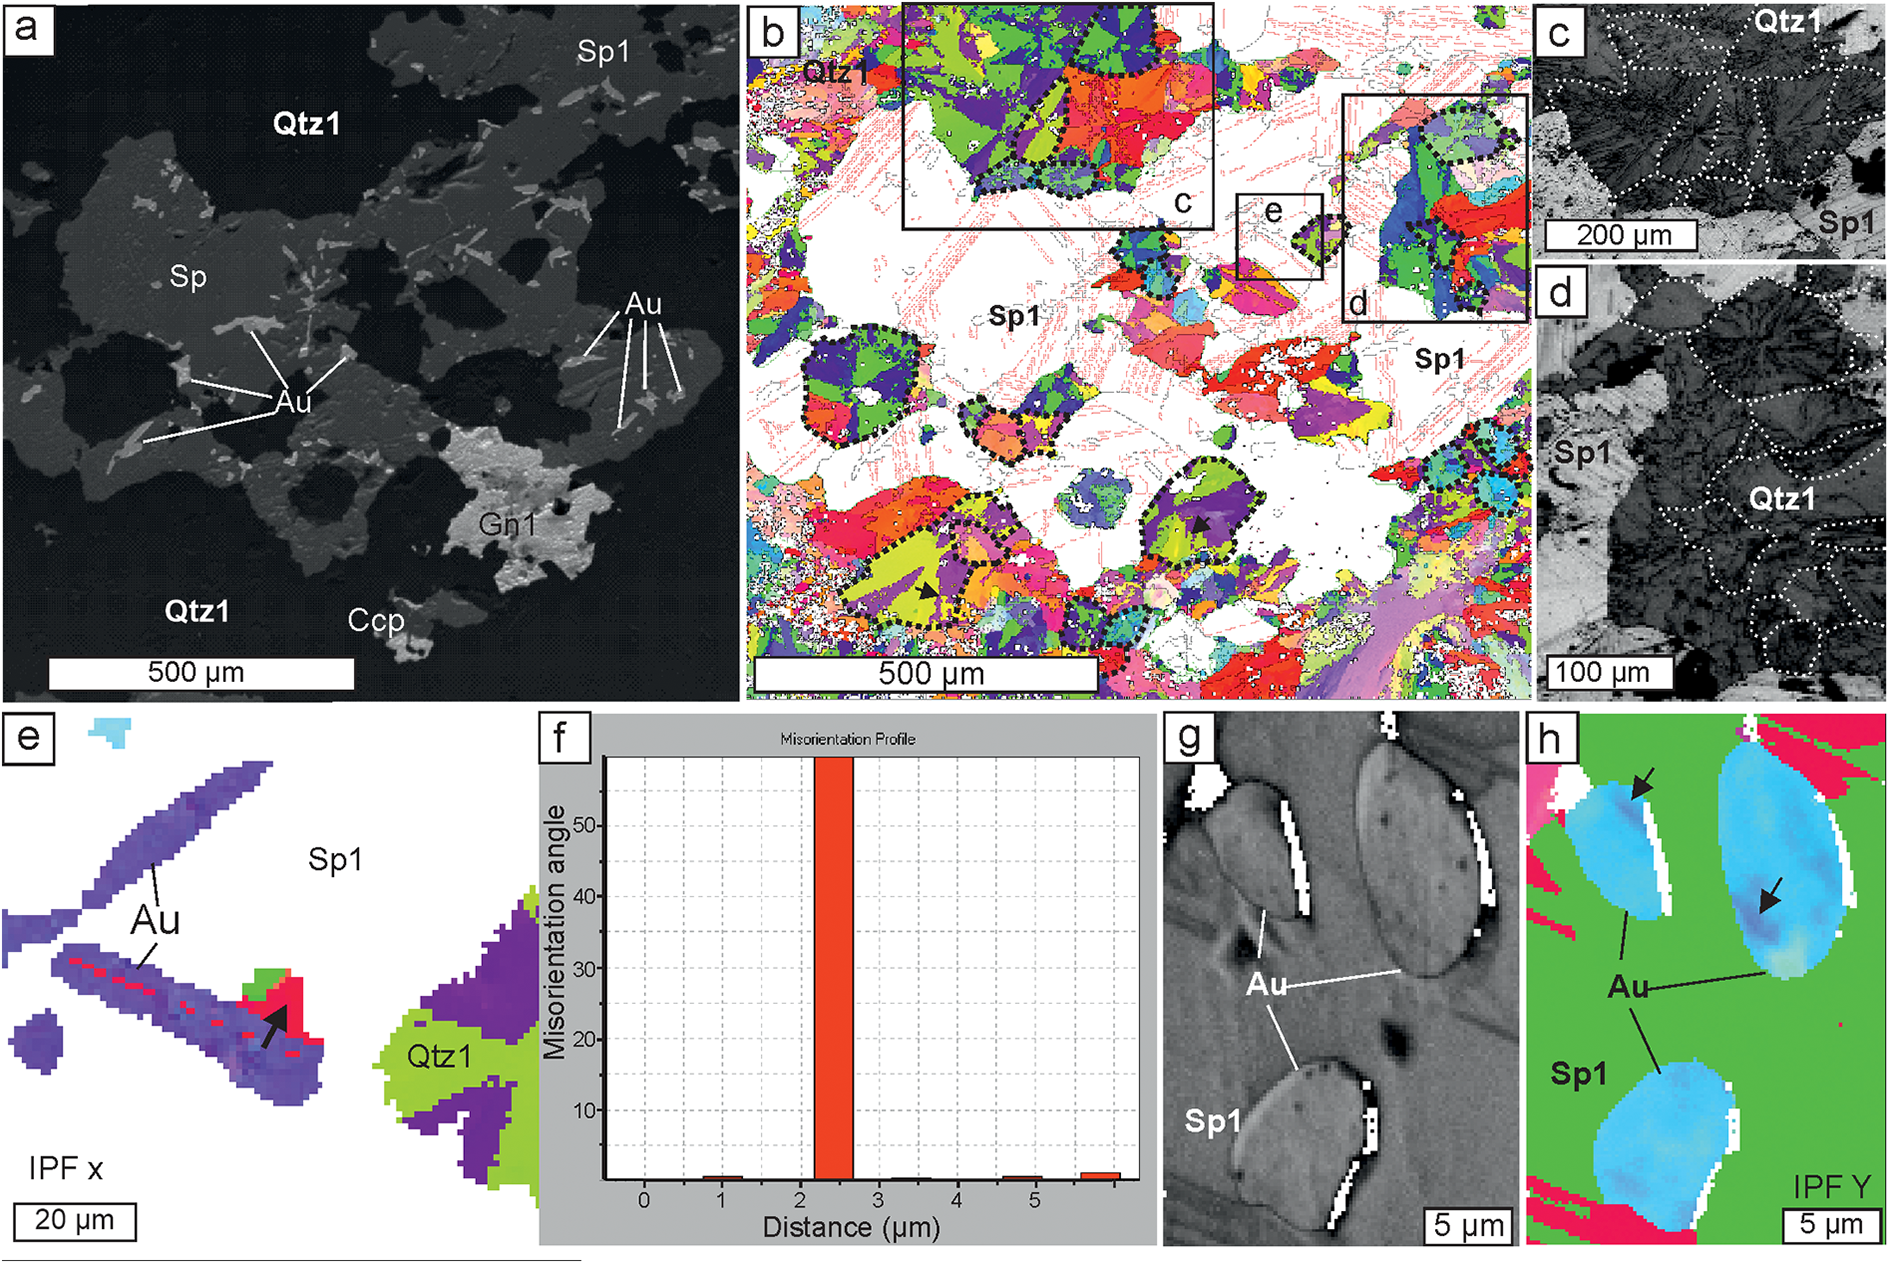
EBSD images for quartz intergrown with sulfides and electrum. (a) Back-scattered electron image of electrum, sphalerite-1, and galena-1 within quartz-1; and (b) IPFx orientation map for quartz (step 2 µm) of the same site, note spherical quartz-1 grains with radial twinning, highlighted by dotted lines, and jagged twin boundaries marked by arrows. The locations of (c), (d) and (e) are shown by boxes. (c and d) Band contrast images of the radial texture of quartz-1 grains in (b). (e) IPFx orientation map for electrum and quartz (step 1 µm) magnified section from (b); (f) misorientation profile along the board between ‘trunk’ and ‘branch’ (marked by an arrow on (e); (g and h) band contrast and IPFy orientation maps, respectively for electrum and sphalerite (step 0.1 µm), minor misorientation of electrum is marked by arrows. Abbreviations as in Fig. 2.

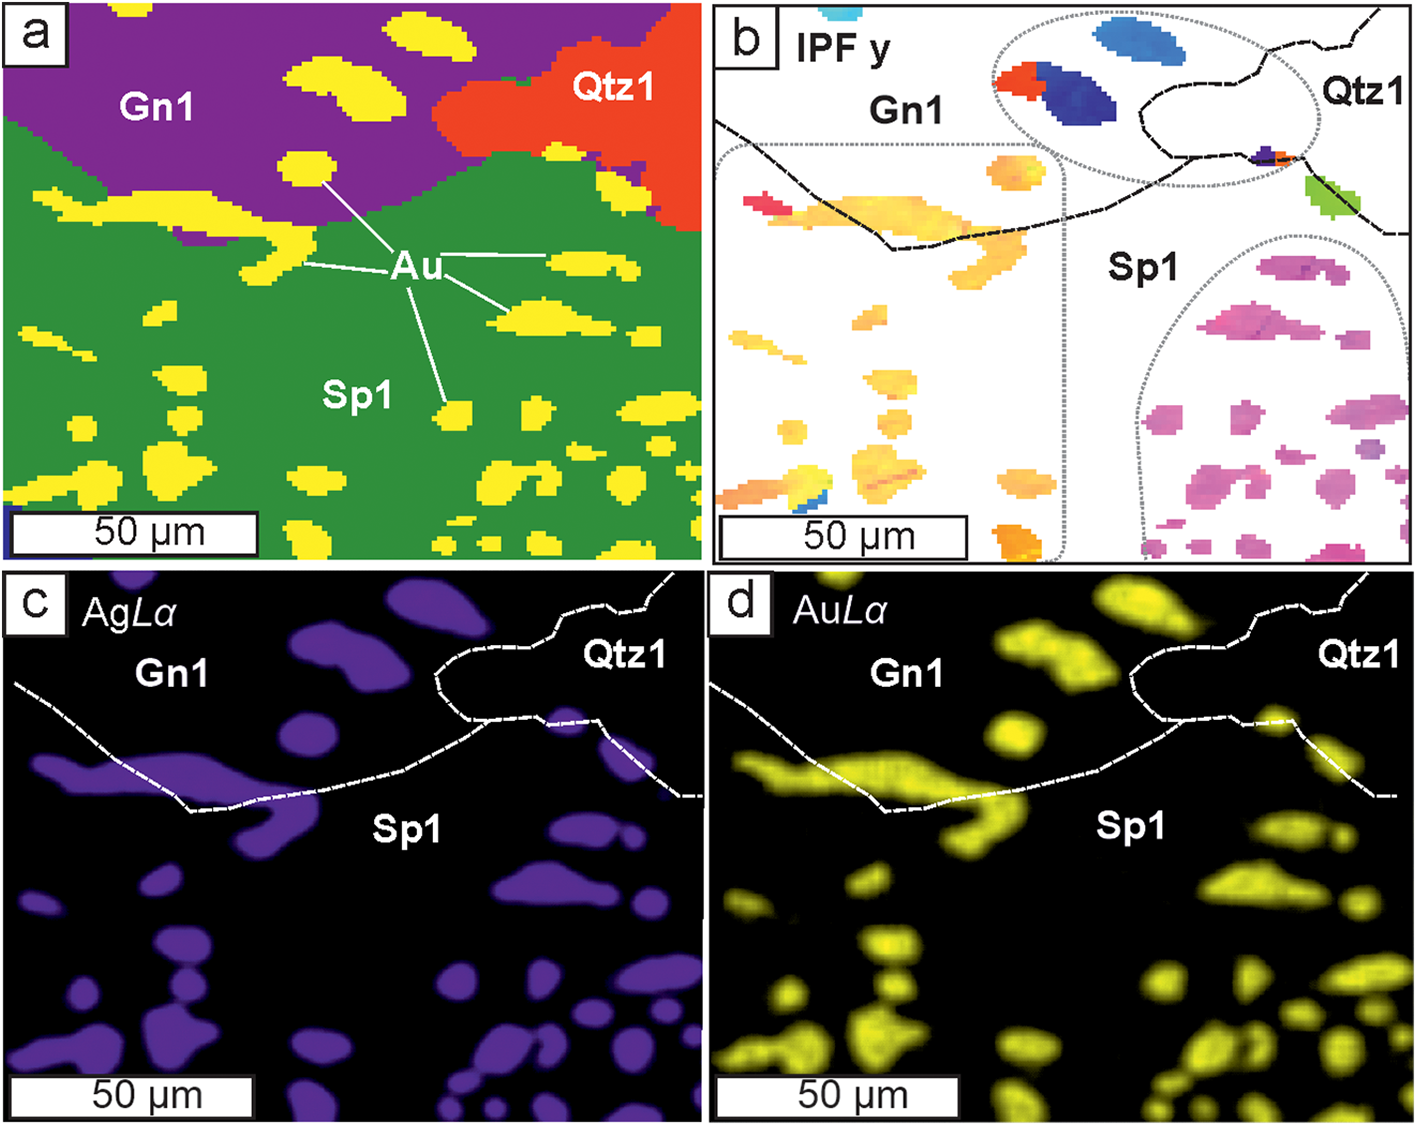
Relationships of electrum, sphalerite-1, galena-1, and quartz-1, step 1 µm: (a) phase map; (b) IPF(y) orientation map (step 1 µm) for electrum within sphalerite and galena, note that the same dendrite (yellow colour) is intergrown with sphalerite-1 and galena-1; (c and d) AgLα and AuLα X-ray maps – note composition of electrum does not vary either within the same cluster or from one cluster to another. Abbreviations as in Fig. 2.

Sulfides
Sphalerite-1 has a high EBSD pattern quality (Fig. 5a,b) and consists of large randomly orientated grains with polysynthetic twinning (Fig. 5c). Galena-1 and chalcopyrite-1 also form well crystallised randomly orientated grains (ESM 3).
Quartz
Quartz-1, which hosts electrum particles and is intergrown with electrum-bearing sphalerite, has a globular morphology (Figs 5d–f, 6b–d), forming globules of 50 to 200 µm in diameter. In band contrast images these globules establish either a microcrystalline jigsaw texture (Fig. 5e,f) or radial fibres (Fig.6c,d). Both varieties of the globules coexist (Figs 5f and 6d,e) which suggests that globules with a jigsaw texture are upper sections of radial globules. On IPF maps (Figs 5f and 6b,e) most of the quartz globules have a radial twinning structure with three segments with one crystallographic orientation and the other three with another; the orientation angle between twins is 60°. Twin boundaries are sometimes straight but typically jagged (Fig. 6b, marked by arrows).
Electrum
Electrum particles located in quartz or on quartz/sphalerite boundaries show low quality EBSD patterns (Fig. 5b) and are randomly orientated, as can be seen on IPF maps (Fig. 5d,e). Electrum within sphalerite, in contrast, has a much higher EBSD pattern quality, i.e. it contains fewer lattice defects than those in quartz. On IPF maps (Fig. 5d,g) it forms clusters where several (between 3–12) grains have the same colour, i.e. have the same crystallographic orientation. Each such cluster corresponds to a dendrite where ‘branches’ grow on the ‘trunk’ at the right angles, i.e. self-epitaxy on the (100) plane. It is notable that one dendrite (group of electrum grains with the same orientation) can grow within both sphalerite and galena (Fig. 7). Rarely a misorientation angle of 60° between ‘branch’ and ‘trunk’ was noted (Fig. 6e,f) suggesting self-epitaxy on the (111) plane. Occasionally additional minor misorientation within electrum grains can be observed (Fig. 6g,h).
Discussion
It was noted endogenic electrum and native gold dendrites are found mainly in ores of low-sulfidation epithermal Au–Ag deposits (Petrovskaya, Reference Petrovskaya1973; Saunders and Burke, Reference Saunders and Burke2017; Tharalson et al., Reference Tharalson, Taksavasu, Monecke, Reynolds, Kelly, Pfaff, Bell and Sherlock2023 and references therein). Most authors link their formation with rapid crystallisation (Lindgren, Reference Lindgren1915; Ramdohr, Reference Ramdohr1969 etc.) which is common in a near-surface epithermal environment. Usually gold dendrites occur within chalcedony-like silica; sometimes dendrites of tellurides, selenides and sulfides were also described (Tharalson et al., Reference Tharalson, Taksavasu, Monecke, Reynolds, Kelly, Pfaff, Bell and Sherlock2023 and references therein). Gold or electrum dendrites within sphalerite and other sulfide minerals have not been documented previously.
Morphology of electrum dendrites
Petrovskaya (Reference Petrovskaya1973) reviewed gold dendrites from several deposits worldwide and noted most dendrites have a relatively long acicular ‘trunk’ and much shorter ‘branches’. ‘Branches’ may form 90 and 60 angles with the ‘trunk’ overgrowing on (100) or (111) planes, respectively. Petrovskaya also noted 3-dimensional (3-D) dendrites with branches growing in three mutually perpendicular directions and 2-dimensional (2-D) dendrites which generally coexisted, though 2-D ones (or planar dendrites) dominate in nature. 1-D crystals with poorly developed or non-developed ‘branches’ are also common. Saunders and Burke (Reference Saunders and Burke2017) described planar dendritic crystals of native silver with a reticulate shape (90 angles between trunk and branches) which were encrusted by irregular ‘fractal’ 3-D dendrites. These authors supposed the ‘reticulate’ dendrites were formed from solutions by direct rapid chemical precipitation whereas ‘fractal’ dendrites were formed by the random aggregation of gold nanoparticles. Synthetic dendrites (Yuan et al, Reference Yuan, Andrews and Marlow2004; Bauer et al., Reference Bauer, Mougin, Faye, Buch, Ponthiaux and Vignal2020 and references therein) show even more variable morphology and Bauer et al. (Reference Bauer, Mougin, Faye, Buch, Ponthiaux and Vignal2020) were able to synthesis five-pointed star structures. However, trunks with branches with (100) and/or (111) epitaxy are also most common. These observations are in a good agreement with features described in the present study (Fig. 4).
Composition of electrum
The obtained microprobe data establish the very homogeneous composition of electrum dendrites (fineness is mostly 600–620). Low fineness is rather typical for hypogene dendritic native gold, e.g. Petrovskaya (Reference Petrovskaya1973) noted Ag contents in dendrites higher than 25 wt.% (i.e. fineness less than 750). Tharalson et al. (Reference Tharalson, Taksavasu, Monecke, Reynolds, Kelly, Pfaff, Bell and Sherlock2023) published a wider range of 428 to 963 for dendrites from four low sulfidation epithermal deposits from California and Nevada but most values fit within 540–780. However, native gold from epithermal deposits worldwide is featured by grain-scale, sample-scale, and deposit-scale variations in composition, regardless of its morphology (Petrovskaya, Reference Petrovskaya1973; Morrison et al., Reference Morrison, Rose and Jaireth1991; Liu and Beaudoin, Reference Liu and Beaudoin2021; Tharalson et al., Reference Tharalson, Taksavasu, Monecke, Reynolds, Kelly, Pfaff, Bell and Sherlock2023). Thus, the observed compositional homogeneity of electrum dendrites from the Ametistovoe deposit is apparently anomalous and merits additional explanation.
Electrum, sphalerite and quartz formation conditions
Electrum
The composition of Au–Ag alloy is known to be sensitive to physico-chemical conditions, i.e. temperature, pH, oxygen and sulfur fugacity (Barton and Toulmin, Reference Barton and Toulmin1964; Shikazono, Reference Shikazono1985; Pal’yanova, Reference Pal’yanova2008; Liang and Hoshino, Reference Liang and Hoshino2015). Rapid changes of any of these parameters due to boiling, cooling or fluids mixing, etc. would result in variability in the electrum composition. However, colloidal gold (and silver) particles formed in different parts of the vein and then transported by the ascending fluid would also be variable in composition in addition to the subsequently deposited dendrites or other electrum morphologies. For example, Novgorodova (Reference Novgorodova2005) describes variations in Ag contents up to 20 wt.% within blocks of metacolloidal (i.e. recrystallised colloidal) native gold from the Baley epithermal deposit. Petrovskaya et al. (Reference Petrovskaya, Novgorodova, Frolova and Tsepin1977) revealed via etching a mosaic texture in dendrites from several epithermal deposits and concluded it was typical for native gold deposited from colloids in an epithermal environment. Burke et al. (Reference Burke, Rakovan and Krekeler2017) observed gold nanoparticles using transmitted electron microscopy in dendrites from the Round Mountain deposit. This suggests dendrites formed from gold nanoparticles are common in nature and that colloidal transport of gold is possible.
However, dendrites from the Ametistovoe deposit show no evidence of a mosaic texture and are compositionally homogeneous. Band contrast maps show a high crystallisation degree and no grain boundaries within electrum grains (Fig. 6g), IPF maps show only rare twinning and sometimes insignificant misorientation (Fig. 6h); this being evidence that the dendrites are single crystals. Electrum in quartz, in contrast, commonly has a mosaic texture (Fig. 5e), comprising chaotically orientated crystals of lower quality. The homogeneous composition of electrum observed on a sample-scale and grain-scale (dendrite-scale) for the Ametistovoe deposit implies all electrum in the studied sample, confined to both quartz and sphalerite, was precipitated under the same PTX conditions. This suggests either rapid crystallisation of all electrum in the sample or its growth in an environment isolated from any external factors. It appears that the PTX conditions were the same for both electrum within sphalerite and within quartz. This indicates gold and silver at the Ametistovoe deposit are possibly transported in solution rather than as colloids nucleated in different parts of a vein under different PTX conditions.
Sphalerite
Sphalerite, together with galena, forms relatively large crystals and, unlike electrum, exhibits variability in composition (FeS 5.8–8.8 mol.%) which can be interpreted as growth zoning. Such variability can be reflected by changes of S fugacity and/or temperature (Scott, Reference Scott1983). These parameters would also be evident in the composition of electrum if it were co-precipitated with sphalerite. This suggests sphalerite and galena were deposited later than electrum and overgrew it. The chaotic orientation of sphalerite and galena crystals in relation to the electrum dendrites (Fig. 5c,d) confirms this suggestion. The presence of primary fluid inclusions of low salinity is further evidence for a hydrothermal origin of sphalerite. Depositional temperature was ca. 245–270°С.
Quartz
Quartz globules with radial or jigsaw texture similar to those observed in the present study (Figs 5f and 6b-e) and are common in low sulfidation epithermal deposits worldwide (Dong et al., Reference Dong, Morrison and Jaireth1995; Taksavasu et al., Reference Taksavasu, Monecke and Reynolds2018; Zeeck et al., Reference Zeeck, Monecke, Reynolds, Tharalson, Pfaff, Kelly and Hennigh2021 and references therein), siliceous sinters of hot springs (Jones, Reference Jones2021 and references therein), in geothermal power plants (Van den Heuvel et al., Reference Van den Heuvel, Gunnlaugsson, Gunnarsson, Stawski, Peacock and Benning2018) and even in mesothermal ores (Herrington and Wilkinson, Reference Herrington and Wilkinson1993). Such globules are usually interpreted as recrystallisation of amorphous silica. Dong et al. (Reference Dong, Morrison and Jaireth1995) traced a chain of solidification and crystallisation events from amorphous silica gel via flamboyant radial spheres to ‘ghost spheres’ up to 300 μm in size. Zeeck et al. (Reference Zeeck, Monecke, Reynolds, Tharalson, Pfaff, Kelly and Hennigh2021) studying epithermal ores in the Omu camp (Japan) noted non-crystalline silica which co-precipitated with gold and silver minerals. This observation is in agreement with experimental data of McNab et al. (Reference McNab, Brugger, Voisey and Tomkins2024) who conducted hydrothermal experimental simulation of coprecipitation of amorphous silica and gold nanoparticles and traced their subsequent recrystallisation from amorphous silica via microspherules tens of micrometres in size to coarse crystalline quartz accompanied by the relocation of gold particles to quartz grain boundaries.
Radial flamboyant extinction is sometimes documented in epithermal ores (Dong et al., Reference Dong, Morrison and Jaireth1995), but radial twinning has not been revealed, perhaps because EBSD studies have been seldom applied to epithermal quartz textures. However, in agates Götze et al. (Reference Götze, Berek and Schäfer2019) reported microspherules composed of radially orientated quartz micro-crystals, established by IPF maps and proposed these were formed around a nucleus within amorphous silica gel via spiral growth. Such a model explains the formation of twins with jagged boundaries.
Subsequent idiomorphic quartz-2 overgrowing sphalerite and quartz-3 coexisting with chlorite could precipitate from solution, as corroborated by primary fluid inclusions at temperatures of ca. 220–260°C.
Model of electrum dendrites formation
Models proposed to explain the formation of electrum dendrites in an epithermal environment have been recently reviewed by Tharalson et al. (Reference Tharalson, Taksavasu, Monecke, Reynolds, Kelly, Pfaff, Bell and Sherlock2023). The colloidal transport of silica forming colloform bands is not argued, however for gold dendrites and their relations to silica; the opinions are ambiguous. Saunders (Reference Saunders1990) proposed that electrum dendrites grew from colloids (gold nanoparticles) which were nucleated in a deeper part of the hydrothermal system and were transported by the ascending fluid to the deposition site. This model, however, cannot be applied to the Ametistovoe deposit for the reasons discussed above.
One could also suggest the decomposition of early sphalerite with high contents of Au and Ag to sphalerite intergrown with electrum dendrites. However maximum solubility of Au (ca. 1 wt.%) was described in high-indium sphalerite which was synthesised at 800°C (Tonkacheev et al., Reference Tonkacheev, Chareev, Abramova, Kovalchuk, Vikentyev and Tagirov2019; Filimonova et al., Reference Filimonova, Trigub, Tonkacheev, Nickolsky, Kvashnina, Chareev, Chaplygin, Lafuerza and Tagirov2019). Such a high temperature is unrealistic for an epithermal environment but if it were not, 1 wt.% of Au would not be enough to form electrum particles to occupy several percent of a sphalerite grain (Figs 5d, 6, 7a). In natural sphalerite the Au content does not exceed several ppm (Cook et al., Reference Cook, Ciobanu, Pring, Skinner, Shimizu, Danyushevsky, Saini-Eidukat and Melcher2009; Tauson and Lipko, Reference Tauson and Lipko2020 and references therein). Thus the decomposition of a gold-bearing sphalerite is not an appropriate mechanism for the formation of the observed patterns.
Numerous experiments of synthesis of single-crystal gold dendrites have proved that the presence of various polymers is crucial in the formation of dendritic gold. Without polymers only an agglomerate of gold nanoparticles have been obtained (Han et al., Reference Han, Wang, Huang, Liu and You2011; Lin et al., Reference Lin, Lin, Liu, Sheu and Hung2011; Huang et al., Reference Huang, Qi, Bai, Shi, Jia, Zhang and Zheng2012 and references therein). The mechanism observed included formation of gold nanoparticles which served as growth centres of the dendrites (Han et al., Reference Han, Wang, Huang, Liu and You2011; Huang et al., Reference Huang, Qi, Bai, Shi, Jia, Zhang and Zheng2012). The role of polymers is to stabilise gold nanoparticles and to prevent their rapid dissolution (Huang et al., Reference Huang, Qi, Bai, Shi, Jia, Zhang and Zheng2012). Another important feature of polymers is their selective absorption on gold crystal faces. For example cysteine (HO2CCH(NH2)CH2SH) molecules are selectively adsorbed on (100), (110) and other crystal faces but not on the (111) face. This blocks the growth of all faces except of (111) and results in formation of single-crystal dendrites (Lin et al., Reference Lin, Lin, Liu, Sheu and Hung2011).
A similar scenario might be proposed for natural electrum crystalline dendrites. Silica gel, being polymerised, also can be selectively adsorbed by different crystal faces and triggers dendrite growth in one direction. Recently Monecke et al. (Reference Monecke, Reynolds, Taksavasu, Tharalson, Zeeck, Guzman, Gissler and Sherlock2023) suggested that electrum dendrites can grow within a previously formed gel-like silica band. Such gel-like silica could deposit earlier however being permeable, it allows the diffusion of dissolved Au through the gel from the fluid flowing across the silica layer. This model implies Au is transported in solution (Monecke et al., Reference Monecke, Reynolds, Taksavasu, Tharalson, Zeeck, Guzman, Gissler and Sherlock2023; Tharalson et al., Reference Tharalson, Taksavasu, Monecke, Reynolds, Kelly, Pfaff, Bell and Sherlock2023), however the formation of gold nanoparticles and the existence of colloidal gold at some stages cannot be ruled out. Dendrites covered by a silica gel can develop single crystals and, moreover silica gel may maintain more or less stable PTX conditions to form crystals with relatively constant composition. This statement, however, is equivocal because some experimental studies reported stirring as a critical factor for growth of single-crystal dendrites (Han et al., Reference Han, Wang, Huang, Liu and You2011), whereas others obtained similar dendrites without stirring (Bauer et al., Reference Bauer, Mougin, Faye, Buch, Ponthiaux and Vignal2020). Another important role of a silica gel is that it protects growing dendrites from dissolution or mechanical damage.
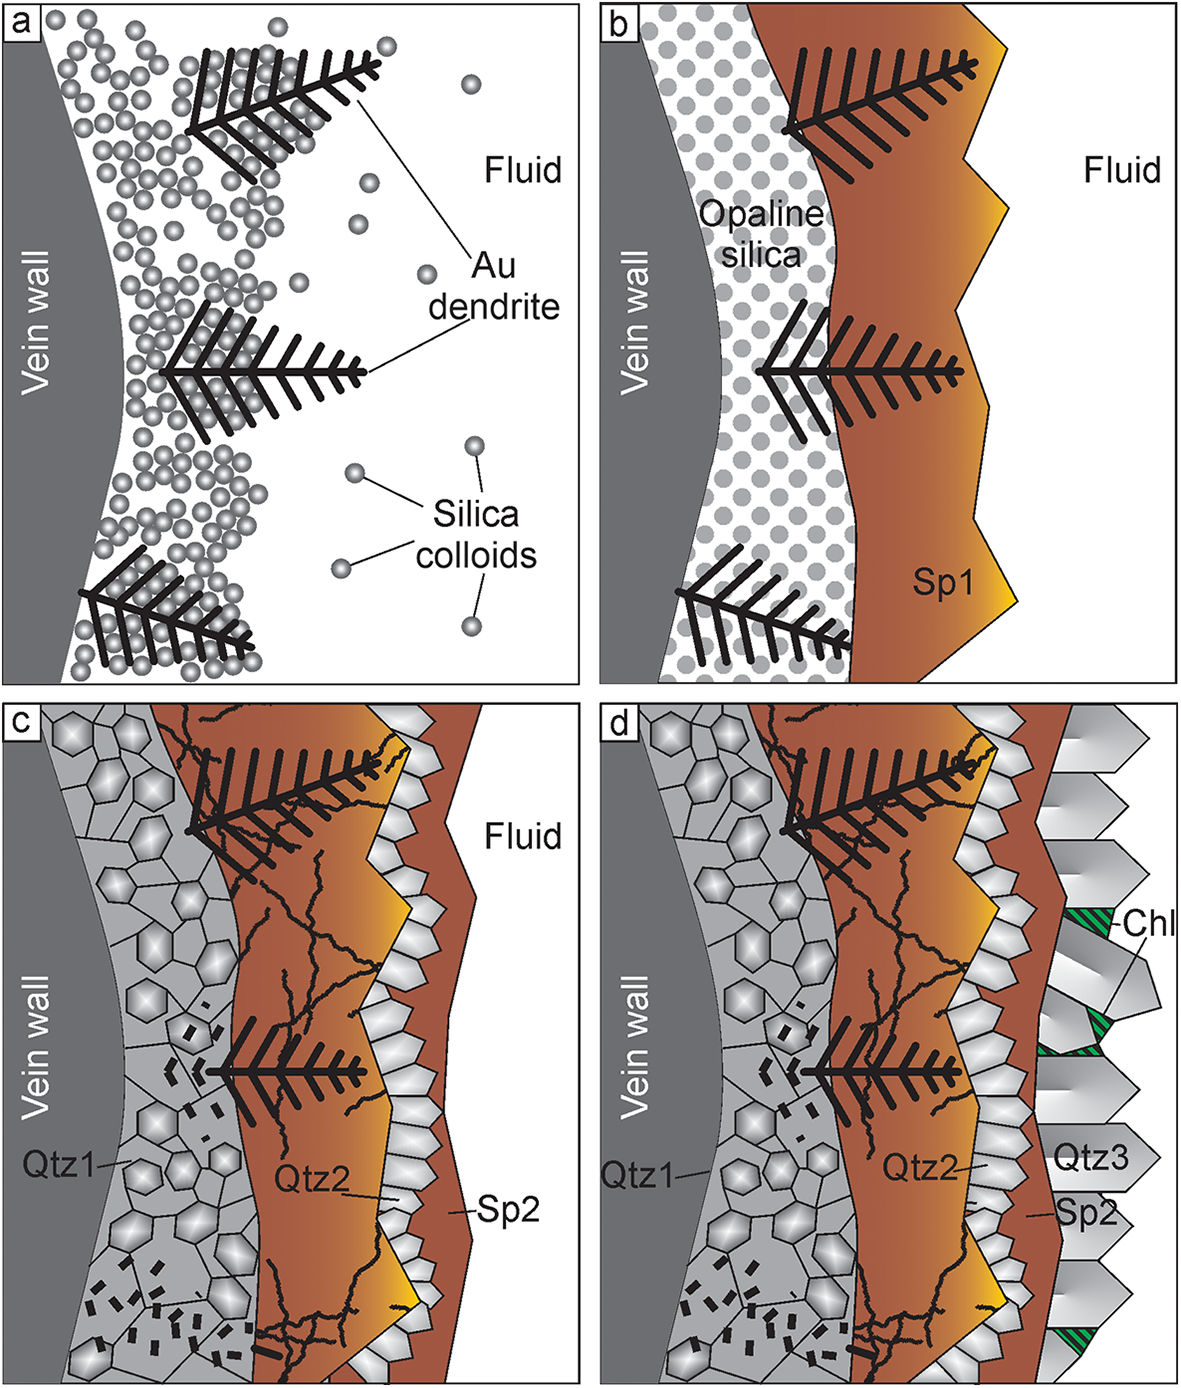
In the case of the Ametistovoe deposit, electrum dendrites might grow within silica gel (Fig. 8a) either contemporaneously with, or immediately after, the deposition of silica gel. Subsequently silica gel could be either partly removed by new flows of a fluid or partly solidified and, thus, reduced in volume resulting in dendrites being left partly in the open space. Later, dendrites in open space were overgrown by sphalerite-1 and minor chalcopyrite-1, galena-1 (Fig. 8b). The fluid inclusions in dendrite-bearing sphalerite show that most elements at this stage were transported in solution. Depositional temperature was ca. 245–270°С. At the same time, or, perhaps, slightly later, opaline silica recrystallised to microcrystalline globular quartz which resulted in the destruction of electrum dendrites located within silica (Fig. 8c). This explains the mosaic texture observed in electrum from quartz, while at the same time the composition of electrum remained unchanged. Deposition of sphalerite-1 was followed by the formation of druse-like quartz, followed by pyrite, sphalerite-2, galena-2 and chalcopyrite-2. (Fig. 8c). Idiomorphic quartz-2 crystals and chlorite postdated the deposition of sulfides (Fig. 8d) at temperatures of ∼220–260°C. This model explains the absence of electrum dendrites within quartz and the presence of irregularly shaped electrum with the same composition and low pattern quality within quartz. Electrum dendrites overgrown by sphalerite and other sulfides ‘survived’ and preserved their morphology and single-crystal features.
Proposed model for electrum dendrite growth and maturation in the Ametistovoe deposit. Modified from Monecke et al. (Reference Monecke, Reynolds, Taksavasu, Tharalson, Zeeck, Guzman, Gissler and Sherlock2023) and Tharalson et al. (Reference Tharalson, Taksavasu, Monecke, Reynolds, Kelly, Pfaff, Bell and Sherlock2023). (a) Electrum dendrites grow contemporaneously with, or immediately after, the deposition of the silica host along the vein wall, silica is transported in colloids while Au and Ag can be transported in solution, dendrites grow both within silica gel and in open space; (b) dendrites are overgrown by sphalerite-1 and minor galena, pyrite and chalcopyrite-1, and, later by sphalerite-2; (c) crystallisation of silica results in destruction of electrum dendrites; this process might have started immediately after silica deposition and lasted during deposition of sulfides, formation of crystalline quartz followed by pyrite, sphalerite 2, chalcopyrite 2, galena-2 which overgrow quartz and sphalerite-1 and fill cracks in sphalerite; (d) deposition of quartz crystals and chlorite.

Conclusions
In contrast to most natural dendrites which are composed of nanoparticles, electrum dendrites from ores of the Ametistovoe Au–Ag epithermal deposit are proven to be single crystals. They are compositionally homogeneous with a fineness of ca. 600–620.
The dendrites in most cases are 2-dimensional, rarely 3-dimensional, and consist of one trunk with branches growing on the (100) and sometimes (111) plane. Electron back-scattered diffraction has been shown to be a powerful tool for studying gold dendrites and has enabled the silica recrystallisation textures to be deciphered.
A model proposed for dendrite formation assumes that they grew from solution within a silica gel and then were partly overgrown by sphalerite. Dendrites within sphalerite were not subjected to later maturation while those within silica were completely destroyed due to the crystallisation of silica gel.
Silica gel is a key precursor for formation of single-crystal gold dendrites which is in an agreement with experimental data.
Supplementary material
The supplementary material including EMPA, EBSD data and a tomography video for this article can be found at https://doi.org/10.1180/mgm.2025.30
Acknowledgements
The authors thank V.A. Kovalenker and I.A. Morozov (IGEM RAS), I.O. Galuskina and E.V. Galuskin (University of Silesia) for useful discussion and assistance with data processing. M.S. Lozhkin (St. Petersburg State University) is acknowledged for plasma etching of the samples; John Spratt (formerly NHM) is warmly thanked for EMPA. Constructive comments and suggestions of the four reviewers are also highly appreciated.
Funding statement
The research was carried out within the framework of a state order to the Institute of Geology of Ore Deposits, Petrography, Mineralogy and Geochemistry, Russian Academy of Sciences. X-ray computed microtomography was performed within the framework of project 125021702335-5. EMPA analysis was sponsored by the Natural History Museum (NHM London) via the CERCAMS Fellowship Program hosting study visit of OP in 2010.
Competing interests
The authors declare no competing interests