





Impact statement
Cultivating biocrust for restoration is of critical need for use in restoration of ecosystem function in increasingly degraded drylands. We tested fog culture methods to cultivate biocrust moss and lichen taxa from the intermountain west of the United States of America. Mosses (Homalothecium aureum and Syntrichia ruralis) grew rapidly and increased in cover over a few months in the fog chamber, but lichens (Peltigera rufescens and Cladonia spp.) did not. This presents an affordable and low-maintenance method to cultivate biocrust mosses without soil. Testing additional taxa and modifying conditions to successfully cultivate lichens are needed. The impact of this research is broad, providing a method to test cultivation of biocrust mosses from ecosystems around the world. In addition, it presents a method for answering questions about biology, physiology and ecology, as well as a means to mass-produce mosses for use in restoration.
Introduction
Drylands, covering more than 41–45% of the Earth’s terrestrial surface, are expanding due to climate change and are increasingly impacted by human- and climate-caused degradation (Huang et al., Reference Huang, Yu, Guan, Wang and Guo2016; Prăvălie, Reference Prăvălie2016; Zhou and Yu, Reference Zhou and Yu2025). Dryland regions harbor biological soil crusts, or biocrusts. Biocrusts are defined as a thin, coherent soil surface layer engineered and inhabited by soil and photoautotrophs such as algae, cyanobacteria, lichens, mosses and heterotrophs like fungi, which can be found at the surface of mineral soil (Weber et al., Reference Weber, Belnap, Büdel, Antoninka, Barger, Chaudhary, Darrouzet-Nardi, Eldridge, Faist, Ferrenberg, Havrilla, Huber-Sannwald, Malam Issa, Maestre, Reed, Rodríguez-Caballero, Tucker, Young, Zhang and Zhao2022). Biocrusts contribute to soil stability, carbon and nitrogen fixation, dust capture and hydrologic cycles (Belnap et al., Reference Belnap, Weber, Büdel, Weber, Büdel and Belnap2016). However, degradation of the soil surface due to grazing, off-road vehicle use, agriculture and mining contributes to biocrust loss (Xu et al., Reference Xu, Li, Zhuang and Pan2011; Ladrón de Guevara et al., Reference Ladrón de Guevara, Gozalo, Raggio, Lafuente, Prieto and Maestre2018; Cheng et al., Reference Cheng, Gao, Zhang, Long, Wu and Li2021). Loss of biocrusts accelerates degradation, but harvesting biocrusts from intact ecosystems for restoration can cause further damage (Tucker et al., Reference Tucker, Antoninka, Day, Poff and Reed2020). Cultivation methods that produce biocrusts ex situ offer a potential solution (Doherty et al., Reference Doherty, Antoninka, Bowker, Ayuso and Johnson2015).
Although lab-grown biocrusts have gained traction as an alternative to field harvest, cultivation remains experimental and limited in scale and number of species (Belnap, Reference Belnap1993; Chiquoine et al., Reference Chiquoine, Abella and and Bowker2016; Antoninka et al., Reference Antoninka, Bowker, Chuckran, Barger, Reed and Belnap2018, Reference Antoninka, Faist, Rodríguez-Caballero, Young, Chaudhary, Condon and Pyke2020). The development of tools and technology is needed before biocrust materials can be produced in systems analogous to native plant seed farming. Later-successional biocrust organisms, such as mosses and lichens, are particularly challenging to cultivate, but there are notable successes (Antoninka et al., Reference Antoninka, Bowker, Reed and Doherty2015, Reference Antoninka, Bowker, Chuckran, Barger, Reed and Belnap2018; Bowker and Antoninka, Reference Bowker and Antoninka2016; Bowker et al., Reference Bowker, Antoninka and Durham2017). For example, Syntrichia spp. and Collema spp. grew over 6 months in cultivation (Antoninka et al., Reference Antoninka, Bowker, Reed and Doherty2015). Syntrichia ruralis has shown more robust growth in greenhouses (Doherty et al., Reference Doherty, Antoninka, Bowker, Ayuso and Johnson2015), and attempts to cultivate multi-species biocrusts have had mixed results, with most taxa, especially lichens, failing to persist beyond 6 months (Bowker et al., Reference Bowker, Antoninka and Durham2017).
To improve moss propagation, Doherty et al. (Reference Doherty, Grover, Bowker, Durham, Antoninka and Ramsey2020) tested a fog chamber system with burlap as a substrate and found that a disaggregation step where S. ruralis and Bryum argenteum tissue was put through a sieve improved growth compared to more finely grinding tissue. This disaggregation technique, first described by Shaw (Reference Shaw1986), offers several advantages; setup is fast, avoids the need for sterilization and allows for the production of gametangia and gametophores whereas typical sterile cultures only produce the latter. Testing has only occurred with a few taxa and no lichens, and not relative to intact tissue. Further testing across different moss and lichen taxa is needed to understand when and how disaggregation and fog culture are effective.
Building on Doherty et al.’s (Reference Doherty, Grover, Bowker, Durham, Antoninka and Ramsey2020) success, here we asked whether fog culture could be applied to other biocrust moss and lichen taxa, and if keeping tissue intact versus disaggregating affects growth. Previous fog-cultivation studies have focused almost entirely on a single moss taxon. Whether this approach can be extended to additional mosses or to restoration-relevant lichens remains unknown. We conducted a greenhouse experiment to test fog-based cultivation of two mosses (S. ruralis and Homalothecium aureum) and two lichens (Peltigera rufescens and Cladonia spp.) from a site in the intermountain West. We tested both intact and disaggregated tissues to assess which approach yields more growth across taxa. We added mosses and lichens intact or disaggregated (by breaking up over a 4 mm mesh sieve) to determine which method promotes best growth of new propagules. We chose S. ruralis due to previous success under greenhouse cultivation conditions (Doherty et al., Reference Doherty, Antoninka, Bowker, Ayuso and Johnson2015, Reference Doherty, Grover, Bowker, Durham, Antoninka and Ramsey2020). The second moss we selected was H. aureum for its importance in the intermountain west where we obtained our samples (Durham et al., Reference Durham, Doherty, Antoninka, Ramsey and Bowker2018). We also selected the lichens P. rufescens and Cladonia spp. due to their abundance in the ecosystem (Durham et al., Reference Durham, Doherty, Antoninka, Ramsey and Bowker2018) and for their specific traits. For example, P. rufescens can fix atmospheric nitrogen owing to its cyanobacterial photobiont (Almendras et al., Reference Almendras, García, Carú and Orlando2018), whereas Cladonia spp. have a green algal photobiont and do not fix nitrogen. These two lichens were also tested in a soil-based system watered by capillary action in Bowker et al. (Reference Bowker, Antoninka and Durham2017), but were dead by 6 months, so we wanted to compare how they would fare using a different cultivation tool. All taxa are targets for use in restoration in this system.
We evaluated the feasibility of fog-based cultivation across multiple biocrust taxa to inform restoration strategies in degraded drylands. Due to the general success of other mosses in earlier experimentation, in contrast to the failure of or slow growth in most lichen cultivation experiments, we hypothesized that the mosses would grow better than the lichens because some mosses demonstrate faster tissue growth than lichens, which lack a “rapid” growth stage and have slow growth rates once their thalli reach maturity (Hale, Reference Hale, Ahmadjian and Hale1973). Given that many lichens and mosses are capable of independent or clonal growth, we also wanted to test whether disaggregated or fully intact samples would grow faster. We hypothesized disaggregated samples would grow better than intact samples because of the increased number of potential clonal propagules and increased surface area to expand from. This research will allow us to determine if other taxa can potentially be produced under fog cultivation and will expand knowledge about best practices for biocrust cultivation.
Methods
Collection and storage
We collected our biocrust samples using hand trowels and targeting dispersed patches of target taxa (~5–6 cm diameter by 1 cm deep, including a minimum of 0.5 cm soil to keep samples intact) from ~30 patches in 2021 from MPG Ranch outside of Florence, Montana. They were collected dry, carefully labeled and wrapped in toilet paper and bagged and transported to the laboratory where they were stored dry and in the dark until use (stored for less than 3 months). We selected two mosses (S. ruralis (acrocarp) and H. aureum (plurocarp)) and lichens (P. rufescens (foliose and N-fixing cyanobacterial photobiont; Almendras et al., Reference Almendras, García, Carú and Orlando2018) and Cladonia spp. (squamulose to fruticose when podetia present and algal photobiont) for fog cultivation trials. The taxa were chosen based on prior cultivation success in fog chambers (S. ruralis only), regional abundance, contrasting traits and ecological importance at the collection site (Durham et al., Reference Durham, Doherty, Antoninka, Ramsey and Bowker2018). Cladonia taxa are only identifiable to species in the presence of podetia, so we were not able to confirm species-level identification on source material; however, C. pyxidata, C. fimbriata and C. chlorophaeae are all common in the study area (Durham et al., Reference Durham, Doherty, Antoninka, Ramsey and Bowker2018).
Sample preparation and experimental design
We used a 2 cm diameter core to cut disks from each individual sample with a goal of getting equal sample volume within a taxa group for each replicate. We randomly split samples into two groups, intact and disaggregated with 6 replicates each. We placed the intact group samples in the middle of 10 cm × 10 cm cut black burlap squares, and we crushed the disaggregated group over a 4 mm sieve until all tissue fell through the mesh, then sprinkled this material over the cut black burlap squares within 8 × 8 cm to allow for a 1 cm buffer on each side (see Figure 1). Burlap was chosen as a substrate because of its ability to keep tissue hydrated while letting excess water drip through, with the fibers and weave providing a surface for the tissue to easily attach. We photographed and weighed samples before placing them into the growth chamber. The experimental design included four taxa, added intact or disaggregated, and replicated six times each. We also included six experimental controls with no tissue added to look for colonization by environmental contaminants. None were found, and thus this was excluded from statistical tests.
All monitoring time points are represented on the x-axis with the mean healthy tissue cover for: (a) Syntrichia ruralis, (b) Homalothecium aureum, (c) Peltigera rufescens and (d) Cladonia spp. represented on the y-axis. The graphs are faceted by treatment (intact or disaggregated) with red indicating the intact treatment samples and blue indicating the samples that were disaggregated. Each treatment has a line depicting change over time, with the points representing the raw data values at that time point and the color corresponding to treatment. (e, f) Representative pictures of experimental outcomes for: (e) the mosses and (f) the lichens before being placed in the fog chamber (top photos) and after (bottom photos) 19 weeks, depicted by treatment pairs (intact on left and disaggregated on right).

Figure 1. Long description
Figures include an x axis of time in weeks and mean healthy tissue in percent on the y axis. Each graph has two lines: intact in red and disaggregated in blue. Each line has a grey 95% confidence interval. Lines for mosses are generally positive trending with the blue line above the red line. Lines for lichens are flatter but still show the blue line above the red line. Below the line graphs are two sets of images of the moss and lichen taxa at the start and at the end. Top images show tan/brown mosses or lichens on woven fabric, taking up the center of each fabric square. Intact mosses and lichens are small circles, and disaggregated mosses and lichens are larger squares. Below we see green and active mosses or green or brown active lichens in the same shapes but expanding toward the edges of the fabric. Mosses expanded more than lichens. Disaggregated mosses cover more of the fabric.
Fog chamber cultivation
Fog cultivation methods followed Doherty et al. (Reference Doherty, Grover, Bowker, Durham, Antoninka and Ramsey2020). In brief, we used a PVC frame to support racks covered in window screen to hold samples. Fog is provided by sonication discs (5 Disc Ultrasonic Mist Maker Kit, The House of Hydro, Fort Myers, Fl 33913) running inside a bin of water with a fan blowing out into the chamber. This cycled on (1 min) with 5-min breaks in between. We used row cloth to cover the frame and contain fog, while also allowing light and airflow. The fog chamber is housed inside a climate-controlled greenhouse maintained at 17 °C, varying from 16 to 25 °C.
Monitoring
We monitored samples weekly for 19 weeks. We estimated fog percentage by pulling aside the row cloth while the sonicator was on. We measured percent fog qualitatively based on observed fog in the chamber due to fluctuations in the emitter output due to environmental conditions such as outside temperature and sun position, which we noticed affected the fog emitter output. We recorded percent cover of mosses or lichens using a point-intercept frame with 49 points for each sample to check for growth or death of tissue. The same person measured percent fog and biocrust cover each week for consistency (Figure S1). The 49-point intercept cover included five categories that were recorded: Burlap, Healthy tissue, Dead tissue, Litter and Other (such as other moss, algae or lichen tissue growing on the original sample). We defined healthy tissue here as a qualitative measure that categorizes tissue that is visually consistent with non-senescent tissue as observed in the field. Dead tissue generally presented either discolorations (e.g. loss of chlorophyll) or necrosis. After monitoring, we rotated samples on each tray by two spaces, and the trays by one shelf within the fog chamber to account for the unequal disbursement of fog within the chamber. Point-intercept cover was recorded once every week for 11 weeks consecutively and then switched to once every other week for 4 weeks, totaling 19 weeks. We weighed all samples at the end of the experiment with their burlap after samples were fully air-dried.
We noticed burlap decomposition over the course of the experiment, which was confirmed after control sample weights at the endpoint were lower than their initial readings. To account for burlap decomposition in experimental samples, we weighed and averaged all control samples at both the starting and ending time points, then subtracted the averaged weights from the experimental samples from the initial and ending biomass readings. The control average weight at the start of the experiment was 3.77 g (standard error = ± 0.062), and the control average weight at the end of the experiment was 3.55 g (standard error = ± 0.058), which we subtracted from their respective groups.
Data analysis
We calculated the percent change in the means of the biomass data from the start to the end of the experiment (final − initial)/initial × 100) and used a Shapiro–Wilk test of normality and the Interquartile Range method function in base R and the tidyverse package to look for outliers and test assumptions of normality and homogeneity of variance, finding all responses met assumptions of normality and homogeneity of variance. We modeled the response with a two-way ANOVA with the factors: intactness (levels: intact and disaggregated) and taxa, and the interaction. For point-intercept cover data, we analyzed cover over time, filtering by each taxon, taking the average percent of healthy tissue of experimental samples at each time point. We used a two-way repeated measures ANOVA to analyze differences among the factors of intactness, taxa, time and interactions after checking assumptions. We performed a post-hoc test using Tukey’s honestly significant difference (Tukey HSD) at significance level α = 0.05 to test pairwise differences among sample means.
Results
Cover of healthy tissue over time
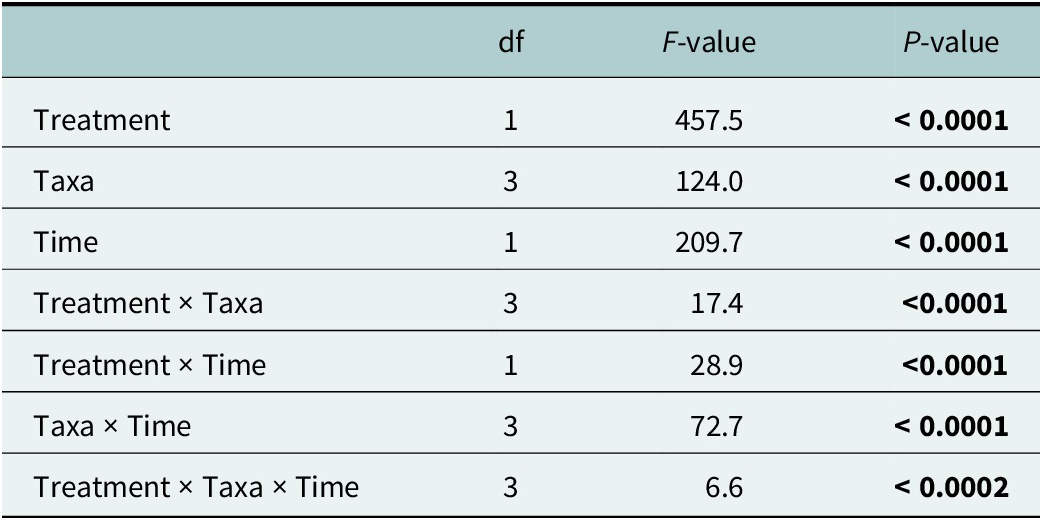
Healthy tissue cover differed across taxa and treatment over time (Table 1; Table S1.1). Tukey’s HSD revealed differences among the two treatment groups, disaggregated and intact, and among all taxa excluding the difference between H. aureum and S. ruralis, for which there was no difference. The repeated-measures post hoc showed differences among all time and treatment comparisons, excluding H. aureum and S. ruralis for both treatments, intact S. ruralis with disaggregated Cladonia spp. and disaggregated P. rufescens with disaggregated H. aureum (p < 0.05).
Two-way Repeated Measures ANOVA for healthy tissue cover over time points

Table 1. Long description
Table shows first column of treatments are listed: Taxa, Time, Treatment by taxa, Treatment by time, taxa by time, treatment by taxa by time. Degrees of freedom are given in column 2, with F-values given in column 3 and p-values in column 4. By row: Row 1: Treatments, 1, 457.5, <0.0001. Row 2: Taxa, 3, 124.0, <0.0001. Row 3: Time, 1, 209.7, <0.0001. Row 4: Treatment by taxa, 3, 17.4, <0.0001. Row 5: Treatment by time, 1, 28.9, <0.0001. Row 6: Taxa by time, 3, 72.7, <0.0001. Row 6: Treatment by Taxa by Time, 3, 66, <0.0002.
Note: Significant values at the α = 0.05 level are bolded.
Fog output fluctuated week to week, with the lowest fog in weeks three, four, seven and eight, ranging from 20% to 80%, and then stabilizing to 40–90%. We observed an increase in healthy tissue in the disaggregated S. ruralis group over time, with a steep increase from week one to week eight, before leveling off (Figure 1a,e). The intact S. ruralis treatment increased steadily from start to end but had lower overall tissue cover than the disaggregated treatment at all time points. H. aureum increased in an identical pattern in both treatment groups. We saw no growth in the first 8 weeks before both mosses increased. The disaggregated treatment increased slightly more in healthy tissue near the end of the experiment than the intact treatment (Figure 1b,e). P. rufescens demonstrated no growth or mortality throughout the experiment for both treatment groups (Figure 1c,f). However, the disaggregated treatment started at a higher healthy tissue cover than the intact treatment, where it remained until the end of the experiment. Cladonia spp. showed disjunct trends between treatments. The intact treatment was consistent throughout with a slight decrease starting at week 10, whereas Cladonia spp. in the disaggregated treatment displayed healthy tissue growth at week six, before leveling out at week eight, and starting to decline at week 11 (Figure 1d,f). Overall, the Cladonia spp. disaggregated group had a higher percentage of healthy tissue throughout the entire experiment than the intact group. Both lichen taxa showed wide variation between samples, with some showing tissue growth and others, such as in our disaggregated Cladonia spp. sample, having extensive plant germination and moss growth from residual soil (Figure 1d).
Biomass
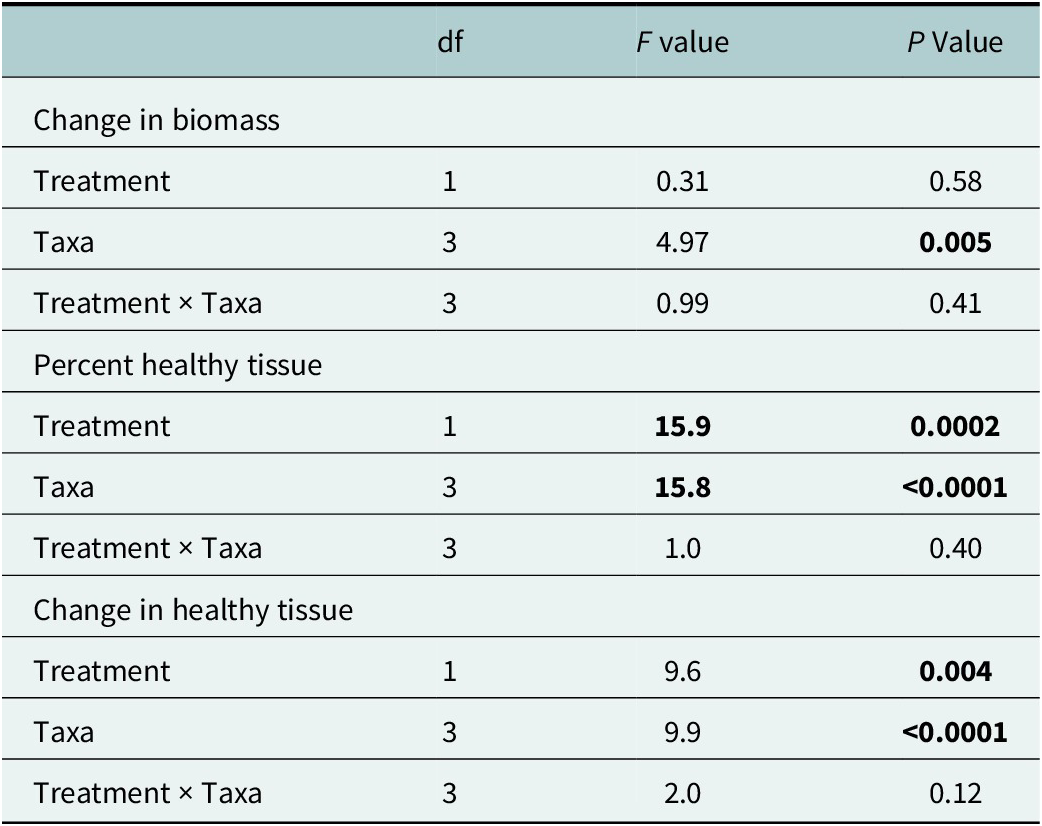
There were no differences between treatment groups (intact and disaggregated) or by the interaction of treatment by taxa for change in biomass (Figure 2a and Table 2). There was, however, a change in biomass among taxa (Table 2 and Figure 2a). Both mosses increased in biomass in both treatment groups with wide variation between samples. H. aureum had the highest biomass growth with S. ruralis following closely behind. No differences were observed within treatment groups. The lichens, P. rufescens and Cladonia spp., had no change in biomass (Figure 2a).
Effects of treatment and taxa on: (a) the percent of biomass change from initial (week 19 biomass – starting biomass divided by starting biomass times 100), (b) Final healthy biocrust cover and (c) the percent of change in cover from initial (week 19 healthy tissue minus starting healthy tissue divided by starting healthy tissue times 100). The two treatments (intact and disaggregated) are represented on the x-axis, which is faceted by genus with the lichens (Peltigera rufescens and Cladonia spp.) first, followed by the mosses (Homalothecium aureum and Syntrichia ruralis). The percent (week 19 healthy tissue minus starting healthy tissue over starting healthy tissue times 100) for healthy tissue cover is represented on the y-axis. Red indicates intact samples while blue indicates disaggregated samples. Boxplots represent the quartiles and range of values, black dots the mean and black error bars represent the standard error.

Figure 2. Long description
Graph a shows a response ratio indicating the percent change in cover over time by species. Both lichens show no change, but the moss species show small positive responses. Graph b shows percent healthy cover at the final time point. In all cases, the healthy cover was greater in disaggregated samples. Graph c shows the change in healthy tissue. This shows that lichens had no change, but mosses increased over time, with greater responses in the disaggregated tissue.
Two-way ANOVA for differences by treatment and taxa

Table 2. Long description
The table contains four columns: Source of Variation, d f (degrees of freedom), F value, and P Value. Significant results (P < 0.05) are noted.
Section 1: Change in biomass
- Treatment: d f 1, F 0.31, P 0.58.
- Taxa: d f 3, F 4.97, P 0.005 (significant).
- Treatment times Taxa: d f 3, F 0.99, P 0.41.
Section 2: Percent healthy tissue
- Treatment: d f 1, F 15.9, P 0.0002 (significant).
- Taxa: d f 3, F 15.8, P less than 0.0001 (significant).
- Treatment times Taxa: d f 3, F 1.0, P 0.40.
Section 3: Change in healthy tissue
- Treatment: d f 1, F 9.6, P 0.004 (significant).
- Taxa: d f 3, F 9.9, P less than 0.0001 (significant).
- Treatment times Taxa: d f 3, F 2.0, P 0.12.
Note: Significant values at the α = 0.05 level are bolded.
Final cover and healthy tissue cover and response ratio
The percent healthy tissue and change in healthy tissue over time at the end of the experiment (week 19, time point 15) overall showed the disaggregated treatment producing higher yields than the intact group for every taxon (Figure 2b,c and Table 2; Table S1.2). The disaggregated treatment for all taxa had greater healthy tissue variation among samples compared to their intact treatment counterpart, particularly for the mosses. Cladonia spp. and P. rufescens remained more stable between samples but had lower overall healthy tissue at the end of the experiment than the mosses. A post-hoc test indicated differences between the disaggregated and intact treatment and between all mosses and lichens, but not differences within mosses or lichens.
Discussion
Mosses grew well in the fog chamber
Both S. ruralis and H. aureum increased in healthy tissue cover and biomass over time in the fog chamber, although growth rates were non-linear. Cover expanded steadily during the first 8 weeks and then began to plateau around week 11. This may suggest a growth threshold related to the available space on the burlap or other physical restraints or limiting factors such as nutrient limitation. We observed moss growth extending slightly beyond the edges of the burlap in disaggregated samples in H. aureum and S. ruralis. We attempted to minimize variation in fog delivery, but variation, likely driven by light and temperature, may also have affected growth. It is possible that high fog output near the end of the experiment led to oversaturation of the mosses. Mosses can hold up to 1,400% of their dry mass in water, but oversaturation reduces photosynthesis (Green and Lange, Reference Green, Lange, Schulze and Caldwell1995; Proctor et al., Reference Proctor, Nagy, Csintalan and Takács1998). The fog chamber allows for rapid high-density propagation, vertical stacking and cultivation of multiple species without direct contact. Our results support its use as a viable tool for moss production, at least for some taxa. Future work should assess post-cultivation field establishment, optimize fog output for maximum yield and field readiness or “hardening,” and evaluate more species. Some researchers simulate hardening by exposing moss to stress before installation; others suggest that slow drying during cultivating moss may achieve similar effects (Stark, Reference Stark2017; Bowker et al., Reference Bowker, Antoninka and Chuckran2020). Controlled tests comparing these approaches would improve our understanding of how to prepare moss for outplanting (e.g. Bowker et al., Reference Bowker, Doherty, Grover, Antoninka, Durham and Ramsey2023).
Successful lichen cultivation is still elusive
Both P. rufescens and Cladonia spp. showed little or no growth in the fog chamber, with signs of dieback over time in both intact and disaggregated treatments. We did see variation among samples for both lichen taxa when looking at change in biomass, healthy tissue cover over time and final healthy tissue cover. This is possibly due to variation in fog output, indicating that lichens may be more sensitive to changes in the environment than moss. This is supported by MacFarlane and Kershaw (Reference MacFarlane and Kershaw1980), who found that active temperatures of 25 °C could lead to damage in Peltigera species. Since samples were stacked above one another in the fog chamber, exposure to moisture differed for each sample every week, even though we rotated trays weekly to account for heterogeneity in fog output due to location. These results suggest that fog cultivation, as implemented here, may not have been ideal for these taxa. Previous experiments in wicking systems also failed to support sustained lichen growth except for one genus of gelatinous lichen (Enchylium sp.; Antoninka et al., Reference Antoninka, Bowker, Reed and Doherty2015; Bowker and Antoninka, Reference Bowker and Antoninka2016; Antoninka et al., Reference Antoninka, Bowker, Chuckran, Barger, Reed and Belnap2018). More exploration of temperature, light and hydration conditions could lead to scenarios that favor growth and some mechanistic ideas for why lichen cultivation remains elusive. While fog output and temperature could be adjusted, we also encourage taxon-specific research to identify the environmental preferences of lichens. This information could inform further targeted research.
Tissue disaggregation influences biocrust growth
Disaggregated treatments showed more healthy tissue cover over time at the final time point, even though there were no differences in biomass between intact and disaggregated samples. Because the biomass measure included both live and dead material, we recommend point-intercept cover and response ratios from initial to end as stronger indicators of moss performance. The greater cover observed in disaggregated samples contrasts with the idea that mosses like S. ruralis require intact structures or cushion formation to retain water and facilitate vegetative reproduction in nature, and therefore could have a difficult time producing propagules if disaggregated (Sand-Jensen and Jul Hammer, Reference Sand-Jensen and Jul Hammer2012; Wu et al., Reference Wu, Zhang, Downing, Aanderud, Tao and Williams2014). However, both our experiment and Doherty et al. (Reference Doherty, Grover, Bowker, Durham, Antoninka and Ramsey2020) demonstrated that when mosses are given ample water, disaggregated gametophytes reproduce clonally. Because mosses reproduce vegetatively through fragmentation (Best, Reference Best1901), fragmenting the moss tissue may have stimulated a stress response triggering overcompensation of growth (Paľová et al., Reference Paľová, Ručová, Goga and Kolarčik2020). A possible explanation is that fragmentation increased the number of viable propagules available for clonal growth. Alternatively, fragmentation may have induced compensatory growth responses reported in other bryophytes. Our experiment was not designed to distinguish between these mechanisms. Our findings, consistent with Doherty et al. (Reference Doherty, Grover, Bowker, Durham, Antoninka and Ramsey2020), show that disaggregated samples maintained more healthy tissue cover than intact samples in both moss species. This suggests that disaggregated biocrust may be more feasible for inoculating larger restoration sites compared with biocrusts kept intact.
While disaggregated propagules allow broader coverage with limited supply, they are more vulnerable to disturbance from wind or rain if not anchored to a substrate (Young et al., Reference Young, Bowker, Reed, Duniway and Belnap2019; Bowker et al., Reference Bowker, Antoninka and Chuckran2020). On the other hand, samples attached to burlap may be spatially constrained, limiting spread beyond the fabric. Jute netting has been used to establish moss cover over larger areas (Condon and Pyke, Reference Condon and Pyke2016), but more research is needed to weigh the trade-offs between enhanced establishment with anchoring and the broader dispersal possible with unattached moss tissue.
Conclusion
Our results demonstrate that fog chamber cultivation is effective for some biocrust mosses. H. aureum and S. ruralis grew under greenhouse fog conditions, with disaggregated tissue producing broader colonization than intact samples. Disaggregation increased moss cover but not biomass. This suggests we are either losing biomass in culture through decomposition or through cracks in the fabric, but still indicative of growth promotion (Doherty et al., Reference Doherty, Grover, Bowker, Durham, Antoninka and Ramsey2020). We found that fluctuations in growing conditions affected the growth of some taxa, and we suspect that growth was inhibited over time by using all of the surface area. Cultivation of biocrust moss on burlap is promising for field studies, but further tests to determine field hardiness and optimal establishment conditions are needed. Fog cultivation of lichens P. rufescens and Cladonia spp. was not successful in this study, suggesting that we did not provide optimal conditions, and more research is needed here. These results expand the range of moss taxa that appear amenable to fog cultivation while identifying important limitations for lichen propagation under a common cultivation protocol. Together, these findings help define where fog cultivation is immediately applicable and where additional methodological development is still required.
Open peer review
For open peer review materials, please visit https://doi.org/10.1017/dry.2026.10056.
Supplementary material
The supplementary material for this article can be found at http://doi.org/10.1017/dry.2026.10056.
Acknowledgments
We would like to thank Claire Johnson for help with data collection, Michael Sloan for fog chamber maintenance, Dr. Nancy Johnson for discussion and edits and MPG Ranch for collection sites.
Author contribution
B.C., J.A., A.A. conceived project ideas and created study design; B.C. collected, organized and analyzed data; B.C. wrote manuscript; J.A., M.B., A.A. provided mentorship; R.D., P.R., M.B., A.A. provided resources; J.A., M.B., R.D., P.R., A.A. edited and revised manuscript and gave final approval for publication.
Competing interests
The authors have no conflicts of interest to report.
Data availability statement
The data that support the findings of this study are openly available in Mendeley Data at https://data.mendeley.com/drafts/dy5bywwgvs.
Funding statement
B.C. was supported on NIH RISE (1R25GM127199-01) and NASA Space Grant (80NSSC25M7084). This work was also supported with funding from MPG Ranch (M.B., A.A., J.A.).




 Open access

