In the last years, sport sciences have experienced a growing interest in decision-making processes and their relationship with competitive success (Bar-Eli, Plessner, & Raab, Reference Bar-Eli, Plessner and Raab2011). Researchers are working on extracting objective information from natural competitive environments, in order to identify and modify trainable decisions that could contribute to competitive performance (Drust, Reference Drust2010; McGarry, O’Donoghue, & Sampaio, Reference McGarry, O’Donoghue and Sampaio2013).
Speed, interactions, and time pressure (Jiménez-Sánchez, Sáenz-López, Ibáñez, & Lorenzo, Reference Jiménez-Sánchez, Buñuel, Ibáñez and Lorenzo2012) have made basketball become an extremely high decisional-complexity sport. In the more restricted arena of offensive phases of the game, teams’ tactics, as well as individual players’ decisions are oriented towards generating optimal shot opportunities. Indeed, several studies have addressed the problem of shot selection from a theoretical point of view (see Goldman & Rao, Reference Goldman and Rao2011, for analyses of allocative and dynamic efficiency approaches; Skinner, Reference Skinner2012, for an optimal stopping problem approach). Other attempts have focused on the hot hand phenomenon and its impact on players’ decisions (Csapo, Avugos, Raab, & Bar-Eli, Reference Csapo, Avugos, Raab and Bar-Eli2015), or have adopted a reinforcement learning perspective (Neimann & Lowenstein, Reference Neiman and Loewenstein2011). In spite of the relevance of the abovementioned studies, to date, none of them have addressed the analysis of shot selection in a more practical manner. For example, it remains unclear how specific pre-shot decisional cues impact on proximal and delayed outcomes of shooting. That means that an objective method to determine the decisional quality of a shot (how well that shot was selected) that considers its effect on both close and distant game-relevant outcomes, has not yet been formulated.
In general, previous research has stressed the difficulty and complexity of modelling the processes underlying shot adequateness judgments and shooting decisions (Skinner, Reference Skinner2012). Nevertheless, research about shot selection has taken into account, almost exclusively, direct shot outcomes (hit/miss), and have neglected more delayed outcomes that could also contribute to competitive advantage. In the absence of this potentially valuable research, and with a more applicative aim in mind, experts have tried to describe the conditions that discriminate between good and bad shots in technical works directed to an audience mostly consisting of professional coaches (Krause, Meyer, & Meyer, Reference Krause, Meyer and Meyer2008; Wooden & Nater, Reference Wooden and Nater2006). According to these, good shooting decisions should increase the likelihood, not only of scoring, but also of offensive rebound (in case of miss), and decrease the likelihood of suffering a subsequent fast break (in case of no rebound).
In the (almost deserted) space between theoretical and practical endeavours, notational analysis research has pointed out different performance indicators that influence game result (e.g., controlling the defensive rebound increases the likelihood of winning games, García, Ibáñez, Gómez, & Sampaio, Reference García, Ibáñez, Gómez and Sampaio2014). Some other studies (Perales, Cárdenas, Piñar, Sánchez-Delgado, & Courel, Reference Perales, Cardenas, Pinar, Sanchez-Delgado and Courel2011; Suárez-Cadenas, Cárdenas, Sánchez-Delgado, & Perales, Reference Suárez-Cadenas, Cárdenas, Sánchez-Delgado and Perales2015) have tried to operationalize decisional cues, namely, environmental cues that could signal the consequences of shooting decisions: (1) degree of presence of direct opposition by a defender, (2) shooting distance, (3) shooting lateral angle, (4) team’s disposition to offensive rebound, and (5) team’s disposition to defensive balance.
These decisional cues are probabilistic, in the sense that they can portray a heavier or lighter weight in predicting shot outcomes. For example, we do not know the validity (Brunswick, Reference Brunswik1955) of the offensive team’s disposition towards rebound as a predictor of catching the imminent rebound. Namely, we do not know the parameters of the function that links a specific quantitative index of team’s disposition and the likelihood of rebound. Under certain assumptions, that validity can be objectively captured as a regression index, after regressing the outcome under consideration (catching or not the rebound) over its possible predictors (Hastie & Dawes, Reference Hastie and Dawes2010). Decision-making improvement, in fact, can be described as the progressive tuning of the decision-maker’s utilization of those cues to their objective validities (Hogarth, Reference Hogarth, Plessner, Betsch and Betsch2008; Suárez-Cadenas et al., Reference Suárez-Cadenas, Cárdenas, Sánchez-Delgado and Perales2015).
To date, main limitations in the field of decision making in sports are attributable to two reasons. First, to the prevalence of studies based on experts’ judgements and their notion of what is a good decision. For example, Bar-Eli et al. (Reference Bar-Eli, Plessner and Raab2011) acknowledged the ambiguity of what an expert and a correct decision are. And second, research on this topic shows a predominance of laboratory task-based studies over more ecologically valid methodologies (Farrow & Raab, Reference Farrow, Raab, Farrow, Baker and MacMahon2008). The tentative decisional quality model proposed in this study extracts objective information about decisions quality directly from the real game and consequently, helps partially surpassing the abovementioned limitations.
In summary, although training methods already incorporate strategies to improve shot selection, and expert coaches and players have been shown to be better than novices at extracting high-quality informational cues from the game (García-González, Araújo, Carvalho, & Iglesias, Reference García-González, Araújo, Carvalho and Iglesias2011), there have been no attempts to estimate the statistical validity of decisional cues to predict both proximal and distal consequences of shooting. In other words, we lack of valid information to objectively determine shot quality, understood in terms of the conditions that a shot situation should meet in order to maximize positive outcomes and minimize negative ones (i.e., validities). Making estimates of shot-decision quality available could be useful to provide feedback both to shooters (in order to inform better individual decisions), and to the coach and the other players (in order to set optimal conditions for shooting). In addition, observed changes in decisional quality across different circumstances (e.g., across shots subject to different levels of possession time pressure, across trials in a hot-hand streak, or under different degrees of emotional or cognitive load) (see, for example, Csapo et al., Reference Csapo, Avugos, Raab and Bar-Eli2015 or Raab, Reference Raab2002) could allow analyzing the impact of such circumstances on decision-making processes.
In this study, we take the first steps towards developing a shot decision quality-assessment model. 2976 jump shots from 50 Euroleague matches were sampled, following systematic observation guidelines. On the basis of previous studies (Perales et al., Reference Perales, Cardenas, Pinar, Sanchez-Delgado and Courel2011; Suárez-Cadenas et al., Reference Suárez-Cadenas, Cárdenas, Sánchez-Delgado and Perales2015), the decisional cues taken into consideration were shooting opposition, distance, lateral angle, team’s disposition to offensive rebound and teams’ disposition to defensive balance at the moment of shooting. Similarly, the proximal outcomes from shooting to be predicted were scoring (or not), catching (or not) the following rebound, and preventing (or not) a fast break. Distal outcomes were the amounts of points scored and received, and the final result of the match (winning/losing). A first set of (logistic) regression analyses was run to explore the impact of decisional cues on proximal outcomes. A second set of (logistic and linear) regression analyses was performed to explore the relationships between proximal and distal outcomes. Finally, regression analyses were carried out to check whether the effect of decisional cues on proximal outcomes do transfer to distal outcomes. Given the exploratory nature of this study, we hold no previous hypothesis about the map of significant relationships and their corresponding weights.
Method
Sample
The sample consisted of 2976 shots corresponding to 50 matches from the 2012–13 and 2013–14 seasons of the Basketball Euroleague. Only jump shots performed outside the 3-second-restricted area during offensive phases and with possibility of rebound, for the two teams in each match, were considered. Shooting fouls, free throws, and off-time shots were discarded.
Variables
Decisional cue-presence scores
These variables refer to the degrees of presence of each of the environmental cues considered relevant to shot outcomes, registered exactly at the moment of shooting (on the basis of a frame-by-frame inspection of ball release). In order to reduce ambiguity, all scores were expressed in discrete scales. The procedural details and rationale of how these variables were operationalized are described in full in Appendix 1.
Opposition was defined as the degree to which an opponent was close enough and ready to interfere with the shot attempt, measured in a 1 (low) –4 (very high) quasi-quantitative scale. Shooting distance was computed as the linear distance from the vertical feet projection on the floor to the vertical basket projection on the floor, and then translated into a 1 (close) to 4 (very distant) scale. Lateral angle was first measured as the angle formed by the end line and the imaginary line from the shooter to the basket and then translated into a 1 (corner shot) –4 (frontal shot) scale, regardless of court side (left-right). Team’s disposition to offensive rebound was defined as the number of offensive players inside the three second restricted area at the moment of shooting and was measured in a 0 to 3 (players) quasi-quantitative scale (there was no cases with 4 or 5 players in data collection). Team’s disposition to defensive balance was defined as the number of defensive players situated behind the free throw line. Based on the number of observations, this variable was clustered as 0/1, 2, 3 and 4/5 players (1 – 4 quasi quantitative scale). Additionally, we also computed mean scores for each decisional cue, averaging their values across shots for each team in each match. These mean scores represent the general tendency in each team and each match to shoot with higher or smaller degrees of opposition, distance, lateral angle, rebound and balance. In other words, these mean values can be interpreted as match and team-specific shooting decision-related summary stats.
Proximal outcomes
The in-game outcome of each shot was described by using three dichotomous variables: scoring (yes/no); catching the subsequent offensive rebound (yes/no), in case of miss, and preventing fast break (yes/no; a fast break was considered to be prevented if the opponent team took longer than 7 seconds to make an advantage shot, with defence not yet organised), in case of not catching the rebound. Additionally, we also computed shooting effectiveness (proportion of hits over total number of shots), rebound effectiveness (proportion of rebounds caught over missed attempts with possibility of rebound for one team or the other), and defensive balance effectiveness (proportion of fast breaks prevented over the total number of attacks from the opponent team following rebound) scores. These effectiveness scores were computed for each team and each match. Please note that the three outcomes are logically chained: only rebounds subsequent to the shots included in the analysis, and only attacks resulting from not catching those rebounds were taken into account for further analyses. This is obviously due to the fact that our interest is to inspect exclusively those variables involved in or resulting from the shots previously selected for analysis.
Distal outcomes
Match outcomes were defined by using two quantitative variables (points scored and points received) and one dichotomous one (match result: winning/losing).
Data collection and statistical analysis
Features and consequences of shot attempts were recorded following systematic observation guidelines, performed by two expert technicians specifically trained for this task, graduated in Sports Sciences, with a minimum of eight years’ experience as basketball coaches, and recognized as such by the Spanish Basketball Federation. Variable recording training took place during a four-week long period (20 hours in total). For all variables, agreement between judges, as measured by Cohen’s Kappa was .85 or higher, which qualifies as very strong (Altman, Reference Altman1991). All data were collected using the LINCE software, a program specifically designed to measure sport behaviour (Gabín, Camerino, Anguera, & Castañer, Reference Gabín, Camerino, Anguera and Castañer2012).
Statistical analysis included binary logistic and linear regressions. For logistic regressions, b-values (B) and Odds Ratio (OR) with their 95% confidence intervals (CI) were estimated and Nagelkerke’s R 2 was used to assess goodness-of-fit of the models. Significations of predictors were assessed by means of Wald’s test. For linear regressions, b-values (B) and standardized b-values (β) were estimated and R 2 and adjusted R 2 (ΔR 2 ) were used to provide a goodness-of-fit of the models. Significations of predictors were assessed by t tests. The significance threshold for all analyses was p = .05. Statistical analyses were conducted in IBM SPSS Statistics, Version 20.0 (2011, Armonk, NY: IBM Corp.).
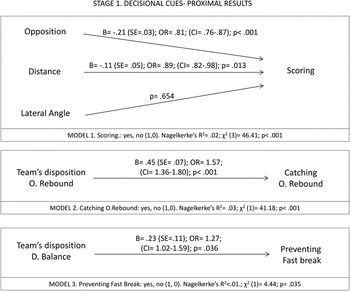
Analyses Footnote 1 were carried out in three separate stages (see Table 1). In Stage 1, proximal results were regressed over decisional cues, according to three logistic binary regression models. In Model 1, scoring (yes/no) was regressed over opposition, distance and lateral angle, across all the shot attempts under consideration (n = 2976). In Model 2, performed upon missed shots (n = 1741), catching the rebound (yes/no) was regressed over team’s disposition to rebound. Finally, in Model 3, carried out upon all shots for which the rebound was not caught (n = 1059), defensive balance with fast break prevention (yes/no) was regressed over team’s disposition to defensive balance. In general, the inclusion of predictors in each of the three models was based on reasonable cause-effect connections. For example, in the first model, disposition to offensive rebound and disposition to defensive balance were not included as there is not any evident way in which they could be connected to scoring. In the same way, opposition, distance and lateral angle were not included in models 2 and 3 as there are no evident ways in which they could affect the likelihood of an offensive rebound or preventing a possible fast break Footnote 2 . (Note, however, that in the last analysis all decisional cues were included in the same model, as all of them can impact on distal outcomes, i.e., game result).
Summary of decisional cues, proximal results and distal results, and stages of analyses

Stage 1. Relationships between decisional cues and proximal results.
Stage 2. Relationships between proximal results and distal results.
Stage 3. Relationships between decisional cues and distal results.
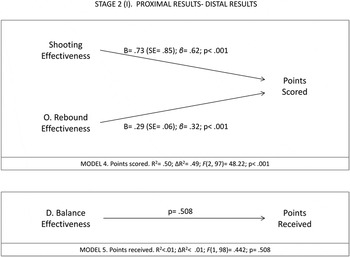
In Stage 2 (prediction of distal outcomes from proximal outcomes), two separate analyses were carried out to linearly regress points scored over shooting and rebound effectiveness (Model 4), and points received over defensive balance effectiveness (Model 5). Please note that shooting and rebound effectiveness were computed over shots and resulting rebound for each team and each match (n = 100).
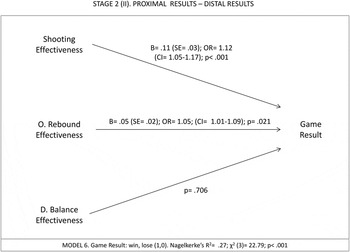
Similarly, a logistic binary regression analysis was carried out to regress the final result of the game (winning/losing) over shooting effectiveness, rebound effectiveness, and defensive balance effectiveness (Model 6; n = 50). In order to avoid the violation of independence of error’s assumption, in this model (similarly in model 9), a random sample of 50 matches was selected (25 matches from winning teams and 25 losing teams different from the previous).
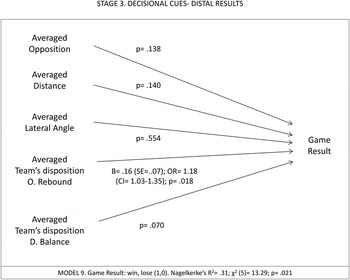
Finally, in Stage 3, we tried to predict distal outcomes from decisional cues. Opposition, distance, lateral angle, and disposition to rebound scores (averaged across all shots under consideration for each team and each match) were used to linearly predict points scored (Model 7, n = 100). Similarly, team’s disposition towards balance was used to linearly predict points received (Model 8, n = 100). Two final logistic binary regression analyses were carried out to predict the final result of the game from all mean decisional cue scores (Model 9, n = 50). Note that, in this stage, decisional cue values were averaged across all the shots under consideration for each match and team. In this sense, if opposition is connected to points scored, that relationship must be interpreted as suggesting that teams who tend to select shots against larger degrees of defenders’ opposition tend to make less points. In other words, averaged decisional cue values can be interpreted as alternative team stats with potential links with game results (which is, indeed, one of the main aims of the present work).
Results
Results from Stage 1 (models 1, 2, 3) are shown in Figure 1. Model 1 (accuracy = 62.7%), revealed a negative relationship between likelihood of scoring and both shooting opposition (i.e., the more opposition, the lower probability to score) and shooting distance. No significant relation was found for lateral angle. Model 2 (accuracy = 67.8%) showed a positive relationship between likelihood of catching an offensive rebound and the number of players in the three-second restricted area at the moment of shooting. Model 3 (accuracy = 86.1%) revealed a significant positive relationship between fast break avoiding and team’s disposition to defensive balance.
Logistic regression models (1, 2 and 3) from analysis Stage 1. Depiction of relations between decisional cues and proximal outcomes.

Results from Stage 2 (models 4, 5, 6) are shown in Figures 2 and 3. Model 4 (R 2 = .50) revealed a significant positive relationship between shooting effectiveness and points scored at the end of the match. A similar relationship was found between rebound effectiveness and points scored. Model 5 (R 2 < .01) did not reveal a significant relationship between defensive balance effectiveness and points received. Model 6 (accuracy = 66%) revealed a significant positive relation between the likelihood of winning and both shooting effectiveness and rebound effectiveness. No significant relation between defensive balance effectiveness and game result were found.
Linear regression models (4 and 5) from analysis Stage 2 (I). Depiction of relations between proximal and continuous distal outcomes (points scored and received).

Logistic regression model (6) from analysis Stage 2 (II). Depiction of relations between proximal and dichotomous distal outcomes (match result).

Results from stage 3 (model 9) are shown in Figure 4. Models 7 and 8 did not yield significant relations and are not represented. Finally, Model 9 (accuracy = 74%) showed a positive relationship between likelihood of winning and average team`s disposition to offensive rebound. There were no significant relations for the rest of the cues. Additionally, as suggested by an anonymous reviewer, we also tested two models, alternative to Model 9 in Stage 3, segregating successful from unsuccessful shots; results from this complementary analyses are shown in Appendix 2. Those extra analyses showed interesting results, specifically for missed shots. In that submodel, not only disposition to rebound, but also disposition to defensive balance positively impacted on game result.
Logistic regression model (9) from analysis Stage 3. Depiction of relations between averaged decisional cues and dichotomous distal outcomes (game result).

Discussion
This study was aimed at setting the way to develop a quality model of shooting based on the relationship between decisional cues (contextual cues present at the moment of shooting) and their proximal and distal results.
The first two analysis stages showed that decisional cues were significantly linked to proximal results, and these, in turn, were linked to more distal game results. More specifically, opposition by a defender and shot distance negatively predicted jump shot effectiveness, and this significantly predicted points scored and the odds to win the match. In general, those results are in accordance with studies from match analysis and performance indices analysis, confirming that losing teams take more shots with high opposition than winning teams, and shot efficacy increases with lower opposition and closer distances to the basket (Álvarez, Ortega, Gómez, & Salado, Reference Álvarez, Ortega, Gómez and Salado2009; Lorenzo, Gómez, Ortega, Ibáñez, & Sampaio, Reference Lorenzo, Gómez, Ortega, Ibáñez and Sampaio2010).
With regard to offensive rebound, the number of offensive players inside the three-second-restricted area at the moment of shooting positively predicted catching the rebound. Offensive rebound effectiveness, in turn, predicted points scored and game result. These two pieces of evidence concur with previous studies at showing that rebound control increases the chances of winning (Csataljay, O’Donoghue, Hughes, & Dancs, Reference Csataljay, O’Donoghue, Hughes and Dancs2009; Sampaio, Drinkwater, & Leite, Reference Sampaio, Drinkwater and Leite2010). The few studies that have studied the importance of offensive rebound so far have identified it as an important factor in basketball performance analysis (Kubatko, Oliver, Pelton, & Rosenbaum, Reference Kubatko, Oliver, Pelton and Rosenbaum2007; Oliver, Reference Oliver2004), and have shown the direct relationship between team’s performance and attackers/defenders numerical balance at the moment of shooting (Rivas, Navarro, Tavares, & Gómez, Reference Ribas, Navarro, Tavares and Gómez2011).
Moreover, team’s disposition to defensive balance was positively related to the number of fast breaks avoided. However, we found no significant relationships of fast breaks avoidance effectiveness with either points received or game result. In apparent contradiction with this result, fast breaks have been shown to be important determinants of match result elsewhere (Tsamourtzis & Athanasiou, Reference Tsamourtzis and Athanasiou2004). A potential explanation of this contradiction may rely on the fact that defense disposition at the moment of shooting determines only a fraction of the total number of fast breaks. Elite teams average low numbers of fast breaks (approximately 15% of attacks), and among these, six out of ten do not follow immediately after catching a rebound, but after stealing the ball (Garefis, Tsitskaris, Mexas, & Kyriakou, Reference Garefis, Tsitskaris, Mexas and Kyriakou2007).
Importantly, a third analysis stage checked for the relationships between decisional cues and distal results. Team’s disposition to offensive rebound, computed as the rebound score averaged across all shots under consideration for each team and each match, directly predicts game result. To our knowledge, this is the first time a relationship between a decisional cue (prior to shot) and a distal result (winning or losing the game) is reported and quantified. This result is particularly interesting, as disposition to rebound is not as salient or easily discriminable as opposition or distance and as a consequence more difficult to be learnt (see Perales et al., Reference Perales, Cardenas, Pinar, Sanchez-Delgado and Courel2011; Suárez-Cadenas et al., Reference Suárez-Cadenas, Cárdenas, Sánchez-Delgado and Perales2015). In other words, although disposition to rebound by the shooter’s team (at the moment of shooting) has a significant impact on the odds to win the match, there is no empirical evidence so far that shooters do refrain from shooting when their team disposition to rebound is suboptimal. Previous and current data (Llorca-Miralles, Sánchez-Delgado, Piñar, Cárdenas, & Perales, Reference Llorca-Miralles, Sánchez-Delgado, Piñar, Cárdenas and Perales2013; Suárez-Cadenas et al., Reference Suárez-Cadenas, Cárdenas, Sánchez-Delgado and Perales2015) show that strategy is probably trainable with proper feedback, and could improve the whole team’s performance.
Before going any further, and in relation to our previous argument, it is important to note that we have not considered so far the individual or psychological factors by means of which decisional cues enter actual players’ decisions (in case they do). In general, we can reasonably assume strategic decisions made by the whole team are oriented towards finding good shooting situations, including a good disposition towards offensive rebound. However, an important aspect of individual shooters’ decisions is the degree to which they take advantage of the scenarios generated by the whole team. We suspect that psychological features like impulsivity, resistance to pressure and interference, and other personality traits can have a particular strong impact on determining whether shooters incorporate this sort of non-obvious cue into their shooting decisions. The results presented here, however, provide no evidence at all on this regard.
In fact, evidence regarding the validities of decisional cues as predictors of shooting consequences can inform decision-improvement training methods both at the individual and the collective levels. Knowing the degree of importance of non-immediate consequences of shooting (e.g., securing rebound) on the match result, and the link between pre-decisional cues (e.g., team’s disposition to rebound) on such feedback can help coaches bring relevant feedback forward, making it more contiguous in time both for shooters and their teammates.
Still, future studies must also take individual differences into account. Despite the fact we have shown that general cue validities can be computed for large samples and a variety of teams and playing circumstances, they are also likely to differ between individuals (Araújo, Davids, & Hristovski, Reference Araújo, Davids and Hristovski2006). Nevertheless, the same tracking and recording methods described here can, in principle, be used to analyze performance at the individual level, as far as the athlete is recorded for long enough to have sufficient observations to allow computing the impact of decisional cues on proximal consequences resulting from her decisions, and her contribution to her team’s performance. In this sense, future studies could include different cues in the analyses (e.g., an alternative better than shooting) and examining their impact on proximal and distal results. Similarly, different models could be developed analysing other shot types, for example, those taken inside the three seconds restricted area, where different decisional cues could emerge as relevant for proximal and distal feedback.
Appendix 1
Decisional cue-presence scores
These variables were registered exactly at the moment of shooting (frame previous to ball release, on the basis of a frame-by-frame inspection).
Opposition. Defined as the degree to which an opponent was close enough and ready to interfere with the shot attempt (1 – 4). Low opposition (1): the closest opponent from the shooter was without jumping in a distance further than two steps at the moment of throwing the ball without jumping and was not able to interfere with the shot (even with his arm/s raised). Medium opposition (2): the closest opponent from the shooter tried to interfere the shot through a jump action in a distance further than two steps or without jumping in a distance between one and two steps (with his arm/s raised or not). High opposition (3): the closest opponent from the shooter tried to interfere the shot through a jump action in a distance between one and two steps far or without jumping in a distance closer than one step (with his arm/s raised). In this case, the opponent clearly interferes the shot although not modify the natural shooter’s motion. Very high opposition (4): the closest opponent from the shooter tried to interfere the shot through a jump action or without it in a distance closer than one step with his arm/s raised. In this case, the opponent interferes the shot and modifies the natural shooter’s motion (e.g., fadeaway shot, step-forward shot or changed ball’s trajectory shot).
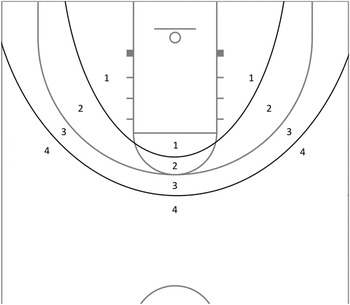
Shooting distance. Computed as the linear distance from the vertical feet projection on the floor to the vertical basket projection on the floor. Continuous distances were translated into a categorical measure according to the references displayed in Figure 5.
Shooting distance zones. 1 = close shots; 2 = intermediate shots; 3 = distant shots; 4 = very distant shots.

Lateral angle. Measured as the angle formed by the end line and the imaginary line from the shooter to the basket (1 – 4). (1) Corner shot: 0°–20°/161°–180°. (2) lateral shot: 21°–40°/41°–160°, (3) semi lateral shot: 41°–60°/121°–140°, and (4) frontal shot: 61°–120°.
Offensive team’s disposition to rebound. Defined as the number of offensive players inside the three second restricted area at the moment of shooting (0 – 3; there were no cases with more than three players in the target area).
Team’s disposition to defensive balance. Defined as the number of defensive players situated behind the free throw line (on the bassis on the number of observations per category, this variable was clustered into four values: 0/1, 2, 3, 4/5).
Appendix 2
As suggested by an anonymous reviewer, analyses for Stage 3 models were performed separately for successful and unsuccessful shots. Six complementary regression models were run trying to predict distal outcomes (game result, point scored and points received) from decisional cues, separately for successful and unsuccessful shots. Unfortunately, for successful shots, disposition to rebound and disposition to balance were not recorded and it was not possible to include them in the analyses.
Results from those models are quite similar the original ones (figure 6). For missed shots, model 10 (accuracy = 72%), showed that, not only disposition to offensive rebound, but also disposition to defensive balance, positively impact on game result. There were no significant relations involving any other cue either for unsuccessful or successful shots.
Alternative logistic regression model (10) from analysis Stage 3. Depiction of relations between averaged decisional cues and dichotomous distal outcomes (game result), for unsuccessful shots only.

The fact that disposition to defensive balance predicted distal results only for missed shots probably deserves further investigation. Please note that at the moment of shooting, shots are not misses or hits yet. The fact that disposition to rebound in “to-be-missed” shots impact distant outcomes could be implying that the members of the team (apart from the current shooter) can preview the result of the shot (a miss, in this case), and are sensitive to the cues indicating that a rapid defensive reaction will be required.