
Introduction
Over the past decades, a multitude of researches was performed on the investigation of the synthesis methodology and the catalysis mechanism of electrochemical catalysts with high catalytic performance and low material cost for the oxygen reduction reaction (ORR).( Reference Wang, Maiyalagan and Wang 1 , Reference Sun, Song, Zhang, Liu, Xu and Xing 2 ) To reduce the physical cost of the fuel cell stacks, the alternative catalytic materials have been extensively studied, and a significant recent advance in non-platinum group metal catalysts has emerged with the advent of new carbon structures including carbon nanowires, nanotubes, and graphenes doped with nitrogen.( Reference Wei, Tong, Zhang, Qiao, Gong and Sun 3 – Reference Kramm, Herrmann-Geppert, Behrends, Lips, Fiechter and Bogdanoff 5 ) The advantages of carbon-based catalysts, such as low cost, and good ORR activity, stability, and selectivity, make them become promising ORR catalysts for electrochemical systems like proton exchange membrane fuel cells.( Reference Zhuang, Nunna, Mandal and Lee 6 )
Recently, it has been demonstrated that the ORR catalytic activity of nitrogen-doped graphene (N-G) catalysts can be comparable to Pt catalysts.( Reference Zhuang, Lee, Lei, Nunna, Kuang and Zhang 7 ) The published electrochemical characterization results of N-G catalysts generated by the nanoscale high-energy wet (NHEW) ball-milling method are shown in Fig. S4. It shows that the ORR electron transfer number of N-G catalyst has reached to 3.87, which is comparable to the 3.95 of the 10 wt% Pt/C catalyst.( Reference Zhuang, Lee, Lei, Nunna, Kuang and Zhang 7 ) The synthesis mechanism and processing control of N-G catalysts have been well understood in the recently published paper.( Reference Zhuang, Lee, Lei, Nunna, Kuang and Zhang 7 , Reference Zhuang, Nunna, Boscoboinik and Lee 8 ) Based on the previous research, an approach for the improvement of the catalytic performance of N-G catalysts was newly investigated. The approach is using the metal–organic framework (MOF) material to modify N-G catalysts with NHEW ball-milling method.
The MOF, such as Zeolitic imidazolate framework-8 (ZIF-8), is a new composite material. It consists of metal ions or clusters coordinated to often rigid organic molecules to form one-dimensional (1D), 2D, or 3D structures that can be porous.( Reference Batten, Champness, Chen, Garcia-Martinez, Kitagawa, Öhrström, O'Keeffe, Paik Suh and Reedijk 9 ) The chemical structure of ZIF-8 is shown in Fig. S5. It has been reported that MOF materials have a uniquely structured microporous frame with extraordinarily high pore structures.( Reference Batten, Champness, Chen, Garcia-Martinez, Kitagawa, Öhrström, O'Keeffe, Paik Suh and Reedijk 9 , Reference Tranchemontagne, Mendoza-Cortés, O'Keeffe and Yaghi 10 , Reference Gualino, Roques, Brandès, Arurault and Sutter 11 ) This pore structure has potential to enhance the active site surface area of the catalyst and lead to the increment of the ORR reactivity. Furthermore, this structure has high thermal stability at a temperature below 500 °C. It is also posted that the pore volume of ZIF-8 reached 0.68 cm3/g.( Reference Tanaka, Fujita, Miyake, Miyamoto, Hasegawa, Makino, Van der Perre, Cousin Saint Remi, Van Assche and Baron 12 ) Meanwhile, 99% of the specific surface area (SSA) in ZIF-8 is from the internal surface area. Therefore, the SSA of ZIF-8 can reach up to 2000 m2/g.( Reference Simmons, Wu, Zhou and Yildirim 13 )
The advantages of MOFs include high porosity, large SSA, high structural stability, and high thermal stability.( Reference Batten, Champness, Chen, Garcia-Martinez, Kitagawa, Öhrström, O'Keeffe, Paik Suh and Reedijk 9 – Reference Simmons, Wu, Zhou and Yildirim 13 ) There is a strong possibility that the structure of carbon-based catalysts with the small surface area or low porosity can be modified by additional carbon-based MOF component to change the catalytic performance. The relation between the Brunauer–Emmett–Teller (BET) surface area and the ORR activity of catalysts has been investigated in a paper published in 2013.( Reference Liang, Wei, Wu, Feng and Müllen 14 ) The research demonstrates that the catalytic activity of the same catalyst could be significantly enhanced by increasing the BET surface area of the support material. The reason is that the accessible component of active sites and the transport properties of ORR-relevant species, such as H+, e−, O2, or H2O, are determined by the SSA and the porous structure.( Reference Liang, Wei, Wu, Feng and Müllen 14 ) It is already known that doped-nitrogen elements in graphene structures have a likely effect on the ORR catalytic activity; and MOF structures also show an enhanced performance in a carbon composite with nitrogen elements in the structures.( Reference Hwang, Hong, Chang, Jhung, Seo, Kim, Vimont, Daturi, Serre and Férey 15 ) Therefore, modifying carbon-based catalysts with MOFs can be an effective approach to enhance the catalytic performance of catalysts.
This research focuses on the investigation of improving the electrochemical performance of N-G catalysts by changing the surface structure with the additional ZIF-8 component. The new catalyst, which is named N-G/MOF, is expected to have enhanced the SSA, porosity, and electrochemical performance. The application of precious metal catalyst is limited by the finite resources and cost constraints. But the efficiency of electrochemical systems or industrial production can be improved by applying inexpensive and high-performance N-G/MOF catalysts. This research will also play a pivotal role in the transition from the current low-efficient and emission-discharging “engine” society to a very effective and clean environmental energy society.
Research methodology
Synthesis section
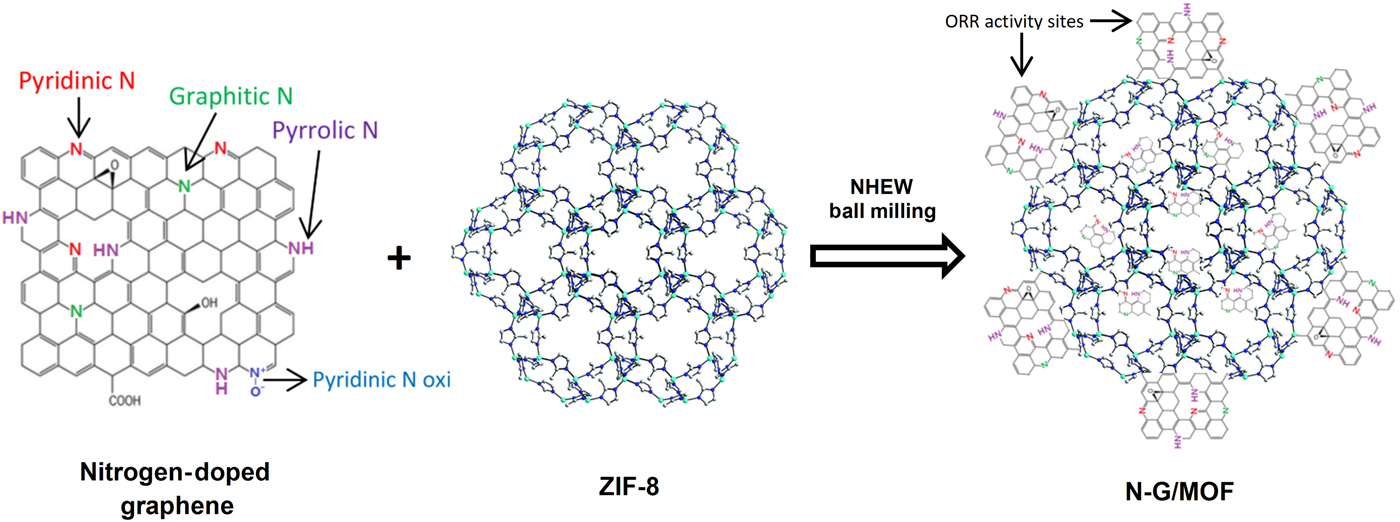
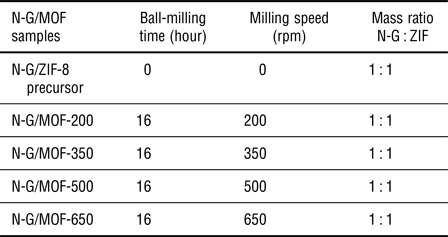
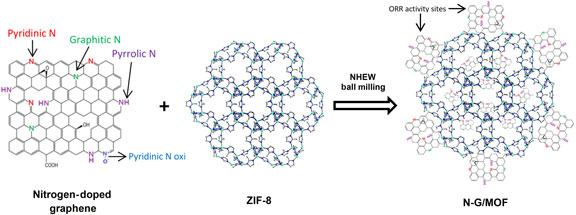
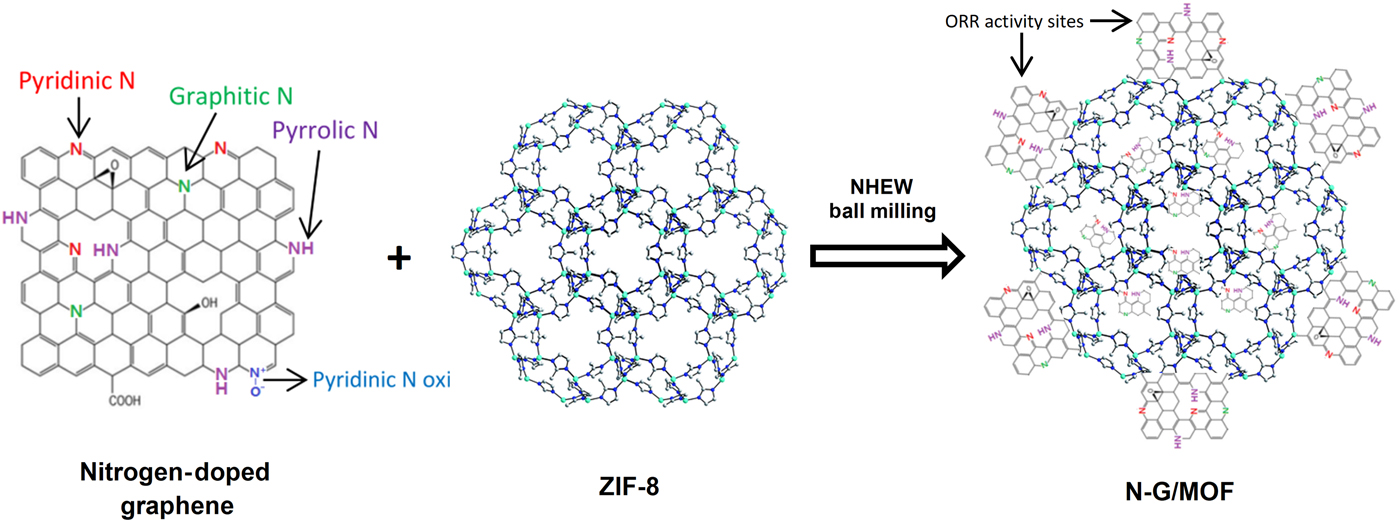
The N-G/MOF catalyst samples were synthesized by using N-G catalysts and ZIF-8 (Sigma-Aldrich St Louis, Missouri) as a raw material through the NHEW ball-milling method at the room temperature in the synthesis section. The synthesis was carried out in a planetary ball mill machine (PM100, from Retsch Newtown, Pennsylvania). The selected N-G catalyst sample (BM-N-G-16-500) was prepared by using graphene oxide and melamine as a reactant with 500 rpm grinding speed and 16 h NHEW ball-milling process at 22 °C.( Reference Zhuang, Lee, Lei, Nunna, Kuang and Zhang 7 ) Figure 1 shows the synthesis process of N-G/MOF catalysts. The primary integration process is as follows: First, N-G particles and ZIF-8 particles are mixed in the deionized water (7 mL) with a specific weight ratio (N-G : ZIF-8 = 1 : 1, N-G = 35 mg). The solution is dispersed by an ultrasonic cleaner (power: 75 W) to produce a well-dispersed precursor solution. The precursor solution (7 mL) is then moved to a stainless steel grinding jar (12 mL, inner diameter = 30 mm) with grinding balls (1.4–1.7 mm diameter, volume = 6 mL) made of zirconia. The materials are ground at a specific grinding speed for a particular grinding time to prepare N-G/MOF catalyst samples under 22 °C and the room condition. The final temperature of the ground solution is in the range of 40–60 °C. The unreacted melamine is dissolved in the solution at that temperature. The solution is centrifuged to remove soluble impurities after ball-milling process. The solid powders are dried in a vacuum oven after thrice centrifugation to obtain N-G/MOF catalysts. Four N-G/MOF catalysts were prepared under the same environmental condition and grinding time with different grinding speeds, respectively. The experimental conditions in this experiment are listed in Table I.
A sketch of the experimental synthesis process of N-G/MOF.
The list of three experimental conditions of N-G/MOF samples.

Characterization section
The synthesized N-G/MOF catalysts are characterized by several characterization approaches including the Zetasizer potential measurement, scanning electron microscope (SEM), transmission electron microscopy (TEM), BET autosorb surface area test, and rotating disk electrode (RDE) method to analyze the surface structure, particle size, surface area, pore size, porosity, and electrochemical properties.
Two-dimensional and 3D Microstructural Imaging—The synthesized N-G/MOF catalysts were imaged using SEM and TEM to observe the changes in the microstructure and surface properties such as surface area, particle size, pore size, and porosity.
Physical Characterization—The particle size of the synthesized N-G/MOF catalysts were characterized by Zetasizer. The SSA, pore size, and pore volume are measured by BET autosorb method. The ORR current density and electron transfer number of N-G/MOF catalysts are analyzed by RDE method.
This paper shows the results on (1) the successful synthesis of N-G/MOFs, (2) electron microscope imaging of the microstructure of N-G/MOFs, and (3) the analysis of physical characteristics of N-G/MOFs. The characterization results gave great insights into the investigation of using MOF to improve the electrochemical performance of N-G catalysts.
Results and discussion
Imaging of the surface structure
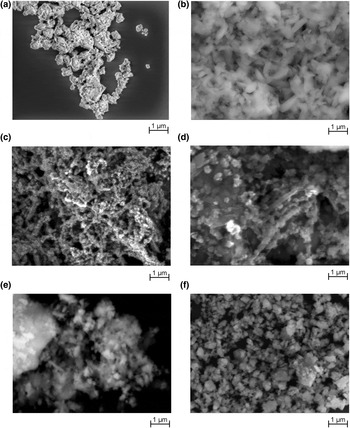
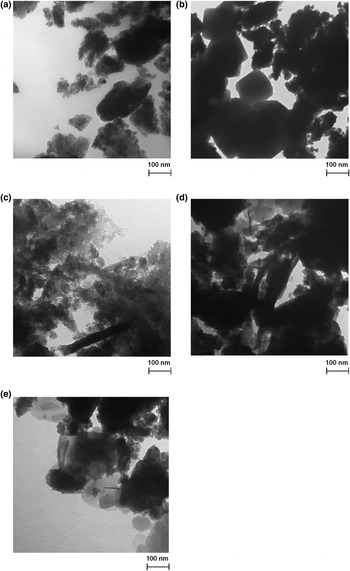
The influences of ZIF-8 on the physical structure and the nanostructure of the initial N-G catalyst are studied through the SEM and TEM imaging of the N-G, ZIF-8, and N-G/MOF samples. The SEM images at 1 µm scale of BM-N-G-16-500, ZIF-8, and four N-G/MOF samples are shown in Figs. 2(a)–2(f). It is observed from Fig. 2(a) that the particles in the N-G catalyst are amorphous, and Fig. 2(b) shows that ZIF-8 has a crystalline particle structure. Individual structures, which are mixtures of amorphous particles and crystalline particles, are observed in N-G/MOF-200 and N-G/MOF-350 from Figs. 2(c) and 2(d). Furthermore, Figs. 2(e) and 2(f) indicate that most of the particle structures of N-G/MOF-500 and N-G/MOF-650 are amorphous as well. The observations from Fig. 2 show that particle structure of the N-G/MOF is influenced by the grinding speed condition. N-G/MOFs with amorphous-/crystalline-like structures were generated when the grinding speed was 200 or 350 rpm. But the crystalline-like particles could be destroyed by NHEW ball milling when the grinding speed increased to 500 and 650 rpm. This phenomenon also is confirmed by TEM images in Figs. 3(a)–3(e) at 100 nm scale. Figure 3(a) shows the amorphous particle structure of the N-G sample. Meanwhile, the structural difference between N-G/MOF-200 and N-G/MOF-350 could be observed from Figs. 3(b) and 3(c). Figure 3(b) indicates that the amorphous particles and crystalline-like particles with cube shape are mixed together in N-G/MOF-200. The boundaries of amorphous particles and crystalline-like particles could be easily identified in the TEM images. But the cube-shape particles cannot be observed in the TEM images of other samples. Figure 3(c) shows that amorphous particles and crystalline-like particles with rod shape are mixed together in N-G/MOF-350. It is observed that the crystalline-like particles are surrounded by the small amorphous particles with the intimate surface connections. Some crystalline-like particles with thin rod shape can be observed in Fig. 3(d) as well, which is the TEM image of N-G/MOF-500. It is noticed that the shapes of the crystalline-like particles in N-G/MOF-350 and N-G/MOF-500 are significantly different from the crystalline-like particles in N-G/MOF-200. Furthermore, Figs. 2(f) and 3(e) show that most of the particles in N-G/MOF-650 are in the amorphous structure. It is concluded that the N-G and ZIF-8 particles could be decomposed and generate other structures by NHEW ball milling. The final structure of the N-G/MOF was influenced by the grinding speed.
SEM images of (a) BM-N-G-16-500, (b) ZIF-8, (c) N-G/MOF-200, (d) N-G/MOF-350, (e) N-G/MOF-500, and (f) N-G/MOF-650.

TEM images of (a) BM-N-G-16-500, (b) N-G/MOF-200, (c) N-G/MOF-350, (d) N-G/MOF-500, and (e) N-G/MOF-650.

Particle size characterization
The SEM and TEM images of N-G/MOF samples show that the structure of particles was modified through NHEW ball-milling process. It is also observed that the final structure of the N-G/MOF is related to the grinding speed condition. Therefore, a characterization of the particle size of N-G/MOFs was performed by Zetasizer potential measurement to investigate the influence of grinding speed on the particle size of N-G/MOF samples. The catalyst samples were dispersed in the deionized water and diluted to the concentration of 0.005 mg/mL for the Zetasizer potential test.
The measured particle sizes of the N-G/MOF samples are shown in Table II. It is observed that the final particle size of the N-G/MOF catalyst decreased with the increasing grinding speed at the same 16 h grinding time. The mechanism is that the ground material in the grinding jar can be destroyed to small particles and activated by the collision from the grinding media. The energy intensity of the collision energy depends on the grinding speed. The Zetasizer result shows that the collision energy performed by NHEW ball milling in this experiment can reduce the particle size of N-G/MOF material from 4 to 322.5 nm. Therefore, not only physical mixing but also chemical reactions can occur between N-G and ZIF-8 particles if the energy intensity of the collision satisfied the required activation energy of them. It is also observed that the relation between grinding speed and the final particle size is not linear. A substantial decrement of particle size is observed when the grinding speed increased from 0 to 200 rpm. But the decrement of particle size decreases with the increasing grinding speed. This phenomenon shows a limitation on the particle size reduction performed by NHEW ball milling. This limitation depends on experimental conditions such as jar size, grinding media size, and angular velocity ratio between the jar and the mill plate, etc.( Reference Zhuang, Nunna, Boscoboinik and Lee 8 ) Therefore, the grinding speed is one of the influencing factors of the final particle size of ground N-G catalysts. In another word, the generation of N-G/MOF catalyst by NHEW ball milling is a grinding speed-related process.
The Zetasizer result: particle sizes of N-G/MOF catalysts generated by different grinding speeds.

Surface area, pore size, and porosity characterization
The influence of ZIF-8 on the surface structure of the original N-G catalyst is studied through the properties of the surface structure including the BET surface area, pore size, and the porosity. The surface structure characterization of N-G, ZIF-8, and N-G/MOFs were performed with a BET Autosorb instrument from Quantachrome and with N2 as the adsorbate. The surface area was estimated from the BET equation, and the fitting of the N2 adsorption isotherms obtained using BET surface area analyzer with the quenched solid density functional theory (slit-pore geometry) available in the Quantachrome ASIQWin™ v6.1 software. For the measurement of pore size and porosity, the micropore is defined as a pore having the size ≤2 nm, the mesopore having the size between 2 and 50 nm, and the macropore as the size >50 nm. The porosity of the sample is represented by the pore volume, which is the volume of pores in the unit gram sample.
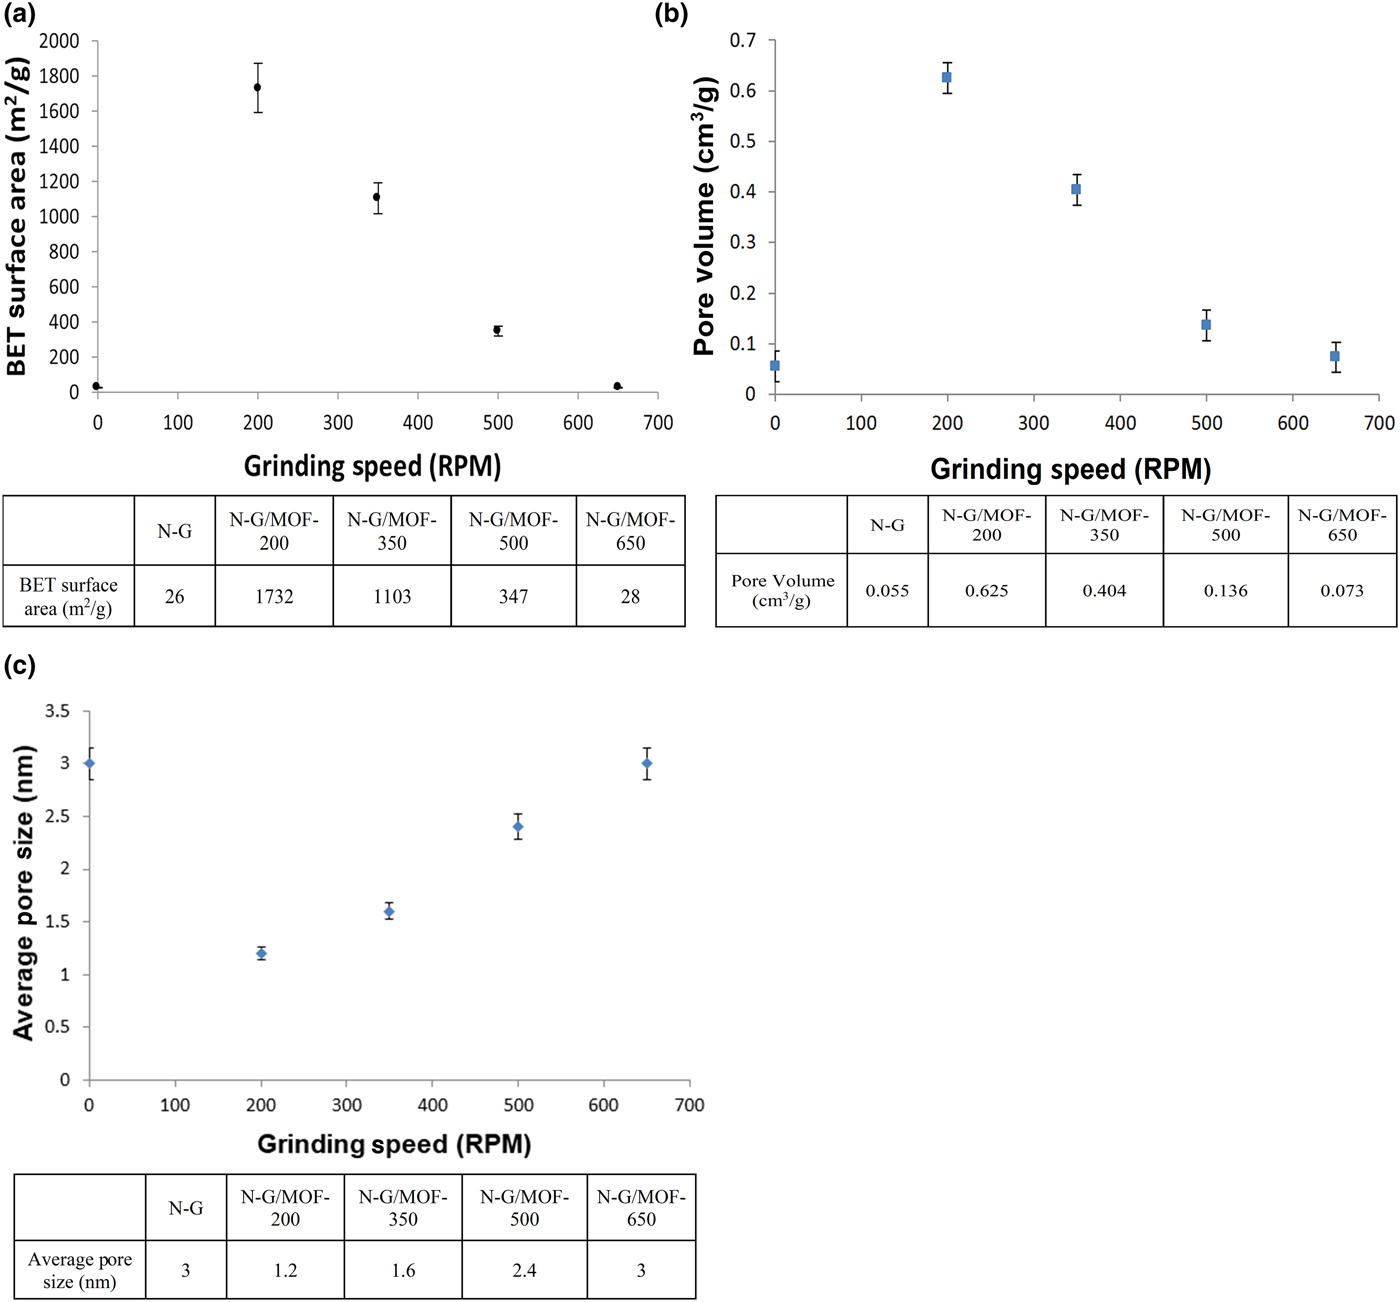
The comparison of the BET surface area, the pore volume between original N-G and N-G/MOFs, and the average pore size are shown in Figs. 4(a)–4(c), respectively. It is observed that three N-G/MOF samples have larger BET surface area than the BM-N-G-16-500 catalyst (26 m2/g). The maximum surface area, which is located at N-G/MOF-200, reaches to 1732 m2/g. It is also observed in Fig. 4(a) that the surface area of N-G/MOFs decreased from 1732 to 28 m2/g with the increasing grinding speed from 200 to 650 rpm. The final BET surface area of N-G/MOF-650 is already similar to the surface area of BM-N-G-16-500. It is noticed that the particle size of N-G/MOFs decreased with the increasing grinding speed as well. Meanwhile, Fig. 4(b) shows that the porosity of N-G/MOFs, which is represented by pore volume, decreased with the increasing grinding speed. Therefore, the mixture of 4 µm particles of ZIF-8 and BM-N-G-16-500 could be destroyed to nanoscale particles by NHEW ball milling with 200 rpm or higher grinding speed. It is concluded that the decomposition of the porous structure of N-G/MOFs is related to the grinding speed in NHEW ball-milling process. It is known that the BET surface area, pore size and pore volume of original ZIF-8 are 1800 m2/g, 1.2 nm, and 0.707 cm3/g (supplied by Sigma Aldrich). The porous structure of N-G/MOF-200 is similar to ZIF-8 because of the same pore size, and comparable BET surface area and porosity. It is also observed in Fig. 4(c) that the pore size of N-G/MOF catalyst increased to 1.6 nm when the grinding speed rose to 350. This observation confirmed that the microporous structure of N-G/MOF-350 is different with N-G/MOF-200 and original ZIF-8. The BET surface area and pore volume of new microporous N-G/MOF-350 are lower than N-G/MOF-200 but still higher than BM-N-G-16-500 catalyst. It is known that decreasing particle size leads to the increment of the external surface area of particles.( Reference Suttiponparnit, Jiang, Sahu, Suvachittanont, Charinpanitkul and Biswas 16 ) However, the BET surface area of N-G/MOFs reduced with the decreasing particle size in this experiment. The answer is that the BET surface area of a particle includes the external surface area and the internal surface area. The decreasing porosity leads to the decrement of the internal surface area( Reference Beaumont, Kondor, Plappert, Mitterer, Opietnik, Potthast and Rosenau 17 ); and the increment of the external surface area is much smaller than the decrement of the internal surface area in N-G/MOFs because most of the SSA in a porous structure with high porosity is the internal surface area. Therefore, the BET surface area of N-G/MOFs decreased with the decreasing porosity even though the particle size was decreasing.
(a) BET surface area of original N-G and four N-G/MOF samples with different grinding speeds, (b) the pore volume of original N-G and four N-G/MOF samples with different grinding speeds, and (c) average pore size of original N-G and four N-G/MOF samples with different grinding speeds.
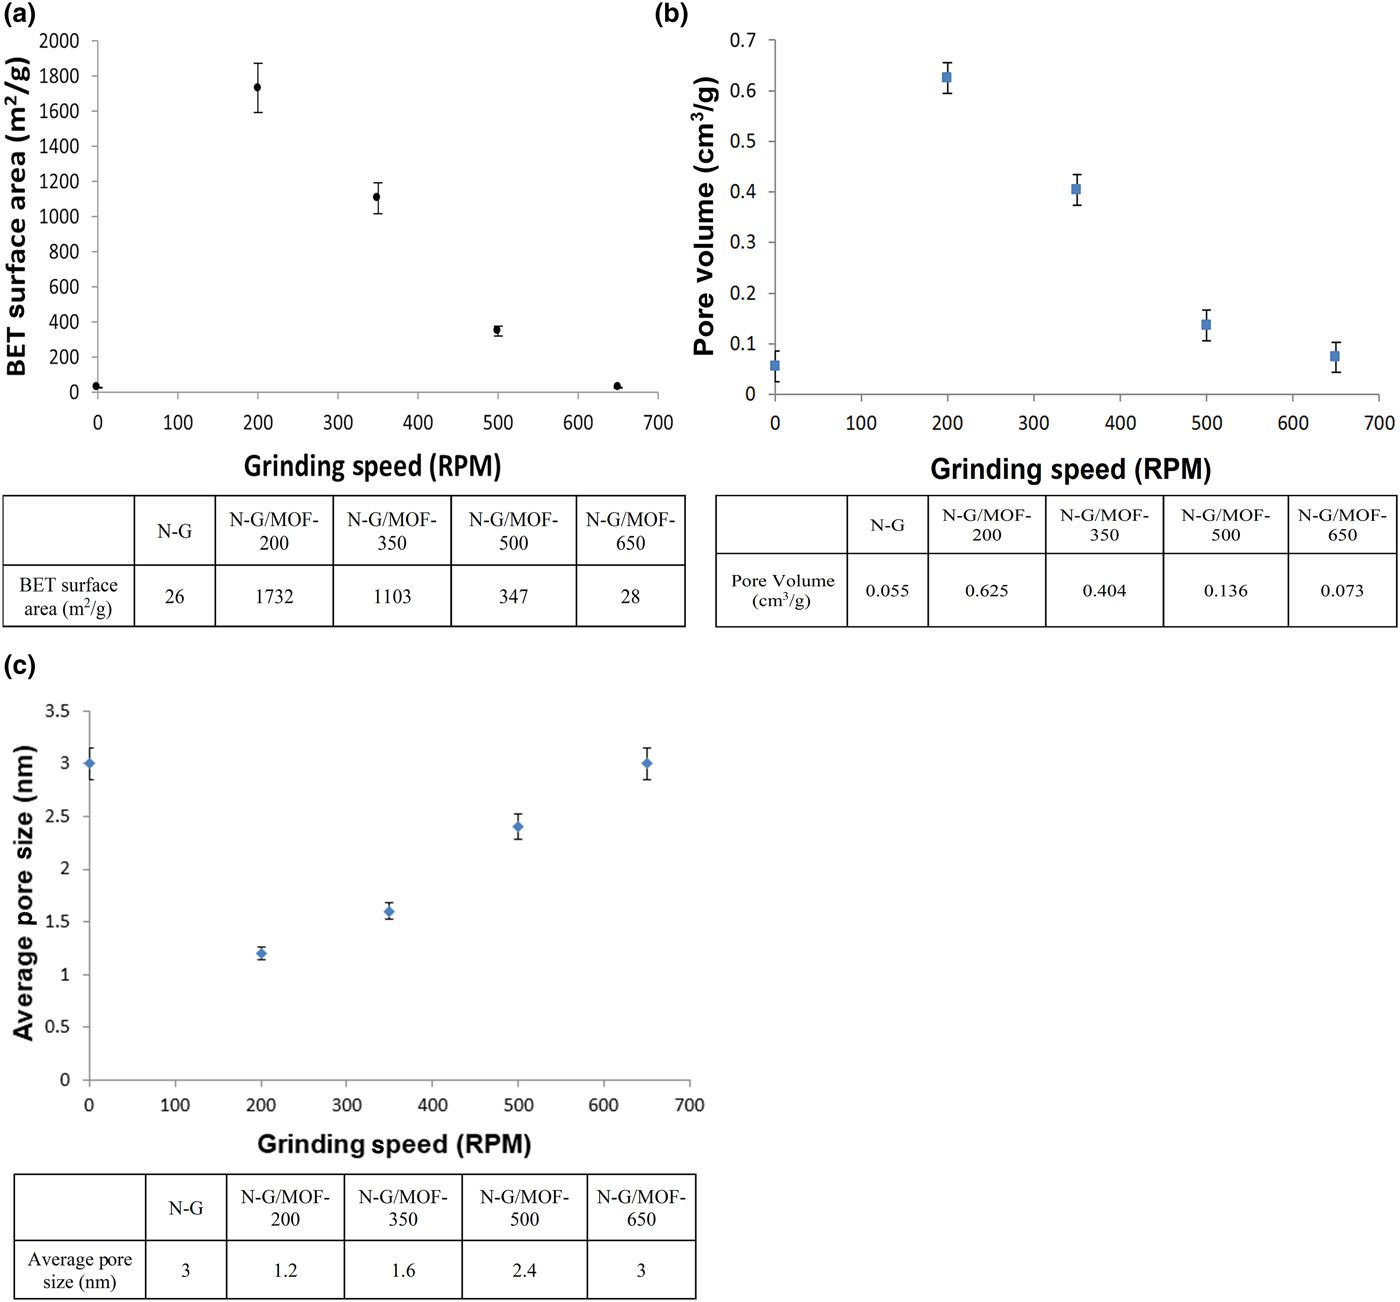
Fig. 4(c) shows that the final pore size of N-G/MOFs increased to 3 nm and the pore volume decreased to 0.073 cm3/g when the grinding speed increased to 650. It is also shown that the surface area, pore volume, and pore size of N-G/MOF-650 is similar to the BM-N-G-16-500 catalyst. Therefore, the porous structure of N-G/MOFs was almost decomposed by 650 rpm NHEW ball milling and changed to a nanoparticle structure which is similar to the original N-G catalyst. The changes in the BET surface area, pore volume, and pore size in N-G/MOFs show the decomposition process of N-G/MOF structure during NHEW ball milling. With the increase of grinding speed, the BET surface area of N-G/MOF gradually drops, while the average pore size has a small increment. Moreover, the pore volume trends for N-G/MOF follow the order of ZIF-8 > N-G/MOF-200 > N-G/MOF-350 > N-G/MOF-500 > N-G/MOF-650 > N-G, which is just like the BET surface area ranking. It is known that high pore volume indicates high porosity. Therefore, adding ZIF-8 can significantly increase the surface area of N-G. The porosity of N-G is increased as well, and the BET result is corresponding to the SEM and TEM imaging result.
Current density and electron transfer number characterization
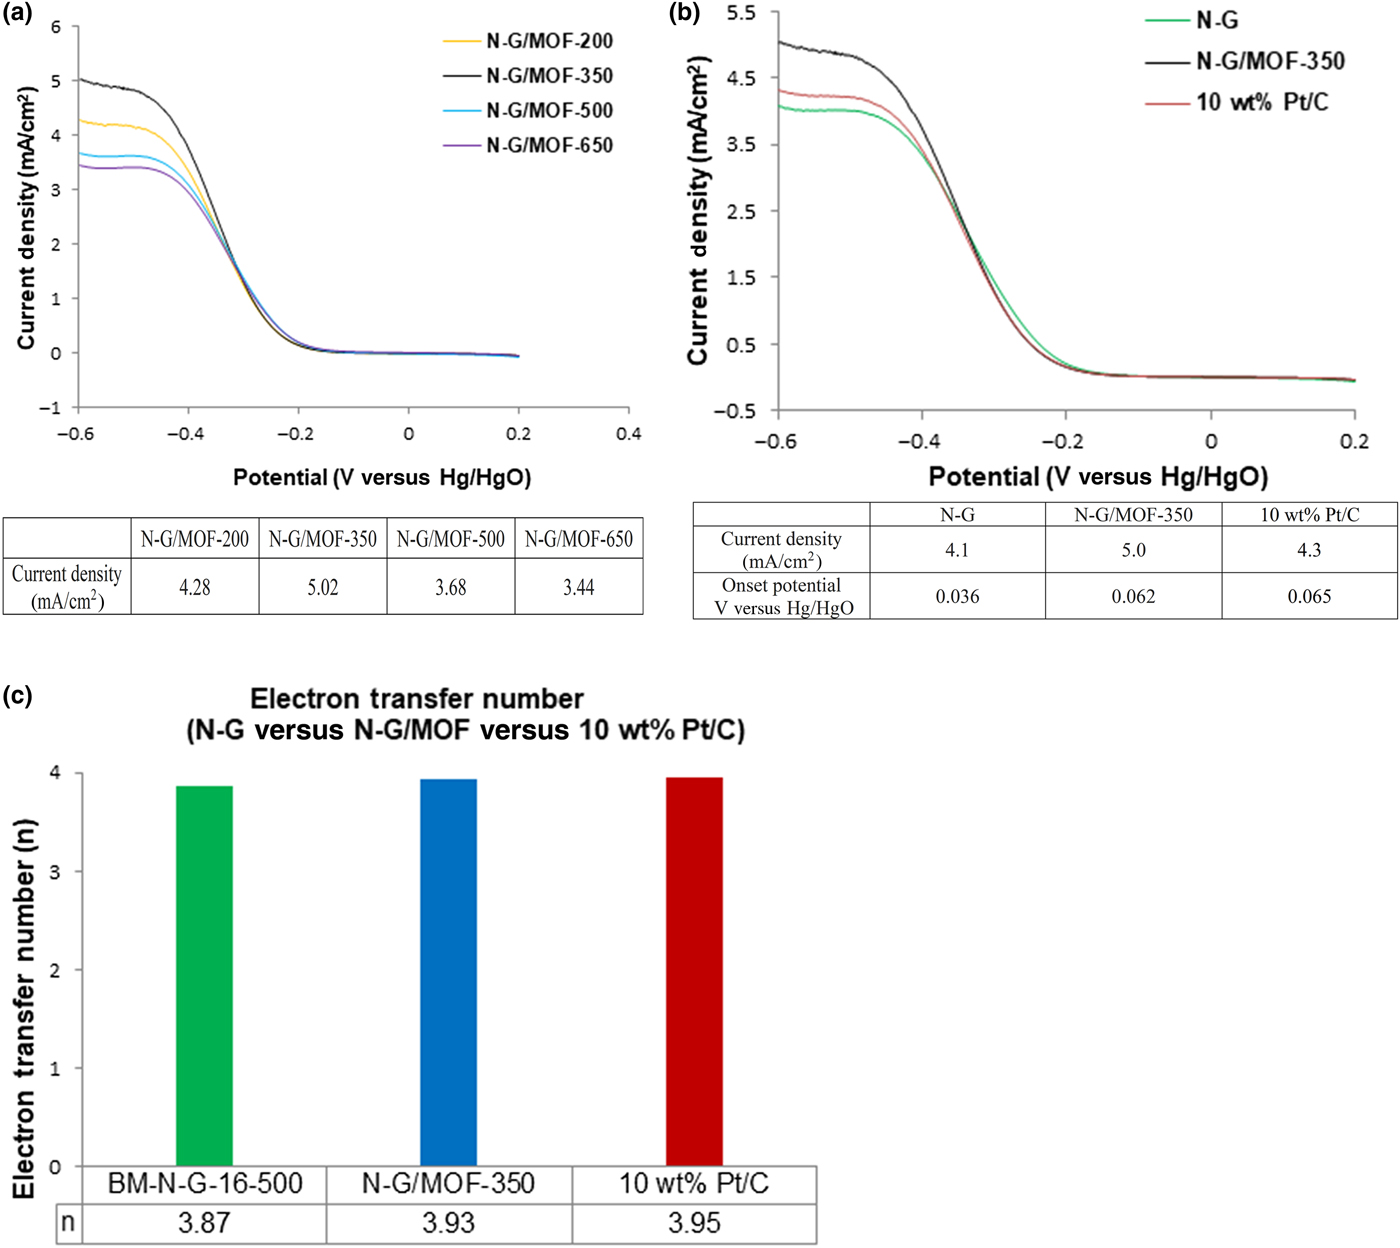
The electrochemical properties of N-G/MOF catalysts are characterized by RDE method. The concentration of the catalyst sample coated on the working disk electrode was 37.3 µg/cm2. The RDE experiment was performed with 0.5 M KOH as electrolyte and Hg/HgO as the reference electrode. The limiting current density to potential (J–V) curve of each sample was measured by linear sweep voltammetry method performed at 955 rpm rotation speed of the working electrode. The RDE results of four N-G/MOF samples are shown in Fig. 5(a). It is observed that the current density N-G/MOFs follows the order of N-G/MOF-350 (5.02 mA/cm2) > N-G/MOF-200 (4.28 mA/cm2) > N-G/MOF-500 (3.68 mA/cm2) > N-G/MOF-650 (3.44 mA/cm2), which is different with the BET surface area ranking and pore volume ranking. The RDE result of N-G/MOF-200, N-G/MOF-500, and N-G/MOF-650 confirms that the current density increased with the increased active surface area. But a counterexample is, the current density of N-G/MOF-200 is lower than N-G/MOF-350, even though the BET surface area and pore volume of N-G/MOF-200 are larger than N-G/MOF-350. This observation shows a possibility that not only the BET surface area, pore size, and pore volume but also other properties were influenced while BM-N-G-16-500 was modified by ZIF-8 by NHEW ball milling with 350 rpm grinding speed. It is known that the current density of the N-G catalyst can be influenced by the reaction rate of ORR on active sites as well( Reference Wang, Maiyalagan and Wang 1 , Reference Zhuang, Lee, Lei, Nunna, Kuang and Zhang 7 , Reference Zhuang, Nunna, Boscoboinik and Lee 8 ); and the reaction rate is related to the composition and the number of active sites, which consist of four special N functional groups, in the N-G catalyst.( Reference Zhuang, Nunna, Boscoboinik and Lee 8 ) The chemical characterizations of N-G/MOFs by x-ray photoelectron spectroscopy (XPS) in the Supplementary material show that the chemical structure of N active sites in N-G/MOF-200 is similar to the N-G/MOF precursor. It indicated that there was no significant change in the chemical structure of nitrogen active sites in N-G/MOF after NHEW ball-milling treatment with 200 rpm in 16 h. But the XPS result of N-G/MOF-350 shows significant changes in the N active sites. It indicated that specific N groups in imidazole moieties of ZIF-8 were decomposed and formed more pyrrolic N and pyridinic N ORR-active sites at 350 rpm NHEW ball-milling condition.( Reference Wei, Hao, Zhang and Li 18 , Reference Pan, Liu, Zhao, Wang and Lai 19 ) It leads to a higher reaction rate of ORR on N-G/MOF-350 compared with N-G/MOF-200. Therefore, the current density of N-G/MOF-350 could be higher than N-G/MOF-200, even though the surface area of N-G/MOF-350 is smaller than N-G/MOF-200.
RDE results of (a) current density-comparison among four N-G/MOF catalysts, (b) current density-comparison between BM-N-G-16-500, N-G/MOF-350, and 10 wt% Pt/C, and (c) electron transfer number-comparison between BM-N-G-16-500, N-G/MOF-350, and 10 wt% Pt/C.
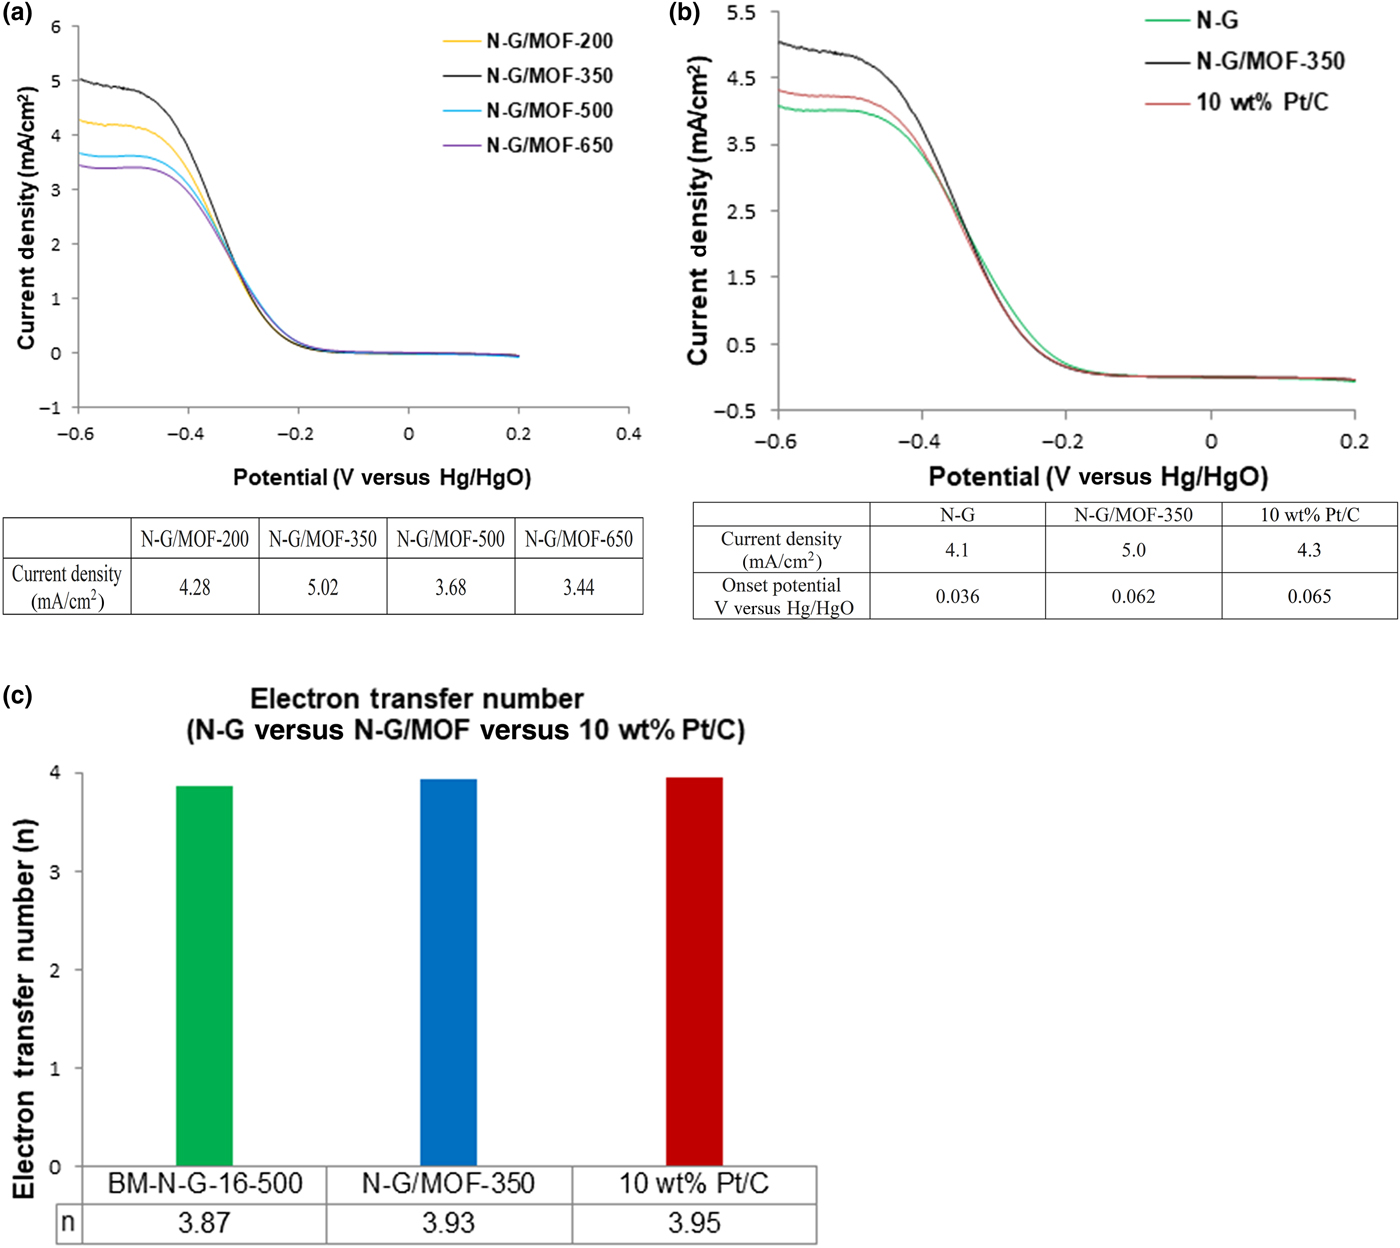
The modification of BM-N-G-16-500 catalyst with ZIF-8, which was performed under 350 rpm NHEW ball-milling condition, made the highest increment comparing with the original N-G's current density in this experiment. The comparison of the current density and the electron transfer number among the original N-G, N-G/MOF-350, and 10 wt% Pt/C catalysts are shown in Figs. 5(b) and 5(c), respectively. It is noticed that the total current density of N-G/MOF-350 (5.02 mA/cm2) is higher than 4.1 mA/cm2 of original N-G (4.1 mA/cm2), and even better than 4.3 mA/cm2 of 10 wt% Pt/C.( Reference Zhuang, Lee, Lei, Nunna, Kuang and Zhang 7 ) As well known, the total current density is directly related to not only the catalytic performance but also the full amount of active sites in the catalyst. The concentration of the overall loading mass of N-G/MOF and Pt/C, respectively, on the surface of the working electrode was fixed to 37.3 µg/cm2. It is already known that the original BM-N-G-16-500 is composed of 47.3 wt% of carbon, 24.2 wt% of nitrogen, and 28.5 wt% of oxygen.( Reference Zhuang, Lee, Lei, Nunna, Kuang and Zhang 7 , Reference Zhuang, Nunna, Boscoboinik and Lee 8 ) The formula of ZIF-8 (Basolite® Z1200) is C8H10N4Zn (provided by Sigma Aldrich). The elemental composition of ZIF-8 is 42 wt% of carbon, 25 wt% of nitrogen, and 33 wt% of other elements. All the N-G/MOF catalysts were synthesized by using 35 mg BM-N-G-16-500 and 35 mg ZIF-8 as raw materials. Therefore, the approximate elemental composition of N-G/MOF-350 is around 50 wt% of carbon, around 25 wt% of nitrogen, and around 25 wt% of other elements. The active sites of the N-G/MOF-350 catalyst are nitrogen functional groups with carbon atoms and distributed in the internal and external surface of the catalyst. However, the 10 wt% Pt/C catalyst is composed of 90 wt% carbon with weak catalytic activity and 10 wt% Pt only with major activity. Thus, the overall catalytic performance of all the active sites in 37.3 µg/cm2 of N-G/MOF-350 is larger than the 10 wt% Pt/C with the same overall mass concentration. Therefore, the current density of N-G/MOF-350 was higher than 10 wt% Pt/C with the given catalyst loading conditions. From an economical viewpoint, the raw material cost of Pt/C is much higher than the raw materials cost of N-G/MOFs. Therefore, using N-G/MOF as ORR catalyst is more economical than using the 10 wt% Pt/C catalyst.
The onset potential is another significant electrochemical parameter for the evaluation of the catalytic activity of catalysts. The definition of onset potential is the potential at which the catalyzed ORR current starts to appear. It is observed in Fig. 5(b) that the onset potential of N-G/MOF-350 is 0.062 V versus Hg/HgO, which is higher than 0.036 V versus Hg/HgO of BM-N-G-16-500 and comparable to 0.065 V versus Hg/HgO of 10 wt% Pt/C. Therefore, the catalytic activity of BM-N-G-16-500 was significantly increased after the MOF modification. On the other hand, the electron transfer number, which represents the catalytic activity of catalysts, was calculated by Koutecky–Levich equation based on the J–V curves of N-G/MOFs and RDE experimental parameters. The calculation results in Fig. 5(c) show that the electron transfer number of N-G/MOF-350 catalyst reached 3.93. It is already higher than the 3.87 of BM-N-G-16-500 and comparable to the 3.95 of 10 wt% Pt/C catalyst. The RDE results confirm that the N-G/MOF-350 catalyst exhibits better electrochemical and ORR catalytic performance than BM-N-G-16-500 catalyst; and the electrochemical performance of the N-G/MOF-350 is comparable to the 10 wt% Pt/C with the same mass condition. Therefore, using MOF to modify N-G by NHEW ball milling is an effective approach to enhance the electrochemical performance and ORR catalytic activity of N-G catalysts.
Conclusion
In summary, the research of the N-G catalyst shows a possibility to improve the electrochemical performance of N-G by changing the particle structure. Using the MOF material as an additive to modify N-G and form new N-G/MOF catalyst is investigated to achieve this purpose. The physical characterization result shows that the BET surface area and porosity of the initial N-G catalyst were significantly improved after the MOF modification; and the electrochemical characterization confirmed that the N-G/MOF catalysts with enhanced BET surface area and porosity performed higher current density, lower onset potential, and better electron transfer number than the original N-G catalyst. Especially, the N-G/MOF-350, which performed the best electrochemical performance in all N-G/MOFs, shows comparable catalytic performance with the 10 wt% Pt/C catalyst; and the current density of N-G/MOF-350 is already higher than the 10 wt% Pt/C. The analysis of the relation between physical properties of N-G/MOFs and grinding speed confirmed that the MOF modification of N-G catalyst is a grinding speed-related process. N-G catalysts have shown comparable ORR catalytic performance to 10 wt% Pt/C catalyst, while this work demonstrates that ZIF-modified N-G is also an excellent candidate for ORR in an alkaline medium.
Supplementary material
The supplementary material for this article can be found at https://doi.org/10.1557/mrc.2017.130
Acknowledgments
The authors acknowledge the financial support from New Jersey Institute of Technology (NJIT) as a research grant, and the sub-grant of NJIT Site of National Science Foundation (Grant ID 1450182), as well as the technical and instrumental support from Materials Characterization Laboratory at Otto York Center at NJIT, Laboratory for Surface Modification at Rutgers University, Microscopy and Microanalysis Research Laboratory at Montclair State University, and Advanced Science Research Center at City University of New York. The authors would like to thank the administrative support from the Department of Mechanical and Industrial Engineering at NJIT.