
Aluminum is a lightweight metal with the characteristics of low density, low price, high electrical conductivity, and high energy density. Aluminum and its alloys are widely used in many fields, especially in aerospace and household industries.Reference Abdel-Gaber, Abd-El-Nabey, Sidahmed, El-Zayady and Saadawy1,Reference Rosliza, Nik, Izman and Prawoto2 As one of the heat treatable aluminum–magnesium–silicon alloys, 6005 alloys having the advantage of moderate strength, excellent corrosion resistance, and good welding performance in atmosphere environment are widely used for high-speed trains, subway trains, automobile body, double-decker trains, and other industrial structural profiles at home and abroad.Reference Rosliza and Nik3 However, a major problem with the application of 6005 alloys is that its corrosion rate and mechanical properties deteriorate in moist and seawater environment. Thus investigating the corrosion behavior of the alloy is very important.
Most of the researchers believe that precipitation plays a significant role in corrosion of the 6000-series aluminum alloy. The main elements of the 6000-series aluminum alloys are Si and Mg, which are partly dissolved in the α-Al matrix and form the phase of Mg2Si. The precipitates can be controlled by heat treatments and artificial aging and also have a positive influence on the mechanical strength and hardness of the alloys. The precipitation of the equilibrium β(Mg2Si) phase will undergo a series of changes during the aging process. The precipitation sequence during aging in 6000-series aluminum alloys conforms to the general scheme described for the ternary Al–Mg–Si alloys: supersaturated solid solution (SSSS) → solute clusters → GP-Ι zones → β″ → β′ → β(Mg2Si).Reference Edwards, Stiller, Dunlop and Couper4–Reference Mrówkanowotnik7 With the rapid cooling from solution heat treatment temperature to room temperature, the SSSS is formed, and then the clusters of Mg and Si atoms form the GP-zones. Then, the fine needles of metastable β″ phase and the rod-shaped metastable β′ grow into matrix, and finally the equilibrium phase β is formed. It has been recognized that the excellent corrosion resistance of the aluminum alloy is attributed to the formation of a layer of the passive oxide film on the surface. The oxide film is thin, nonuniform, and noncoherent. Any accidental abrasion or other mechanical damages of the surface film is rapidly repaired. When it is exposed to the external environment which contains aggressive halide anions, especially chloride ions, the oxide film is destroyed and resulting in a localized corrosion. The corrosion resistance is closely related to the rate of formation and breakdown of the passive oxide film.Reference Chen, Li, He, Li and Lu8,Reference Prabhukhot9 The 6000-series aluminum alloys show higher possibility on localized corrosion. Nowadays, many previous studies focused on precipitation behavior and corrosion sensitivity of the 6000-series aluminum alloys and reached some significant conclusions. There are some factors such as grain size, grain structure, precipitates, and secondary phase particles which influence the corrosion resistance of the alloys.Reference Prabhukhot9 The corrosion potentials of the alloys tend to shift toward the negative direction with increasing aging time and also there are some differences in the different aging stages.Reference Braun10 Although several researchers have investigated various microstructural features responsible for corrosion in 6005 alloys, there has been a lack of general agreement on their corrosion mechanism. The corrosion behavior study of the 6005 alloy in NaCl solution is incomplete.
Recently, we have reported that the fine and uniformly distributed β′ precipitate phases surrounding the LPSO structures could improve the corrosion resistance of the Mg–Gd–Y–Zn–Zr alloy.Reference Zou, Chen and Chen11 Based on the results, we developed a new general corrosion theory which is called “precipitates coating dispersoids” to explain the corrosion behavior in different alloys. To investigate if the theory works in 6005 alloys, the present work investigates the effect of aging on the corrosion behavior of 6005 alloys in 3.5% NaCl solution in detail, with the aim of evaluating the corrosion property and understanding the relative corrosion mechanism. In this study, the corrosion behavior of the 6005 alloy was investigated by the method of electrochemical measures and it gains a better understanding of the corrosion mechanism. The corrosion morphology of the alloy was studied by using scanning electron microscopy (SEM) and transmission electron microscopy (TEM). In addition, energy dispersive X-ray spectroscopy (EDS) was conducted to explain the corrosion mechanism of the alloy in different aging stages.
I. EXPERIMENTAL
A. Specimens preparation
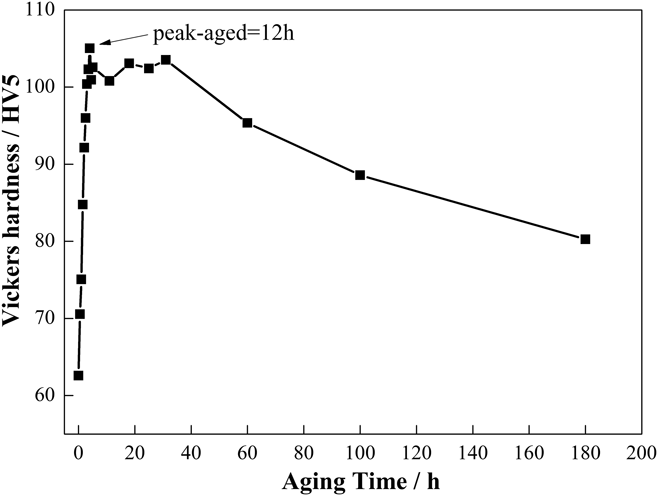
Plates of the 6005 alloy with a thickness of 1.0 mm were used in this experiment. Its main chemical compositions (mass fraction, %) are 0.75Si, 0.35Fe, 0.5Mg, Al balanced. The alloy was solution heat treated at 550 °C for 2 h, water quenched, and artificially aged at 175 °C for different times. According to the different aging times, the hardness curves of the alloy were drawn by using the HVS-30P Vivtorinox hardness tester (Shanghai Shangcai Testermachine Co., Ltd., Shanghai, China), as shown in Fig. 1.
Hardness curve of the 6005 alloy after artificial aging time at 175 °C.

B. Electrochemical measurements
To measure the effect of different aging times on the corrosion resistance of the 6005 alloy, the electrochemical measurements of the alloy have been tested in naturally aerated 3.5 wt% aqueous NaCl solutions (pH for all solutions was about 6.97) at room temperature (20 ± 1 °C) on the IviumStat (Ivium Technologies BV, Eindhoven, the Netherlands) electrochemical test system. This system is using a three-electrode cell, a saturated calomel electrode as the reference electrode, a platinum electrode as the counter electrode, and the specimen as the working electrode. The specimens were ground through successive grades of silicon carbide abrasive papers from P120 to P2000 followed by diamond finishing to 0.1 µm. Finally, the specimens were cleaned by acetone and alcohol, rinsed in distilled water, and then dried in warm air. The exposed working area of the specimen was about 1 cm2 and the other part was sealed with epikote. Each specimen was immersed into the 3.5 wt% NaCl solution about half an hour until a steady open circuit potential was presented. The polarization measurement was started at a scan rate of 1 mV/s and the scanning range from −1100 to −400 mV. It is important to remark that the use of very small scan rates is suggested to minimize the effects of distortion in Tafel slopes and current density, as reported in the literature.Reference Osório, Peixoto, Moutinho, Gomes, Ferreira and Garcia12–Reference Zaid, Saidi, Benzaid and Hadji14 Corrosion potential, corrosion rate, and corrosion current density were analyzed by Tafel plots using both the anodic and the cathodic branches.Reference Osório, Peixoto, Goulart and Garcia15 The electrochemical impedance spectroscopy (EIS) measurements were conducted over a frequency range of 105 Hz down to 10−1 Hz with an amplitude of 10 mV.
C. Immersion tests
Immersion test methods need to be as simple and easy as possible.Reference Davis16 The 15 × 10 × 1 mm specimens for the immersion tests were machined from sheets, mechanically ground and polished and then cleaned with acetone and deionized water. The corrosion medium was 3.5 wt% NaCl aqueous solution. It was prepared by analytical grade NaCl reagent (≥99.5 wt%) and deionized water. The corrosion time was two weeks and the numbered specimens were taken out from different beakers, respectively. The corrosion products were removed by using a solution of 2% CrO3 and 5% H3PO4 at 80 °C for about 5 min followed by final cleaning in the ethanol bath.Reference Jingling, Wen, Gengxin and Chunhua17
D. Microstructure and surface observation by using an electron microscope
The surface morphology of the corroded specimens was characterized using a VEGA 3 SEM (TESCAN) equipped with an EDS (X-Max-50, Oxford, England). SEM and EDS were conducted to analyze and identify the elements of the corrosion products. Microstructure observations of the specimens were made using a TEM. The specimens were prepared by grinding, polishing, and ion milling.
II. RESULTS AND DISCUSSION
A. Potentiodynamic polarization measurements
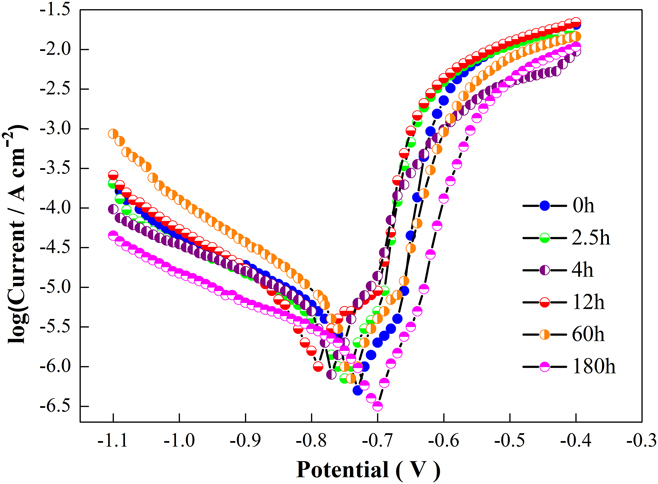
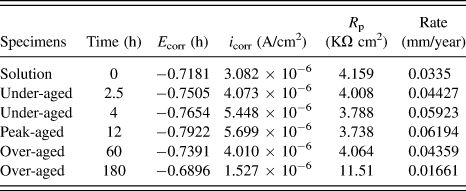
The corrosion potential (E corr) and corrosion current density (i corr) of specimens were obtained from Tafel plots using the Tafel extrapolation method, as shown in Fig. 2. The corresponding electrochemical parameters obtained from the polarization curves are given in Table I. There is a little difference in the polarization plots between the different specimens. The polarization resistance (R p), corrosion current density (i corr), and the corrosion rate were obtained in relation to aging time. Before the peak-aged condition, the value of polarization resistance (R p) reduced from 4.159 to 3.738 KΩ cm2. It presents the opposite tendency after the peak-aged condition. Similarly, the corrosion rate is increased from 0.0335 mm/year to 0.06194 mm/year and then drops down to 0.01661 mm/year. The results of the corrosion rate are in line with the results of the polarization resistance (R p). The polarization curves indicate that the corrosion potential shifts toward negative direction from solution condition to the peak-aged condition and it reverses the direction from peak-aged condition to the over-aged condition. It can be demonstrated that the corrosion resistance of the alloy at the peak-aged condition is worse than the other conditions. The results indicated that different aging times have a great influence on the 6005 alloy in the 3.5 wt% NaCl solution, especially for the peak-aged condition.
Potentiodynamic polarization curves for the 6005 alloy in 3.5 wt% NaCl at different aging times.

Electrochemical corrosion parameters of the 6005 alloy in 3.5 wt% NaCl solution.

B. EIS
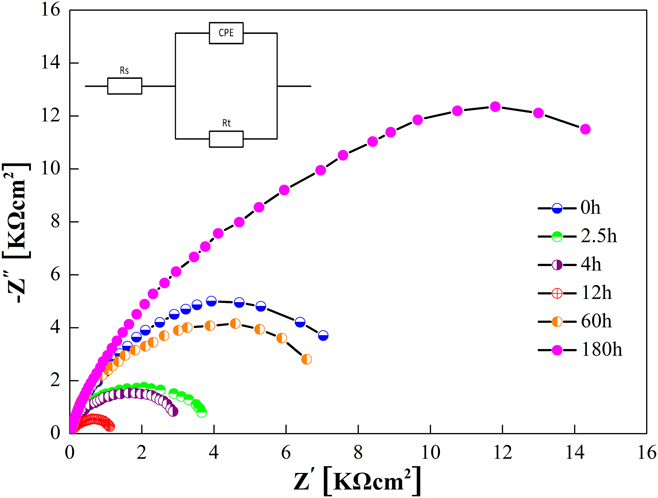
EIS test is a technique that provides some information on both the resistive and the capacity behavior of the interface, having the characteristics of the electrochemical reactions at the metal–electrolyte interface as well as the formation of the corrosion products. The Nyquist plots of the 6005 alloy in 3.5 wt% NaCl solution at different times are given in Fig. 3. It is clear from the figure that the impedance diagrams show single capacitive semicircle, revealing that the corrosion process is mainly controlled by the charge-transfer. The similar shape of the curves can be observed throughout the whole test process, indicating that almost no change in the corrosion mechanism occurred due to the immersion time.Reference Reis, Melo and Costa18 In the Nyquist plots, the semicircular arc curve reflects the resistance of the electron transfer process on the electrode surface. The larger the diameter of the semicircular arc, the greater the resistance is. The larger diameter means that the loss and gain of the electrons in the anode and cathode is become more difficult and also the alloy is not easy to dissolve, which results in corrosion rate decrease of the alloy. In Fig. 3, the diameters of semicircular arc decrease gradually with the aging time before the peak-aged condition and there is a reverse trend after the peak-aged condition. It can be inferred that the impedance decreased from the solution condition to the peak-aged condition and increased from the peak-aged condition to the over-aged condition.
Nyquist plots and equivalent circuit of the 6005 alloy in 3.5 wt% NaCl solution at different aging times.

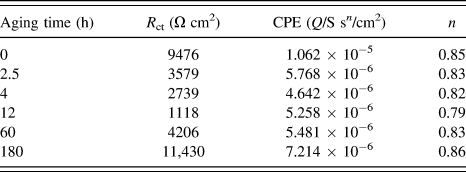
EIS data and equivalent circuit diagram are given in Table II and Fig. 3, respectively. To obtain better fitting results, the capacitance element which shows the double-layer capacitance is replaced by constant phase element (CPE), in parallel with CPE is the charge-transfer resistance (R ct) which is in series with the solution resistance (R s). The impedance of CPE is defined by the following equationReference Souto, Fernández-Mérida, González and Scantlebury19,Reference Zhang and Jow20 :
 $$Z\left( {jw} \right) = {\left( {{Y_{\rm{o}}}} \right)^{ - 1}}{\left( {jw} \right)^{ - n}}\quad ,$$
where Y o is the CPE-constant, j is the imaginary unit, n is the CPE-power (0 ≤ n ≤ 1), and w is the angular frequency (w = 2πf, f is the frequency). It is clear that the CPE is a pure capacitance when n is 1, as to the capacitance element, the derivation of n from the unit is subject to the influence of heterogeneous.Reference Jingling, Wen, Gengxin and Chunhua17
EIS data for the 6005 alloy in 3.5% NaCl solutions at different aging times.

The simulation values obtained by Z-view software for the equivalent elements are shown in Table II. In general, the higher R ct reflects a lower corrosion resistance when the exchange current is directly associated with the electrochemical process of corrosion.Reference Hong, Sun and Jepson21,Reference Sobral, Ristow, Azambuja, Costa and Franco22 According to the EIS data of Table II, it is clear that the peak-aged condition have the worst corrosion resistance.
C. Surface morphology of the corroded alloy
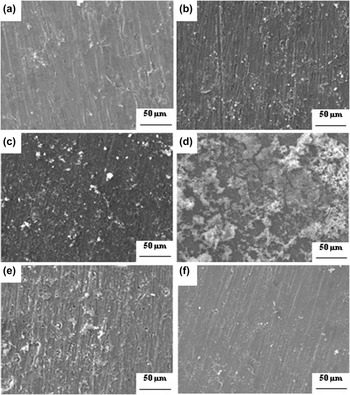
To have a better understanding of the evolution of the corrosion product layer after immersion test, SEM has been conducted to analyze the surface morphology of the alloy. The morphologies of the specimens after immersion in 3.5 wt% NaCl solutions at different aging times are shown in Fig. 4. As can be seen from Fig. 4(a), the sample shows a good corrosion resistance. As aging time increases, a large number of pitting corrosion occurred on the surface of the specimen, as shown in Fig. 4(b). When the aging time is up to 4 h [see Fig. 4(c)], the number and size of the pit has increased a lot and shows poor corrosion resistance. As shown in Fig. 4(d), a large amount of corrosion products is formed on the surface of the specimen in the peak-aged condition, the corrosion products have become dense and bulky. It shows the worst corrosion resistance of the alloy. When the aging time is beyond the peak-aged condition, the corrosion resistance of the alloy will be transformed into a positive direction. In the over-aged condition, the concentration of the corrosion products has decreased greatly and the pitting has become smaller step by step [Fig. 4(e)]. When the aging time is increased to 180 h [Fig. 4(f)], there is some small amount of pitting on the surface of the alloy, showing a typical uniform corrosion. It has the best corrosion resistance compared with the other conditions.
Corrosion morphologies of the three typical aging treatment states of the 6005 alloy after immersion in 3.5% NaCl solution for different time (a) solution treatment, 0 h; (b) under-aged, 2.5 h; (c) under-aged, 4 h; (d) peak-aged, 12 h; (e) over-aged, 60 h; (f) over-aged, 180 h.

D. EDS analysis
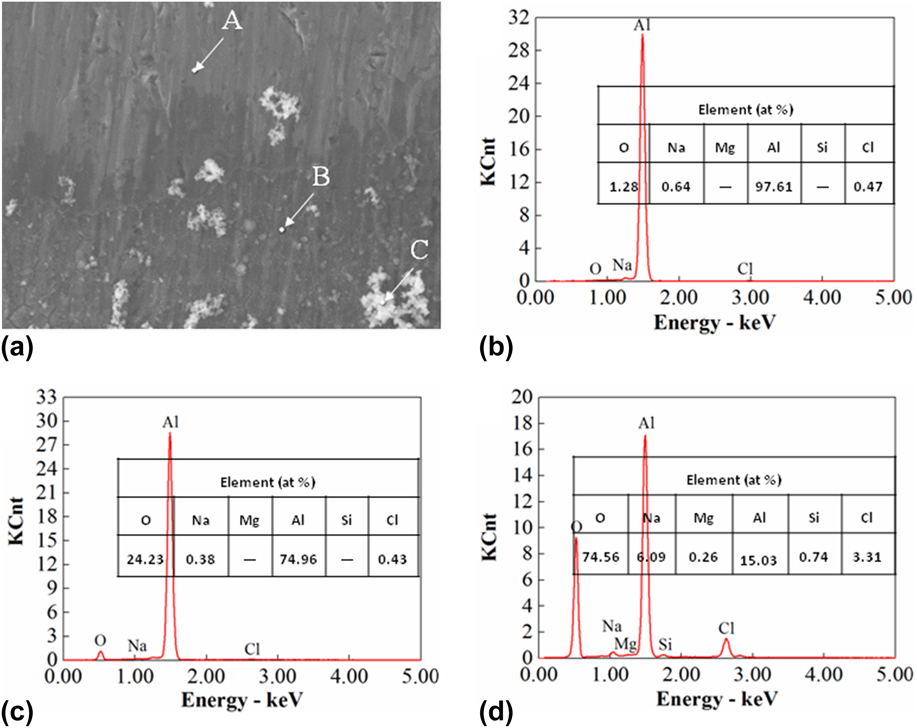
To explain the mechanism of different corrosion degree of the alloy, EDS analysis was conducted to analyze the chemical elements at the corroded areas of the surface. Figure 5(a) shows the corrosion morphologies and EDS analysis of the 6005 alloy after immersed in 3.5 wt% NaCl solution in the peak-aged condition. Figures 5(b)–5(d) are EDS spectra from areas A, B, and C in Fig. 5(a), respectively. It is clear that Al, O, Cl, and Na peaks can be detected in all areas, the element of Mg and Si only can be detected in the C area. Obviously, the area C of the alloy has the worst corrosion resistance. The at.% of the elements found in the selected area A was 1.28% O, 0.64% Na, 97.61% Al, and 0.47% Cl. It shows that the compounds formed in the area are mainly aluminum oxides and sodium chlorides. Similarly, the compounds formed in the area B are also the aluminum oxides and sodium chlorides. However, the thickness of the oxide film in area B is thicker than that in area A. The at.% of the elements found in the selected area C was 74.56% O, 6.09% Na, 0.26% Mg, 15.03% Al, 0.74% Si, and 3.31% Cl. It suggests that the elements of Mg and Si may be originated from the precipitates (Mg2Si). As aging time increases, the clusters of Si and Mg atoms are formed as coherent GP-zones in matrix and then very fine needles of the metastable β″ phase and rod-shaped metastable β′ are getting formed. Finally the product of decomposition is the equilibrium β(Mg2Si) phase.Reference Prabhukhot9 The Mg2Si phase is anodic to the Al matrix as reported in the literature.Reference Zeng, Wei, Jin-Feng, Chao-Xing, Tan, Zhang and Zheng23 The presence of the active phase (Mg2Si) deteriorates the corrosion properties by forming a galvanic cell with the surrounding Al matrix in the NaCl solutions.Reference Xu, Birbilis, Lashansky, Rometsch and Muddle24 Owing to the formation of microgalvanic corrosion, the area C of the alloy shows poor corrosion resistance. It indicates that the anodic phase (Mg2Si) and the surrounding Al substrate formed the microgalvanic cell, which accelerates the corrosion. However, such an outcome is undesirable for the results of potentiodynamic polarization measurement and EIS. Evidently, there must be other reasons for the change in the corrosion behavior.
(a) Corrosion morphologies and (b–d) EDS analysis of the 6005 alloy in the peak-aged condition after immersion in 3.5% NaCl solution, and (b), (c), and (d) are EDS spectra from area A, B, and C in (a), respectively.

E. Microstructure characterization
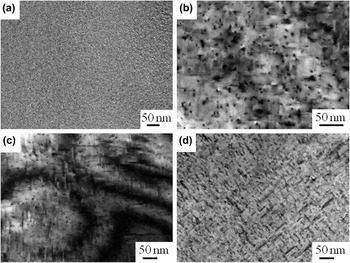
To understand the corrosion mechanism of the 6005 alloy more deeply, the microstructure of the alloy in different states is observed by TEM, as shown in Fig. 6. In Fig. 6(a), the precipitates could not be found in the crystal and the microstructure of the matrix exhibits good uniformity. The main elements of Si, Mg, and the other trace elements were completely redissolved into the matrix after solution treatment. It indicates that the alloy is in the state of SSSS. As there are few electrochemical potentials in the solution state, the alloy shows good corrosion resistance in the solution. In the process of transformation from solid solution to under-aged condition, some clusters of rich Mg atoms, Si atoms, or Mg–Si clusters have grown into GP-zones. These GP-zones were uniformly distributed in the matrix and have begun to transform slowly into the β″ precipitates, as shown in Fig. 6(b). With the formation of β″ precipitates, there are electrochemical potentials between the β″ precipitates and the Al matrix. It leads to the gradual decrease of the corrosion resistance of the alloy with increasing aging time. Further increasing the aging time to 12 h (peak-aged), a large number of fine and homogeneous needle-like precipitates with a diameter of about 2 nm were formed in the matrix, as shown in Fig. 6(c). It is assumed that the precipitate are mainly β′. At the same time, a great number of galvanic corrosion is formed between the precipitates and the matrix, resulting in the deterioration of corrosion resistance of the alloy. At the same time, precipitation forms with the characteristic of small size, high density, and chain distribution, which contributes to the formation of an anode corrosion channel, results in an increase in the corrosion rate.Reference Wang, Xu, Wang, Han and Dong25,Reference Yuan and Pehkonen26 In the over-aged condition at Fig. 6(d), certain precipitates with bigger size and darker contrast appear. It provides strong evidence that, in consideration of the hardness curves of the alloy, some equilibrium phase β is formed.
TEM images of the microstructures of specimens after aged at 550 °C for different times: (a) solution treatment, (b) under-aged, (c) peak-aged, and (d) over-aged.

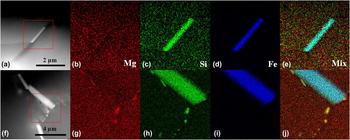
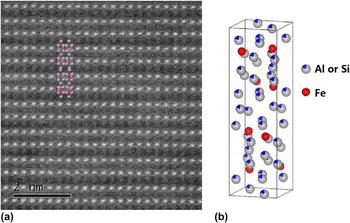
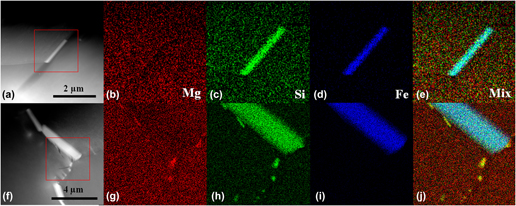
It can be found that there are a small amount of rod-like phases at the grain boundary, with size in the range from hundreds of nanometers to several micrometers. Figure 7 shows their typical high angle annular dark field scanning transmission electron microscopy (HAADF-STEM) images and EDS-mappings in the alloy of peak-aged and over-aged conditions. It is obvious that these phases enriched with elements of Fe and Si. Figure 8(a) shows the atomic-resolution HAADF-STEM image of the Fe-rich phases. The atomic columns displayed in Fig. 8(a) coincide well with the crystal model of β-Al4.5FeSi as viewed along the [010] direction. Its cell dimensions are a = 6.161(3), b = 6.175(3), c = 20.813(6) Å, β = 90.42(3)°.Reference Rømming, Hansen and Gjønnes27 Considering TEM and EDS analyses, the phase can be identified as β-Al4.5FeSi. Its three dimensional crystal structure is shown in Fig. 8(b). It is well known that the Fe-rich phases act as a cathode that can accelerate the localized corrosion of Al alloys by promoting fast anodic dissolution of the surrounding Al matrix and formation of a pit.Reference Nikseresht, Karimzadeh, Golozar and Heidarbeigy28,Reference Yasakau, Zheludkevich, Lamaka and Ferreira29 It is believed that the pitting corrosion in the alloy essentially is attributed to these phases as a result of galvanic coupling between the phase and the matrix. In addition, there are some smaller phases containing the elements of Mg and Si observed in the vicinity of the β-Al4.5FeSi phase in the over-aged alloy. It is obvious that the β-Al4.5FeSi was wrapped slowly by the precipitation of Mg2Si during aging, resulting in decrease of its exposed surface. With the increase of aging time, the exposed surface of the β-Al4.5FeSi decreases gradually. The β-Al4.5FeSi phases coated by Mg2Si precipitates may have same corrosion potentials as Mg2Si in the matrix. As a result, the coated β-Al4.5FeSi exhibits similar electrochemical behaviors to the coarse Mg2Si precipitates. Therefore, the improvement of corrosion resistance of the over-aged alloy may be attributed to the coating process of β-Al4.5FeSi phases by precipitates.
(a) HAADF-STEM image and (b–e) the corresponding EDS-mappings of alloys in the peak-aged and (f) HAADF-STEM image and (g–j) the corresponding EDS-mappings of alloys in the over-aged condition.

(a) Atomic-resolution HAADF-STEM image of β-Al4.5FeSi as viewed along the [010] direction and (b) three dimensional crystal structure of β-Al4.5FeSi.

III. CONCLUSIONS
In this paper, the effect of aging on corrosion behavior of the 6005 aluminum alloy immersed in a 3.5% NaCl solution was investigated. The results can be summarized as follows.
(1) The corrosion rate of the alloy increased with aging time; it reaches the maximum at the peak aging time and there is an opposite trend at the over aging time.
(2) The potentiodynamic polarization measurements proved that the corrosion resistance of the alloy at the peak-aged condition is worse than the other conditions, and the corrosion rate and the corrosion current density of the alloy reached up to the maximum level.
(3) Fe-rich phases at the grain boundary are identified as β-Al4.5FeSi phases by atomic-resolution HAADF-STEM and EDS-mapping analyses.
(4) The improvement of corrosion resistance of the over-aged alloy may be attributed to the coating process of β-Al4.5FeSi phases by precipitates. It provides strong evidence for the validity of the “precipitates coating dispersoids” corrosion theory in the 6005 alloy.
ACKNOWLEDGMENT
This research is supported by open fund of the State Key Laboratory of Refractories and Metallurgy (Grant No. G201702).