Introduction
Since the seminal studies of Armand de Ricqlès (Ricqlès Reference Ricqlès1968a,Reference Ricqlèsb, Reference Ricqlès1983), bone histology has proven to be an invaluable tool in understanding the biology of sauropod dinosaurs, providing insights into growth rates, species determination, and age of these unique dinosaurs (Sander Reference Sander2000; Erickson Reference Erickson2005; Sander et al. Reference Sander, Mateus, Laven and Knötschke2006, Reference Sander, Klein, Stein and Wings2011; Griebeler et al. Reference Griebeler, Klein and Sander2013; Stein and Prondvai Reference Stein and Prondvai2014). Fossil bone histology plays a major role in determining whether different body sizes reflect ontogenetic or taxonomic differences. Morphological data are, in many cases, insufficient to determine whether small-sized fossil animals are juveniles or different, smaller adult forms (Sander et al. Reference Sander, Mateus, Laven and Knötschke2006; Klein and Sander Reference Klein and Sander2008; Griebeler et al. Reference Griebeler, Klein and Sander2013). Bone histology, however, changes through ontogeny, and juveniles can usually be differentiated from adult forms.
Skeletochronology, the study of growth lines in bone, is one of the few disciplines that allows individual age estimation in vertebrates (Castanet Reference Castanet1994). Many authors have estimated the age of dinosaurs by calculating missing lines of arrested growth (LAGs) or estimating bone apposition rates (Curry Reference Curry1999; Sander and Tückmantel Reference Sander and Tückmantel2003; Erickson et al. Reference Erickson, Makovicky, Currie, Norell, Yerby and Brochu2004; Horner and Padian Reference Horner and Padian2004; Bybee et al. Reference Bybee, Lee and Lamm2005; Klein and Sander Reference Klein and Sander2007; Wings et al. Reference Wings, Sander, Tütken, Fowler and Sun2007; Griebeler et al. Reference Griebeler, Klein and Sander2013). In contrast to those of most dinosaurs (including more basal sauropodomorphs), the highly vascularized long bones of sauropods usually do not exhibit annual cycles, although some sauropods do have LAGs late in ontogeny. In some adult sauropods, rest lines can be observed in a thin peripheral layer of avascular bone in the outermost cortex, known as the external fundamental system (EFS) (sensu Ham Reference Ham1953). The EFS indicates that the animal attained full size. However, the annual character of the rest lines within the EFS is not confirmed because of their compactness (Sander et al. Reference Sander, Klein, Stein and Wings2011; Griebeler et al. Reference Griebeler, Klein and Sander2013). The general lack of annual cycles makes age estimation in sauropods from their long bones difficult (Sander et al. Reference Sander, Klein, Stein and Wings2011). The lack of growth marks in long bones does, however, suggest that sauropods grew relatively quickly without any major slowdown in growth for noticeably long periods (Sander et al. Reference Sander, Klein, Stein and Wings2011; Klein et al. Reference Klein, Sander, Stein, Le Loeuff, Carballido and Buffetaut2012; Waskow and Sander Reference Waskow and Sander2014). The incomplete expression of growth marks in long bones is corroborated by their presence in ribs of the same individual, where they provide a much better age estimate than the long bones (Waskow and Sander Reference Waskow and Sander2014). The disadvantage of using ribs for aging is that body size cannot be estimated from ribs. This means that a rib to be used for aging needs to be associated with at least a single propodial (humerus or femur). In addition, the growth record preserved in a given rib cannot be used to construct a growth curve for the individual the rib is derived from, because local appositional growth is not only related to overall body size increase but also to local morphogenesis (Waskow and Sander Reference Waskow and Sander2014).
Histologic Ontogenetic Stages (HOS)
Despite the common absence of LAGs in sauropod long bones, histological changes can be used to determine the relative maturity of an individual. These histological changes were documented by Klein and Sander (Reference Klein and Sander2008), who developed histological ontogenetic stages. There are 13 histological ontogenetic stages, based on bone tissue type (e.g., fibrolamellar bone), organization of vascular canals, degree of vascularization, presence of primary osteons, presence of growth marks, the appearance of the EFS, and to a limited extent, the degree of Haversian bone development. A fourteenth HOS was established by Stein et al. (Reference Stein, Csiki, Rogers, Weishampel, Redelstorff, Carballido and Sander2010) for the dwarf titanosaur Magyarosaurus. Klein and Sander (Reference Klein and Sander2008) concluded that sexual maturity was generally attained around HOS 8, coinciding with a decrease in vascularization and an assumed decrease in growth rate. They also concluded that a close relationship of body size and HOS indicates a lack of developmental plasticity, similar to modern mammals and birds.
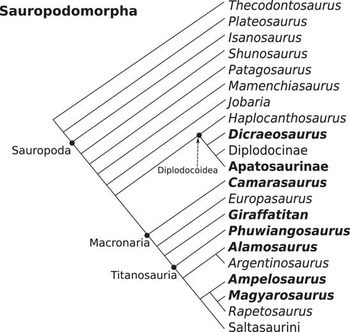
The histological ontogenetic stages were originally established for growth series of basal Macronaria and Diplodocoidea (e.g., Apatosaurus, Camarasaurus). Since then, the histological ontogenetic stages have also been applied to titanosaurs (Klein et al. Reference Klein, Sander and Suteethorn2009; Woodward and Lehman Reference Woodward and Lehman2009; Stein et al. Reference Stein, Csiki, Rogers, Weishampel, Redelstorff, Carballido and Sander2010; Company Reference Company2011; Klein et al. Reference Klein, Sander, Stein, Le Loeuff, Carballido and Buffetaut2012; Ghilardi et al. Reference Ghilardi, Aureliano, Duque, Fernandes, Barreto and Chinsamy2016), an indeterminate mamenchiasaurid, and Plateosaurus engelhardti, a basal sauropodomorph (Griebeler et al. Reference Griebeler, Klein and Sander2013). In general, the titanosaurs all show an atypical type of primary bone, termed “modified laminar bone” (Klein et al. Reference Klein, Sander, Stein, Le Loeuff, Carballido and Buffetaut2012) and different amounts of remodeling, with the exception of Alamosaurus (Woodward and Lehman Reference Woodward and Lehman2009; Klein et al. Reference Klein, Sander, Stein, Le Loeuff, Carballido and Buffetaut2012) and an indeterminate titanosaur from Brazil (Ghilardi et al. Reference Ghilardi, Aureliano, Duque, Fernandes, Barreto and Chinsamy2016), which had similar histology to Macronaria and Diplodocoidea (Fig. 1). Magyarosaurus, as described by Stein et al. (Reference Stein, Csiki, Rogers, Weishampel, Redelstorff, Carballido and Sander2010), showed extreme cortical remodeling within a growth series, which did not conform to the normal histology of other sauropods. The smallest bone in the series was still placed at HOS 12. Many of the large individuals had several generations of secondary osteons, up to three or four. This is why the additional HOS, HOS 14, was added to differentiate between highly remodeled bone with more than one generation in the outer cortex and moderately remodeled bone, which only had one generation in the outer cortex. This first attempt to differentiate between generations of secondary osteons inspired the establishment of the remodeling stages in the current work.
Phylogenetic relationships of Sauropodomorpha after Wilson (Reference Wilson2002), Sander (Reference Sander2013), and Tschopp et al. (Reference Tschopp, Mateus and Benson2015). Taxa used in this study are in boldface type.

In most cases in sauropods, after the EFS has been deposited, bone remodeling continues to extend into the entire cortex, destroying any previously deposited primary bone and all its histological features. Therefore, once old age is reached, secondary osteons are the only remaining histological feature. Because of the lack of primary bone, old individuals have not been studied in detail, as they are assumed to be less informative about ontogeny. To understand growth rates, age, and sexual maturity, most researchers have focused on juveniles, with rapid growth, and their transition to adults, with markedly slowed-down growth, as indicated by decreased vascularization and the EFS.
Haversian Bone Formation
Haversian or remodeled bone is deposited in units called secondary osteons (Gross Reference Gross1934; Francillon-Vieillot et al. Reference Francillon-Vieillot, de Buffrénil, Castanet, Géraudie, Meunier, Sire, Zylberberg and de Ricqlès1990) in areas where tissue has previously been resorbed. It is very common in large dinosaurs, medium to large mammals, and many birds (Chinsamy-Turan Reference Chinsamy-Turan2005). In the formation of secondary osteons, two cellular components, osteoclasts and osteoblasts, interact dynamically in discrete packets known as a basic multicellular unit (Frost Reference Frost1969). Osteoclasts are responsible for the resorption of bone, whereas osteoblasts are responsible for the deposition of new bone to replace the resorbed bone (Parfitt Reference Parfitt1994; van Oers et al. Reference van Oers, Ruimerman, Tanck, Hilbers and Huiskes2008). Remodeling in compact bone begins when osteocytes send signals for the need for remodeling by emitting proteins and other factors (Bonewald Reference Bonewald2011). An activation sequence is initiated in which preosteoclasts are recruited to the site and fuse into multinucleated osteoclasts (Jaworski et al. Reference Jaworski, Duck and Sekaly1981; Parfitt Reference Parfitt1994). Upon arrival, the osteoclasts begin tunneling through bone, resorbing the mineral and collagen in what is referred to as the cutting cone (Parfitt Reference Parfitt1994). Following the osteoclasts is a reversal zone, with cells that deposit a cementing substance, visible as the cementing line in cross section, which surrounds the osteon. The osteoblasts then centripetally deposit bone lamellae, termed the closing cone (Parfitt Reference Parfitt1994). The vascular space in the center, the Haversian canal, is then filled with blood vessels, connective tissue, and nerves (Parfitt Reference Parfitt1994). Some osteoblasts will become buried within the matrix they are secreting and become osteocytes. They are usually visible as small, black, flattened to plump shapes in thin section, connected to each other by a network of canaliculi that allows for communication and the exchange of nutrients. The remainder of the osteoblasts will either die or become lining cells (Francillon-Vieillot et al. Reference Francillon-Vieillot, de Buffrénil, Castanet, Géraudie, Meunier, Sire, Zylberberg and de Ricqlès1990; Parfitt Reference Parfitt1994). In cross section, secondary osteons have a round to oval appearance, and osteocyte lacunae and individual concentric lamellae are usually visible. Secondary osteons are aligned along the dominant loading direction, suggesting that they are mechanically regulated (Ascenzi and Bonucci Reference Ascenzi and Bonucci1967, Reference Ascenzi and Bonucci1968; van Oers et al. Reference van Oers, Ruimerman, Tanck, Hilbers and Huiskes2008). Additionally, secondary osteon formation is primarily associated with fatigue damage and microcracks (Burr et al. Reference Burr, Martin, Schaffler and Radin1985; Mori and Burr Reference Mori and Burr1993; Bentolila et al. Reference Bentolila, Boyce, Fyhrie, Drumb, Skerry and Schaffler1998; Martin Reference Martin2000). Primary osteons, by contrast, form by deposition of bone on a preexisting surface; resorption is absent in the process. As this study only addresses secondary osteons, we will mostly refer to them as “osteons.”
In long bones, as the animal grows and the cortex thickens, the innermost cortex is resorbed, resulting in medullary cavity expansion. This optimizes the weight and strength of the bone. In sauropods, as with other dinosaurs, while the medullary cavity is expanding, osteons begin to form in the innermost cortex and, through ontogeny, extend toward the outer cortex. This process continues until the animal dies, leading to crosscutting osteons (Haversian tissue formation) (e.g., Horner et al. Reference Horner, de Ricqlès and Padian2000; Stein et al. Reference Stein, Csiki, Rogers, Weishampel, Redelstorff, Carballido and Sander2010; Klein et al. Reference Klein, Sander, Stein, Le Loeuff, Carballido and Buffetaut2012; Werning Reference Werning2012; Mitchell and Sander Reference Mitchell and Sander2014). Remodeling rates vary between animals, but in sauropods, cortical remodeling usually does not start until later in ontogeny; secondary osteons appear usually around HOS 6–8. Presumably, this is when the individuals are becoming sexually mature (Klein and Sander Reference Klein and Sander2008). However, Curry Rogers et al. (Reference Curry Rogers, Whitney, D’Emic and Bagley2016) noted evidence of secondary osteons in a titanosaur perinate (Rapetosaurus krausei), and the entire ontogenetic series of the titanosaur Magyarosaurus is remodeled with secondary osteons (Stein et al. Reference Stein, Csiki, Rogers, Weishampel, Redelstorff, Carballido and Sander2010). This is not the case for all titanosaurs, Alamosaurus being a notable exception (Woodward and Lehman Reference Woodward and Lehman2009). In fully grown specimens (as indicated by the presence of an EFS), sauropods show nearly complete remodeling of primary bone (Ricqlès Reference Ricqlès1980; Klein and Sander Reference Klein and Sander2008, Mitchell and Sander Reference Mitchell and Sander2014).
Age Determination and Forensic Science
The strongest line of evidence for correlating age with the development of Haversian tissue comes from the field of forensic science. Bone histology has proven to be a useful tool in helping uncover the age of individual human remains. Although histological studies on humans had been done for well over a century, Kerley (Reference Kerley1965) was the first to determine the age of human bone using histology. His method, known as the Kerley method, involves counting the number of secondary osteons, secondary osteon fragments (parts of older osteons in the interstices of younger osteons, also known as interstitial lamellae), and non-Haversian canals, and estimating the amount of primary lamellar bone in four regions of the outer cortex of the midshaft of femora, tibiae, and fibulae. A regression analysis of 126 individuals, from birth to 95 years of age, allowed the age at death to be estimated within 10 years 95% of the time. Secondary osteons and osteon fragments were shown to be much more correlative to age than primary lamellar bone and non-Haversian canals (Kerley Reference Kerley1965; Kerley and Ubelaker Reference Kerley and Ubelaker1978). Several other researchers have subsequently adopted and modified this method (e.g., Ahlqvist and Damsten Reference Ahlqvist and Damsten1969; Singh and Gunberg Reference Singh and Gunberg1970; Thompson Reference Thompson1979; Samson and Branigan Reference Samson and Branigan1987; Walker et al. Reference Walker, Lovejoy and Meindl1994; Thomas et al. Reference Thomas, Stein, Feik, Wark and Clement2000; Streeter Reference Streeter2010). Similar to Kerley, most studies relied on the density of Haversian bone and primary bone. Further research was done on whether histology varied in different ethnic groups and by gender (e.g., Richman et al. Reference Richman, Ortner and Schulter-Ellis1979; Burr et al. Reference Burr, Ruff and Thompson1990), while other studies focused on different aspects of remodeling, such as size and shape of secondary osteons (Britz et al. Reference Britz, Thomas, Clement and Cooper2009; Castrogiovanni et al. Reference Castrogiovanni, Imbesi, Fisichella and Mazzone2011). A few studies on modern nonhuman mammals and comparative works on different taxa have been done to assess aging in different species (e.g., Wu et al. Reference Wu, Schubeck, Frost and Villanueva1970; Havill Reference Havill2003; Mulhern and Ubelaker Reference Mulhern and Ubelaker2003; Hillier and Bell Reference Hillier and Bell2007). As evidenced by work with humans, which like sauropods, lack distinctive growth marks and have strong remodeling, bone histology can be used to determine age. The extent to which Haversian bone can be used as an ontogenetic indicator for sauropods is tested here using several sauropod growth series.
Institutional abbreviations: BYU, Museum of Earth Sciences, Brigham Young University, Provo, Utah, U.S.A.; CM, Carnegie Museum of Natural History, Pittsburgh, Pennsylvania, U.S.A.; FGGUB, Faculty of Geology and Geophysics of the University of Bucharest, Romania; LCE, Musée de Cruzy, Cruzy, France; MAFI, Geological Survey of Hungary, Budapest, Hungary; MDE, Musée des Dinosaures, Esperaza, France; MFN, Museum für Naturkunde, Berlin, Germany; OMNH, Sam Noble Oklahoma Museum of Natural History, University of Oklahoma, Norman, Oklahoma, U.S.A.; PC.DMR, Department of Mineral Resources, Khon Kaen Province, Kalasin, Thailand; SMA, Sauriermuseum Aathal, Canton Zürich, Switzerland; TMM, Vertebrate Paleontology Collection, Texas Memorial Museum, University of Texas, Austin, Texas, U.S.A.
Materials and Methods
Studied Sauropod Taxa
A total of 79 specimens were analyzed from the following eight neosauropod taxa: Apatosaurinae, Giraffatitan brancai, Dicraeosaurus spp., Camarasaurus spp., Phuwiangosaurus sirindhornae, Ampelosaurus atacis, Magyarosaurus dacus, and Alamosaurus sanjuanensis. The phylogenetic relationships of the sampled taxa are shown in Figure 1. Note that many of the samples have been used in previous studies, as pointed out on a taxon-by-taxon basis below.
Two sauropods, Dicraeosaurus spp. and Giraffatitan brancai, formerly Brachiosaurus brancai (see Taylor Reference Taylor2009), come from the Late Jurassic Tendaguru Formation, Tanzania. Dicraeosaurus is a medium-sized diplodocoid sauropod (Wilson Reference Wilson2002) known from two species, D. hansemanni and D. sattleri, both of which are represented in our sample and were histologically described by Sander (Reference Sander2000). Giraffatitan is one of the larger sauropods, belonging to Brachiosauridae, and is the sister taxon to the North American Brachiosaurus altithorax (Taylor Reference Taylor2009). For a general description of Giraffatitan and Dicraeosaurus histology, see Sander (Reference Sander2000).
Camarasaurus is a medium-sized sauropod from the Late Jurassic Morrison Formation in the United States. It is the most common sauropod in the formation and is considered a basal macronarian. Specimens of Apatosaurinae can also found in the Morrison Formation and are considered diplodocid sauropods. Although described as the genus Apatosaurus in Klein and Sander (Reference Klein and Sander2008), the recent publication of Tschopp et al. (Reference Tschopp, Mateus and Benson2015) has put into question the true affinity of some of the Morrison diplodocids. Hence, we assign the specimens used here to Apatosaurinae. Among the sampled taxa, it is most closely related to Dicraeosaurus (Fig. 1; Wilson Reference Wilson2002). A general description of histology for Apatosaurinae and Camarasaurus can be found in Klein and Sander (Reference Klein and Sander2008).
The last four sauropods are currently regarded as titanosaurs. Magyarosaurus dacus is a dwarf titanosaur from the early Maastrichtian of Romania with a maximum length of 6 m. Its long bone histology was described by Stein et al. (Reference Stein, Csiki, Rogers, Weishampel, Redelstorff, Carballido and Sander2010). Ampelosaurus atacis is a derived medium-sized late Campanian to early Maastrichtian titanosaur from southern France, and histological descriptions are found in Klein et al. (Reference Klein, Sander, Stein, Le Loeuff, Carballido and Buffetaut2012). Phuwiangosaurus sirindhornae is a basal titanosaur or basal somphospondylian and comes from the Early Cretaceous Sao Khua Formation in Thailand. Its long bone histology was described by Klein et al. (Reference Klein, Sander and Suteethorn2009). Alamosaurus sanjuanensis is a derived large-bodied titanosaur from the Maastrichtian of the southern Rocky Mountain region of the United States, and its long bone histology was described by Woodward and Lehman (Reference Woodward and Lehman2009) and Klein et al. (Reference Klein, Sander, Stein, Le Loeuff, Carballido and Buffetaut2012). Our sample was originally acquired for the latter study.
We used thin sections of ontogenetic series of femora and humeri, most of which have been used in previous studies, as noted above. Most samples were obtained by coring in the midshaft region following the protocol of Sander (Reference Sander2000), using the method described in detail by Stein and Sander (Reference Stein and Sander2009). Samples were taken from the midshaft of the long bones, because this region contains the most complete growth record, as long bones grow appositionally from the central region of the femur and humerus (Francillon-Vieillot et al. Reference Francillon-Vieillot, de Buffrénil, Castanet, Géraudie, Meunier, Sire, Zylberberg and de Ricqlès1990; Sander Reference Sander1999, Reference Sander2000; Stein and Sander Reference Stein and Sander2009). Some complete cross sections were obtained as well, and all samples were processed into thin sections using standard thin-sectioning procedures (see Enlow and Brown Reference Enlow and Brown1956; Chinsamy and Raath Reference Chinsamy and Raath1992; Wilson et al. Reference Wilson, Leiggi and May1994). The standard coring location for femora is the anterior side of the midshaft, whereas the standard coring location in humeri is the posterior side of the midshaft (Sander Reference Sander2000; Klein and Sander Reference Klein and Sander2008; Sander et al. Reference Sander, Klein, Stein and Wings2011). Most samples were taken from these standard locations, but a few were not (see Table 1 for details). All samples were included in the analysis to compare histovariability of Haversian bone development between standard and nonstandard regions.
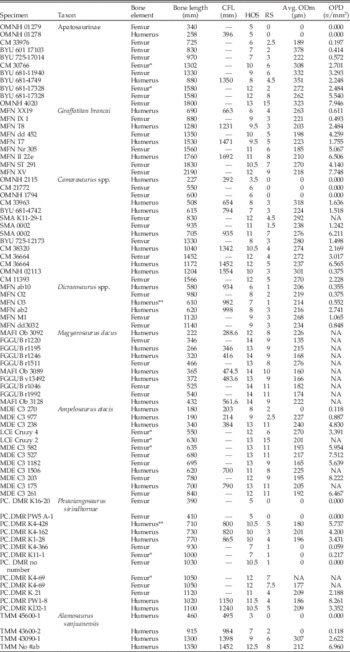
Specimens with their respective HOS (histologic ontogenetic stages), RS (remodeling stages), and measurements for CFL (corresponding femur length), Avg. ODm. (average osteon diameter), and OPD (osteon population density). Note some values are NA due to poor specimen preservation. For detailed histology see Klein and Sander (Reference Klein and Sander2008): Apatosaurinae, Camarasaurus; Sander (Reference Sander2000): Dicraeosaurus, Giraffatitan; Klein et al. (Reference Klein, Sander and Suteethorn2009): Phuwiangosaurus; Woodward and Lehman (Reference Woodward and Lehman2009): Alamosaurus; Stein et al.(Reference Stein, Csiki, Rogers, Weishampel, Redelstorff, Carballido and Sander2010): Magyarosaurus; Klein et al. (Reference Klein, Sander, Stein, Le Loeuff, Carballido and Buffetaut2012): Ampelosaurus. Asterisks indicate femur sampled on posterior side (*) and humerus sampled on anterior side (**).

The Dicraeosaurus specimens include five long bones from D. sattleri and one from D. hansemanni. The latter was included because its histology and size are similar to those of D. sattleri. Two morphotypes of Camarasaurus were distinguished using histological ontogenetic stages (Klein and Sander Reference Klein and Sander2008). They were combined for statistical analyses in this study. The bone histology of all taxa has been described in previous studies (see Table 1), and the thin sections are stored in the thin-section collection in the Steinmann Institute of the University of Bonn, Germany.
Femur length is commonly used as a proxy for body size in sauropods (e.g., Bonnan Reference Bonnan2004). In femora, the length was measured directly on the bones. In humeri, the measured length had to be converted to a corresponding length based on the average humerus/femur ratio for each taxon (Klein and Sander Reference Klein and Sander2008). Corresponding femur length (CFL, measured in millimeters) is used as the proxy for body size and to describe the length of femora and humeri, because both long bones are used together in regression analyses. This is justified, because they show the same HOS at the same body size (Klein and Sander Reference Klein and Sander2008), which is not always the case in nonhomologous elements (Padian et al. Reference Padian, Werning and Horner2016). Merging the femur and humerus samples also increases the sample size of specimens. All examined specimens are listed in Table 1.
Thin sections were examined with standard light microscopic techniques (plane polarized, cross-polarized light, and lambda waveplate) with a Leica (Wetzlar, Germany) DMLP compound microscope (2.5× to 40× objective lenses). The photographs were taken with a Leica DFC420 camera attachment, and measurements were taken with the ImageAccess easyLab7 software. Statistical analyses were performed with the statistical program R, Version 3.2.3 (R Core Team 2015).
Quantifying Remodeling
Three different methods were used to quantify the remodeling progress in our specimens. These methods are based on forensic age determination of humans as noted above, but have been modified to suit the available types of sections. Many studies of age determination in human bone measure several bone histological features, including Haversian bone density (whole osteons and fragments), primary lamellar bone, and non-Haversian vascular canals. Because the goal of this research is to determine ontogenetic signals in mature sauropods in which only Haversian bone is present, only secondary osteons were taken into consideration for measurements.
Osteon Size
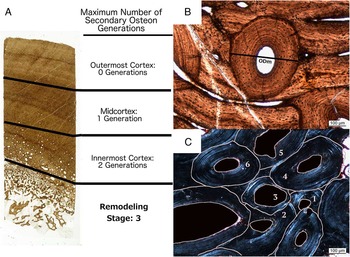
Secondary osteon size has been correlated with age in humans (Currey Reference Currey1964; Ortner Reference Ortner1975; Britz et al. Reference Britz, Thomas, Clement and Cooper2009). Therefore, we took size measurements to test this correlation in sauropods. The short-axis diameter was measured (see Fig. 2B), because secondary osteons can appear to be more elliptical than circular in shape, and this may be a result of the thin section being cut at a slight angle to the transverse plane or secondary osteons forming at a slight angle to a bone’s long axis. The short-axis diameter was thus measured for the most conservative estimate of size. Measured osteons had to be completely or mostly visible (not partially replaced by younger osteons), but aside from this necessity, osteons from the entire cortex, when possible, were used. For each specimen, the number of osteons measured varied due to the amount of osteons present and the preservation of the thin section. If there were very few (<20 visible osteons), all were measured. If there were many, then dozens of osteons were measured. Once all the measurements of osteon diameter (ODm) were taken, the average diameter was calculated for the entire cortex of each specimen (Table 1). A regression analysis was used to test whether average ODm was correlated with the CFL.
A, Core section of an Apatosaurinae femur showing how the cortex was divided to determine the RS. Within each section, the maximum number of generations was recorded (Table 2). B, Micrograph showing the measurement of osteon diameter (ODm). C, Micrograph showing the counting of osteon generations for Apatosaurinae OMNH 4020, in which six generations are preserved, the most generations observed in any specimen.

Osteon Density
The osteon population density (OPD) (Kerley Reference Kerley1965; Ahlqvist and Damsten Reference Ahlqvist and Damsten1969; Ericksen Reference Ericksen1991) was estimated by counting all visible osteons in a total area of 50 mm2 (the total area of four microscope images at 2.5×). Because more osteons are usually situated in the inner cortex of most specimens, different areas of the cortex were used to better represent the distribution; these areas were chosen randomly but represented areas from the innermost to outermost cortex. Resorption spaces that may represent early stages of osteon formation with little to no deposited lamellae were excluded, because some resorption spaces become part of the expanding medullary region during growth, failing to develop into secondary osteons. The OPD for each specimen is reported in Table 1. The density of osteons was then compared with the CFL in a linear regression to test for a correlation. Due to poor preservation of most Magyarosaurus specimens (see Fig. 3C), an accurate OPD could not always be determined. Therefore, a regression analysis was not performed for Magyarosaurus.
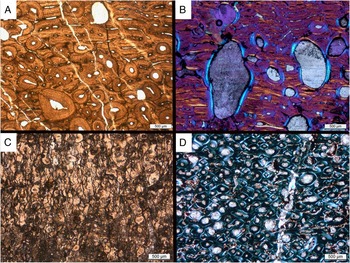
Micrographs showing examples of remodeling in certain studied sauropod taxa. A, BYU 681-4742; Apatosaurinae humerus, HOS 8, RS 4 (plane light). Near the inner cortex, at the bottom of the image, several secondary osteons are forming. Primary bone is visible in the upper half. Similar histology is seen in Camarasaurus, Giraffatitan, and Alamosaurus. B, MfN dd3032; Dicraeosaurus femur, HOS 9, RS 3, innermost cortex (cross-polarized light with lambda waveplate). Note the large resorption spaces with sporadic secondary osteons, which are different from the pattern in other diplodocoideans and macronarians. C, Maygarosaurus dacus, FGGUB r1220 HOS 14, RS 9, mid- to inner cortex. Example of a region of poor preservation typical for many Magyarosaurus specimens, which prevented complete analysis in some cases. D, PC.DMR K4-69; Phuwiangosaurus, HOS 12, RS 7, innermost cortex (cross-polarized light). Example of extensive remodeling, typical of Magyarosaurus and Ampelosaurus, but also in the late ontogenetic stages of all taxa, particularly in the inner to midcortex (with the exception of Dicraeosaurus).

Number of Osteon Generations
As noted earlier, the number of generations of osteons was used by Stein et al. (Reference Stein, Csiki, Rogers, Weishampel, Redelstorff, Carballido and Sander2010) to establish HOS 14. This approach is adopted here to observe whether it can provide an even more detailed ontogenetic signal. For determination of the number of osteon generations, the cortex was divided into three equal segments to analyze variation across the core sample, the outermost, mid-, and innermost cortex, representing the youngest to oldest primary bone (Fig. 2A). In some specimens, the transition to the medullary area (usually occupied by cancellous bone) is smoother than in others (where very little cancellous bone is present and the medullary area is either nearly empty or simply not preserved). In cases in which the boundary between medullary region and cortical region is gradual, the cortical region was defined as the region where the bone represents more than half the area and pore space is less than 50%.
The maximum number of generations was determined by documenting the highest number of crosscutting (i.e., overlapping) relationships between osteons in each segment (Fig. 2A,C). The highest number was recorded for the three segments of the samples. The more generations observed, the more time must have passed, thus the older the specimen (Kerley Reference Kerley1965).
Remodeling Stages
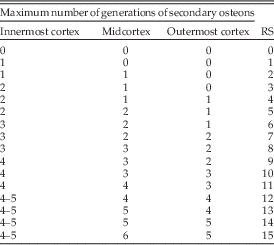
The number of generations in a given cortex segment presented a relatively consistent pattern, with a higher number in the innermost cortex and a lower number in the outermost cortex (Table 2). Remodeling stages were developed independently from the histological ontogenetic stages to describe the maximum number of generations of osteons in cross section. The remodeling stage (RS) represents a particular combination of values for the maximum numbers of observed generations of osteons for the innermost, mid-, and outermost cortex. Remodeling stages begin with a value 0, representing no Haversian bone development to 15, the highest amount of observed Haversian bone development (six generations in the midcortex). If more generations of osteons are observed in future specimens, the remodeling stages can be extended as needed. For example, if the innermost cortex had a maximum of three generations, the midcortex two generations, and the outermost cortex one, then the RS would be six (see Table 2; Fig. 2A). These remodeling stages were subsequently regressed against CFLs of the different sauropod taxa to test whether an increase in CFL could be correlated with an increase in RS. Because the remodeling stages are ordinal data, a simple linear regression was not appropriate, but instead an ordered logistic regression (proportional-odds model) was performed in R, using the package VGAM (Yee Reference Yee2016). The ordered logistic regression calculates the log odds of being in a higher RS (response) for an increase in CFL (predictor). It assesses the probability of the z-test statistic to be greater than observed in the null hypothesis (i.e., z-test statistic for a given predictor not significantly different from 0), where the z-test statistic is the ratio of the coefficient to the standard error of the predictor (CFL). Alamosaurus could not be analyzed with an ordered logistic regression, because the sample size (four) was too small. Instead, using the stats package in R (R Core Team 2015), a Kendall’s τ b test was performed, because it can be used for ordinal associations. It measures the rank correlation coefficient between RS and CFL for Alamosaurus.
Remodeling stages (RS). Each stage describes the progress of remodeling as the maximum number of observed generations of osteons in the innermost, mid-, and outermost cortex, based on the ontogenetic series of sauropods. Note that in the higher RS, no more than four or five generations of secondary osteons were observed in the innermost cortex.

Results
Size of Osteons (ODm) and OPD
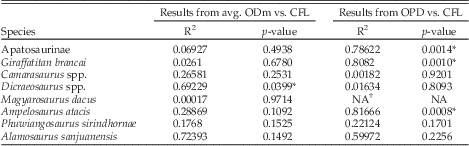
Table 3 includes the results of the regression analysis for the different sauropod taxa for osteon size and OPD. For the ODm, only Dicraeosaurus showed a significant correlation with CFL (R 2=0.69 p=0.0399). OPD significantly increased with CFL for Apatosaurinae (R 2=0.79, p=0.0014), Giraffatitan (R 2=0.81, p=0.0010), and Ampelosaurus (R 2=0. 82, p=0.0008), whereas the other taxa showed no significant correlation. These measures were thus deemed to be of lesser or no value for determining ontogenetic stage.
Results of linear regression of avg. ODm compared with CFL and OPD compared with CFL for each sauropod taxon. *p < 0.05.

† Poor preservation of Magyarosaurus specimens prevented adequate estimate of OPD
Remodeling Stages
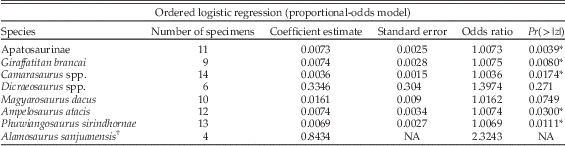
Using the ordered logistic regression (Table 4), a significant correlation was found between CFL and RS for Apatosaurinae (p=0.0039), Giraffatitan (p=0.0174), Camarasaurus (p=0.0174), Phuwiangosaurus (p=0.0111), and Ampelosaurus (p=0.0300) but not for Magyarosaurus (p=0.0749) or Dicraeosaurus (p=0.2710). For Alamosaurus, the value of τ from Kendall’s test equaled one (p=0.04), which indicates very strong agreement between CFL and RS.
Results from the ordered logistic regression for each sauropod taxon. The coefficient estimate indicates the expected change in log odds of being in a higher RS category for every unit increase in CFL. The odds ratio indicates the ratio of the odds of an increase in CFL over the odds of no increase in CFL. A significant p-value (Pr(>|z|)) indicates the probability of the z-test statistic (ratio of coefficient to standard error) being statistically different from the null hypothesis. *p<0.05.

† Unable to calculate regression statistics for Alamosaurus because of the small sample size.
Differences in Sampling Locations
In the Apatosaurinae specimen BYU 601-17328, two samples were taken, one posteriorly and the other anteriorly. Although the HOS for both sections was the same (HOS 12, as indicated by the presence of an EFS), remodeling was very different. The anterior side showed significantly more remodeling (RS 8) than the posterior side (RS 2). The highly remodeled Phuwiangosaurus specimen PC.DMR k4-69, in which the bone was cored from the anterior straight through to the posterior side, had the same HOS of 12 and only a slight difference in RS between posterior (RS 7) and anterior (RS 7.5). This RS was particularly high for Phuwiangosaurus; other femoral sections, both anteriorly and posteriorly sampled, had very low remodeling stages (see Table 1). The Ampelosaurus femur specimens MDE C3 582 (CFL=635 mm; HOS 13; RS 11) and LCE Cruzy 2 (CFL=630; HOS 13; RS 15) were sampled on the posterior side and had different remodeling stages even though the CFLs are similar. The specimens MDE C3 527 (CFL= 680 mm) and MDE C3 1182 (CFL=695) with anteriorly sampled femora had RS 11 and 9, respectively. The posteriorly sampled LCE Cru 4 (CFL=530; HOS 12; RS 6) had a much lower RS, but no anteriorly sampled femurs of similar size were available.
Two Camarasaurus specimens (SMA 0002; HOS 11; and CM 36664; HOS 12) had both humerus and femur sampled. The RS for the femur of SMA 0002 (RS 1.5) was much lower than the humerus (RS 7). Whereas in CM 36664, the femur had an RS of 4 and the humerus an RS of 5. In Phuwiangosaurus, the humeral sections had notably higher remodeling stages than the femora (see Table 1) for most specimens. The other species did not show very different trends between humerus RS and femur RS, although individual differences were observed (see following section and Table 1).
Remodeling Patterns by Taxon
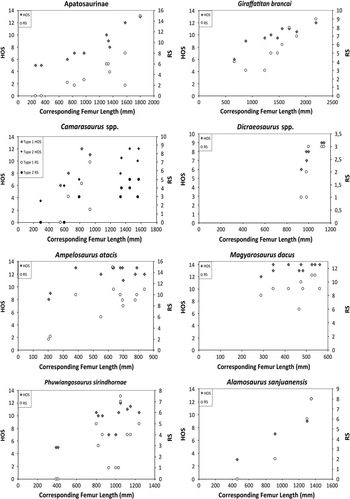
The primary bone in our sample of Apatosaurinae is dominated by highly vascularized laminar to plexiform fibrolamellar bone (woven-parallel complex of Prondvai et al. 2014) with the onset of Haversian bone development around HOS 7. Figure 3A gives an example of the typical remodeled tissue of Apatosaurinae. A clear increase in remodeling stages is evident throughout Apatosaurinae ontogeny (Fig. 4). A significant correlation between CFL and RS was observed (Table 4). The largest Apatosaurinae (OMNH 4020 FL 1800 mm) was observed to have a maximum of six generations in the middle part of the cortex, with an RS of 15, representing the highest number of generations observed (Fig. 2C). The inner cortex of this specimen did not have more than four, possibly five, observable generations. OMNH 4020 is classified as a HOS 13 sensu Klein and Sander (Reference Klein and Sander2008) and HOS 14 sensu Stein et al. (Reference Stein, Csiki, Rogers, Weishampel, Redelstorff, Carballido and Sander2010). There is a large gap between the largest specimen and second-largest specimen in terms of Haversian bone development, suggesting there may have been a significant age gap at time of death (Fig. 4).
HOS and RS compared with CFL for each sauropod taxon. Of the taxa studied, Apatosaurinae, Giraffatitan, Camarasaurus, Ampelosaurus, Phuwiangosaurus, and Alamosaurus show a significant correlation of RS to CFL (compare with Table 4 for regression results). Note, however, that the remodeling stages do not match up with any particular HOS. Camarasaurus is marked with both morphotypes, as observed in Klein and Sander (Reference Klein and Sander2008).

Laminar to plexiform highly vascularized primary bone is dominant in Giraffatitan, with the first secondary osteons occurring around HOS 8. Giraffatitan has a significant correlation of osteon generations with ontogeny (Table 4; Fig. 4). The highest number of observed generations in the largest femur MFN XV (FL 2190 mm) was four generations, with an RS of 9, notably less than the largest Apatosaurinae. In the two smallest humeral sections (MFN XX19 and MFN T8), the amount of remodeling did not differ (RS of 3), but MFN T8 has a humerus of almost twice the length and a much higher HOS (9 compared with 6 of MFN XX19).
Dicraeosaurus cortical bone has highly vascularized primary bone as well, but it also has a distinct vascularization, which is not observed in Giraffatitan or other Tendaguru sauropods (Sander Reference Sander2000). Large erosion cavities extend into the midcortex of some specimens (Fig. 3B). Not only was its primary bone different, but Dicraeosaurus had different Haversian bone development from the other sauropods studied. Remodeling was always restricted to the innermost to midpart of the cortex for most specimens. The histological ontogenetic stages were determined (after Klein and Sander Reference Klein and Sander2008) to be between 6 and 9, but in other sauropods remodeling usually has already reached the outermost cortex by HOS 8 or 9. Remodeling stages did not correlate well with ontogeny (Table 4). However, poor correlation is probably due to a small sample size and the bone lengths being quite similar.
Primary bone in Camarasaurus is laminar to plexiform and highly vascularized. Most of the cortices in Camarasaurus were not completely remodeled. It was noted in Klein and Sander (Reference Klein and Sander2008) that two morphotypes could be observed based on the relative size and HOS. Both types are labeled in Figure 4, but for the ordered logisitic regression, all specimens were used together. No distinct morphotypes could be observed in remodeling stages. A significant correlation was observed between RS and CFL (Table 4).
The bone histology of the dwarf titanosaur Magyarosaurus is quite different from other taxa, as even small individuals have nearly completely remodeled bone (Fig. 3D), as already noted by Stein et al. (Reference Stein, Csiki, Rogers, Weishampel, Redelstorff, Carballido and Sander2010). The primary bone is modified laminar bone (sensu Klein et al. Reference Klein, Sander, Stein, Le Loeuff, Carballido and Buffetaut2012). None of the samples show a clear EFS (Stein et al. Reference Stein, Csiki, Rogers, Weishampel, Redelstorff, Carballido and Sander2010), though Klein et al. (Reference Klein, Sander, Stein, Le Loeuff, Carballido and Buffetaut2012) noted a pair of closely spaced LAGs in the outermost cortex of one specimen. In general, there is no significant increase in RS with bone length (Table 4). Many of the specimens were poorly preserved with many cracks and diagenetic features that obscured the bone tissue (Fig. 3C); thus, determining the number of generations within each section of cortex was difficult. In general, crosscutting relationships of osteons could only be assessed in small areas. Because of the issues with preservation, it could be that the assigned remodeling stages are incorrect and there is indeed a significant correlation with size. FGGUB R1046 (CFL 500 mm) was determined to have an RS of 11, whereas some of the less well-preserved specimens were estimated between RS 8 and 10. These estimates may be lower than the true number of observable generations because of limited observable area. The poor correlation between RS and size mirrors the poor correlation between HOS and size (Fig. 4).
The main bone tissue type in Phuwiangosaurus is modified laminar bone (Klein et al. Reference Klein, Sander, Stein, Le Loeuff, Carballido and Buffetaut2012), but the remodeling was peculiar in this taxon. Particularly in the femora, Haversian bone development is much lower compared with the smaller humeri. The smaller humeri have RS 3 through 5. With the exception of PC.DMR k4-69 (CFL=1050 mm, RS 7), the other femora of similar size had an RS of 1 and the largest femur specimen (PC.DMR K 21; CFL=1120 mm) had an RS of 4. Even with notable differences in humeri and femora, a significant correlation between RS and CFL was obtained when both humeri and femora were analyzed together (Table 4; Fig. 4).
Primary bone of Ampelosaurus consists of modified laminar bone (sensu Klein et al. Reference Klein, Sander, Stein, Le Loeuff, Carballido and Buffetaut2012). Many Ampelosaurus specimens show an extremely high degree of remodeling (Fig. 3D), with at least six generations observed in the posterior section LCE Cruzy 02 (CFL 630 mm) in the midcortex, making it one of the highest observed RS at 15. Like Magyarosaurus, for some Ampelosaurus specimens, poor preservation lead to an underestimation of the true remodeling stage. Nonetheless, a significant correlation with ontogeny was observed for RS in Ampelosaurus (Fig. 4; Table 4), including specimens that were not sampled in the standard location (femora LCE Cruzy 4, LCE Cruzy 2 and MDE C3 582).
For Alamosaurus, only humeri samples were available for examination. The primary bone is mainly laminar, and the remodeling progressed strikingly similar to that observed in Giraffatitan and Apatosaurinae (Fig. 4) as opposed to other titanosaurs, which were much more remodeled (e.g., Ampelosaurus and Magyarosaurus). An increase in RS was observed with increasing bone length and correlated well with the HOS (Table 4).
Discussion
The goal of this research was to determine whether secondary osteons provide an ontogenetic signal to extend histological ontogenetic stages into late adulthood or senescence of sauropods, when primary bone is nearly to completely absent. Of the three methods used here, the number of generations of secondary osteons proved to be the most useful. A secondary outcome of this research is a more detailed look into the variability of Haversian bone development in these different taxa.
When comparing the ODm and the CFL of each species, no correlation was observed, with the exception of Dicraeosaurus. Britz et al. (Reference Britz, Thomas, Clement and Cooper2009) observed in humans that ODm decreases with age but also reported that weight was negatively related to ODm and females had smaller osteons than males. Havill (Reference Havill2003) also noted the disparity in osteon area between male and female macaques (Macaca mulatta) but no difference in osteon size between immature and mature individuals. Thus, it appears that other factors may have a more important influence on osteon size, which may explain the poor correlation in the sauropods.
Density of secondary osteons (OPD) increases with ontogeny for Apatosaurinae, Giraffatitan, and Ampelosaurus. However, measuring variability of densities in late ontogenetic stages is difficult with few samples. The area chosen to sample osteon density may not have been large enough. Additionally, measurements are subject to bias, because the amount of Haversian bone, particularly in the mid- to outermost cortex, is unevenly distributed, meaning a sample taken from one area may result in no osteons but an area only a couple of millimeters away may be almost entirely osteonal. Ideally, the entire cortex of the cored section would be used to determine osteon density, but this becomes very time-consuming in practice, particularly for the large sauropod sections. With more specimens from late ontogeny, it may be possible to observe differences in osteon density. However, Walker et al. (Reference Walker, Lovejoy and Meindl1994) studied the histomorphometry of femora for humans aged 51–95 and found no correlation between age and density of secondary osteons and osteon fragments. Thus, as adults enter into senescence, the ontogenetic signal that secondary osteon density provides seems to decrease in resolution.
Remodeling Stages as an Ontogenetic Signal
The highest number of observed generations proved to be a simple and useful way of documenting an ontogenetic signal in Haversian bone development. The remodeling stages correlate well with CFL in six out of eight species studied. With each increase in RS, from 0 to 1 to 2 and so forth, we can infer an increase in age of these animals. Dicraeosaurus lacked significant correlation with CFL. The low number of samples and all individuals of this taxon being close to the same body size likely prevented a good correlation. With better-preserved specimens of Magyarosaurus, it too may show better correlation with CFL. Even though most histological ontogenetic stages were high (HOS 11 or higher) for Ampelosaurus, the RS showed a correlation with CFL. Even with the relatively low sample size of the sauropod taxon, an ontogenetic signal is present, suggesting that there may be a way to differentiate older, highly remodeled individuals of sauropods from younger ones. Although the circumference has been shown to be a better proxy for mass in quadrupedal mammals and reptiles compared with length (Campione and Evans Reference Campione and Evans2012), in sauropods, femur length has an isometric relationship with circumference (Bonnan Reference Bonnan2004; Kilbourne and Makovicky Reference Kilbourne and Makovicky2010). Thus, the femur length is used for our taxa; when applying this method to other taxa, circumference may be the better choice.
We cannot say with any certainty how much time has passed from one RS to another, nevertheless we can estimate that, for example, the largest Apatosaurinae (1800 mm femur length), which has an RS much higher than the second-largest Apatosaurinae individual, was probably many years older when it died. We know that for humans, osteon formation (from onset of resorption to the osteoid becoming mineralized) takes between 6 months and 1 year (Parfitt Reference Parfitt1994), and osteon formation rate (number of osteons/mm2/yr) decreases over time (Frost Reference Frost1969; Stout and Paine Reference Stout and Paine1994). With three or four generations more in Apatosaurinae OMNH 4020 than in BYU 681-17328 (RS 15 and RS 8, respectively), it is likely that a few years would be needed to form those additional generations. Additionally, the activation frequency, that is, the number of osteons formed per square millimeter per year for macaques (Havill Reference Havill2003) and humans (Frost Reference Frost1969; Stout and Paine Reference Stout and Paine1994) decreased from approximately 8 to 12 osteons/mm2/yr in skeletally immature macaques and young humans (10–19 years of age) to 1 to 2 osteons/mm2/yr in skeletally mature macaques and adult (20–89 years of age) humans. It would be reasonable to assume that a decrease in activation frequency of osteons in mature individuals is the norm for animals that develop Haversian bone. When animals reach adulthood, overall growth stops or dramatically slows, so the amount of energy put into primary bone development decreases; it could be that secondary bone formation also decreases, as observed in primates. If senescent sauropods had similar activation frequencies to adult primates, it is reasonable to assume that for an observed density of 8 osteons/mm2, 4 to 8 years would have been needed to create all the observed osteons.
Limitations to Remodeling Stages
One of the major issues with the use of the remodeling stages is providing a reliable account for the highest amount of observable osteons in different parts of a thin section. Particularly, the innermost cortex, which is the oldest bone and thus has had more time to undergo remodeling, should by this reasoning have more secondary osteons but also more generations of osteons (see also Mitchell and Sander Reference Mitchell and Sander2014). However, because the innermost cortex usually comprises large resorption spaces, many of the older osteon generations are destroyed, which could then lead to a lower observable number (see Table 1). In highly remodeled bone, the innermost cortex no longer exceeds the number of observed generations in the mid- to outermost cortex after about three or four generations. An alternative reason could be that the amount of secondary osteons in any given region of bone becomes more uniform over time. Once old age is reached, bone turnover may no longer proceed from innermost to outermost cortex, decreasing the resolution of RS. The maximum number of generations observed was six in Apatosaurinae and Ampelosaurus. Although the actual maximum number of possible observable generations has not been determined, six may well be it. Thus, RS 15 may actually represent a plateau where ontogenetic time is no longer recorded accurately.
Another issue, which we encountered in many sections, was poor preservation, which can also lead to an underestimate of RS. Diagenetic stains and fractures obstructed the view of crosscutting relationships in many samples. An approximation of RS had to be made for many of the titanosaurs, particularly the long bones of Magyarosaurus, because only small areas were clear enough to observe crosscutting relationships
Comparing Histological Ontogenetic Stages and Remodeling Stages
The largest Giraffatitan and Apatosaurinae individuals (HOS 12 and 13, respectively) have very different remodeling stages (9 and 15, respectively), even though both have nearly completely remodeled cortices. This indicates the limit of histological ontogenetic stages and demonstrates the potential of remodeling stages for distinguishing further stages late in ontogeny. However, remodeling stages tend to increase at a different rate than HOS (See Fig. 4). In some cases, the HOS can increase by two or three stages between two specimens, but the RS stays more or less the same (e.g., in Giraffatitan in Fig. 4) or the remodeling stages are very different between similarly sized individuals or similar histological ontogenetic stages (e.g., Phuwiangosaurus in Fig.4). Nevertheless, the RS does show individual differences in these highly remodeled specimens, something that cannot be accomplished with the current HOS scheme. Importantly, the remodeling stages are clearly independent from the histological ontogenetic stages: the RS does not always correlate with a particular HOS, and thus reflects the fact that bone remodeling is independent from primary bone formation. This is expected based on observations of different timings of secondary osteon appearance, such as observed in the perinate from Curry Rogers et al. (Reference Curry Rogers, Whitney, D’Emic and Bagley2016).
Integration of Remodeling Stages with Histological Ontogenetic Stages
A better understanding of how remodeling changes through ontogeny is established with RS, potentially providing a more extensive toolbox to describe histological differences in ontogeny in addition to HOS. However, a synthesis between HOS and RS is required, because secondary osteons are part of the description in several histological ontogenetic stages. A possible solution would be to use HOS to describe primary bone and RS to describe secondary bone. Once the onset of remodeling commences, both HOS and RS can be used, and once primary bone is no longer visible, RS can be used to describe the extent of remodeling. This way, an additional parameter is gained to describe the histological development of sauropods. This can be helpful, for example, to compare a specimen with HOS 7 and RS of 3 with another specimen that has a HOS 7 but an RS of 6. The combination of HOS and RS suggests that the primary vascular canals and primary tissue are the same but the Haversian bone development is different in the two specimens, one being younger than the other.
Converting the remodeling stages into additional histological ontogenetic stages to describe late ontogeny (e.g., make RS of 10 into HOS 15 and so forth) would not make sense, because there was no one-to-one relationship between RS and HOS. Alternatively, extending the histological ontogenetic stages may be possible by incorporating the maximum observed number of generations in the outermost cortex into their definition, modifying and extending the definition of HOS 14 of Stein et al. (Reference Stein, Csiki, Rogers, Weishampel, Redelstorff, Carballido and Sander2010). HOS 13 is defined as nearly completely remodeled bone, and based on observations in the current study, this usually means at least two generations of osteons in the outermost cortex. Thus, HOS 13 could be more specifically defined as a maximum of two generations of secondary osteons in the outermost cortex; HOS 14, three generations of secondary osteons in the outermost cortex; HOS 15, four generations, and so forth. The applicability of this approach needs testing by preferential sampling of large and old sauropod individuals.
Extreme Remodeling in Magyarosaurus and Ampelosaurus
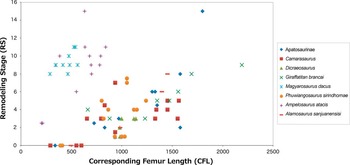
Figure 5 shows a graph of all species together with RS on the y-axis and CFL on the x-axis. Most species plot in the same region, showing an overall increasing trend of RS with bone length. There is a distinct gap between the majority of sampled species and Magyarosaurus and Ampelosaurus, which both plot further left on the graph (due to a smaller relative bone length). Most notably, they plot, on average, higher than the other sauropods, indicating overall higher RS. This indicates a shift to an increase in Haversian bone development with smaller body size, interpreted as island dwarfing in Magyarosaurus (Stein et al. Reference Stein, Csiki, Rogers, Weishampel, Redelstorff, Carballido and Sander2010) but not in Ampelosaurus. Haversian remodeling appears to be stronger in titanosaurs in general compared with more basal sauropods and was also noted in Lirainasaurus (Company Reference Company2011) and some other titanosaurs (D’Emic and Wilson Reference D’Emic and Wilson2012; Garcia et al. Reference García, Salgado, Fernández, Cerda, Carabajal, Otero, Coria and Fiorelli2015).
Graph of RS versus CFL with all taxa together in one plot. Note the correlation of the two parameters in all taxa but that Ampelosaurus and Magyarosaurus are set off from the other sauropods, indicated by the overall higher RS.

This trend, is not observed in all dwarf sauropods. The island dwarf sauropod Europasaurus shows very little Haversian bone development, so little, in fact, that it was not included in this study. One reason for this observed higher remodeling in the smaller sauropods might be because remodeling begins earlier in ontogeny. The Magyarosaurus specimens represent a fairly complete growth series, and the smallest specimen already has extensive Haversian bone development (Stein et al. Reference Stein, Csiki, Rogers, Weishampel, Redelstorff, Carballido and Sander2010). In addition, both Ampelosaurus and Magyarosaurus display modified laminar bone, in which the typical woven bone aspect of fibrolamellar bone is replaced with parallel-fibered bone, which may suggest slow growth (Klein et al. Reference Klein, Sander, Stein, Le Loeuff, Carballido and Buffetaut2012). This slower growth may have enabled more time for Haversian bone to develop than in sauropods with typical “fibrolamellar” bone (Klein et al. Reference Klein, Sander, Stein, Le Loeuff, Carballido and Buffetaut2012). Mitchell and Sander (Reference Mitchell and Sander2014) noted that the difference in remodeling between the two dwarfs Europasaurus and Magyarosaurus resulted from a much more rapid resorption front (expanding medullary cavity during growth) in Europasaurus. Magyarosaurus, on the other hand, has a slower resorption front (indicated by the much thicker cortex), which allowed Haversian bone to develop and progress through the cortex.
The remodeling stages divide the cortex into three equal parts: inner, mid- and outer cortex. Of course, over time the cortex thickens in sauropods. New bone is deposited appositionally and the oldest bone is removed or remodeled into cancellous bone. This means that through ontogeny, what was once the outer cortex of a juvenile will be the midcortex of a subadult and the inner cortex of an adult. This method works well for sauropods, because the thick cortex allows for a very prominent gradient in secondary osteon deposition that increases through ontogeny. In taxa that have thinner cortices (or develop thin cortices through ontogeny), a division into three sections may not be feasible. But the RS can be altered for a different taxonomic group. For example, the cortex can be divided into two instead of three sections, or no division is made, and the highest RS for the entire length of the cortex in a specific location (e.g., anterior region of femur) is used.
High Variability in Remodeling of Sauropods
Sampling location is important, because variation in remodeling within a single bone is well documented (e.g., Amprino and Marotti Reference Amprino and Marotti1964; Frost Reference Frost1969; Martin et al. Reference Martin, Pickett and Zinaich1980; Stout Reference Stout1989; Pfeiffer et al. Reference Pfeiffer, Lazenby and Chiang1995; Padian et al. Reference Padian, Werning and Horner2016). As seen with the different sauropod taxa, the RS could vary by region of bone by a large factor. The variability in Haversian bone distribution is attributed partially to differences in mechanical loading and drifting (Francillon-Vieillot et al. Reference Francillon-Vieillot, de Buffrénil, Castanet, Géraudie, Meunier, Sire, Zylberberg and de Ricqlès1990; Currey Reference Currey2011). This means the extent and density is not entirely due to aging but also to biomechanics. When exploring the relationship of ontogeny with Haversian bone development, maintaining the same sampling location will reduce bias, but noting the remodeling stages in different regions around the cortex can quantify the variation in Haversian bone, which may be beneficial for biomechanical analyses. Padian et al. (Reference Padian, Werning and Horner2016) suggest that smaller bones generally display more Haversian bone, and the RS could be used as a method to compare different elements. However, this approach requires further testing on a large sample of midshaft cross sections.
Variability occurs not only within a single bone but across elements. In the Phuwiangosaurus and Camarasaurus (SMA 0002 and CM 36664) specimens, the smaller humeri showed more Haversian tissue development than the larger femora, and this may be a reflection of relative differences in modeling (apposition and resorption during growth) and remodeling (removal and deposition of small packets of bone). If the rate of remodeling is more or less constant in each limb but growth (both appositional deposition and resorption of the medullary region) is faster in the larger bone (to maintain proper proportions), then the observed effect could be less Haversian tissue in larger bones (Mitchell and Sander Reference Mitchell and Sander2014). Padian et al. (Reference Padian, Werning and Horner2016) suggest that in large dinosaurs, smaller long bones remodel more than large long bones because of differential growth. They hypothesize that the flow of metabolites must be the same in large long bones as is in smaller long bones of an individual. The larger bones use these metabolites for appositional growth, whereas smaller bones, not needing to grow as much, use them for remodeling (Padian et al. Reference Padian, Werning and Horner2016). Alternatively, the increase in remodeling in smaller limb bones may be related to mechanical loading. In modern sheep, an increase in Haversian tissue is observed in the smaller, distal limbs compared with proximal limbs of juvenile and adult specimens, with adults exhibiting higher remodeling rates than juveniles (Lieberman et al. Reference Lieberman, Pearson, Polk, Demes and Crompton2003). The increased Haversian tissue is interpreted to be the result of lower safety factors and higher strains in distal limbs (Lieberman et al. Reference Lieberman, Pearson, Polk, Demes and Crompton2003; Robling et al. Reference Robling, Castillo and Turner2006). Regardless of the underlying mechanism, the differences in Haversian tissue development between limb bones as observed in fossil or extant vertebrates need to be considered when comparing specimens.
Application to Other Taxa
Further investigation of this method to early sauropodomorphs is warranted. However, Haversian tissue development is limited in many taxa, such as Massospondylus (Chinsamy Reference Chinsamy1993) or Plateosaurus (Klein and Sander Reference Klein and Sander2007) and most basal sauropodomorphs (Cerda et al. Reference Cerda, Chinsamy, Pol, Otero, Powell and Martinez2016). But many other taxa display extensive Haversian tissue development, and the RS could be easily applied to them. For example, thyreophorans (Hayashi et al. Reference Hayashi, Carpenter and Suzuki2009; Stein et al. Reference Stein, Hayashi and Sander2013) typically have extremely dense Haversian tissue in long bones, which makes using primary bone tissue to assess ontogenetic age not possible. Using the RS, different highly remodeled specimens can be compared to assess relative age. Even in taxa that have LAGs (e.g., theropods: Chinsamy Reference Chinsamy1990; Varricchio Reference Varricchio1993), understanding and quantifying Haversian tissue development provide additional insight into ontogenetic changes.
Conclusions
The study of sauropod life history from the propodials (humerus and femur) is challenging. With a lack of direct evidence (i.e., well-developed annual growth lines), age cannot be reliably determined. Histologic ontogenetic stages can accommodate this problem by accounting for changes in histology over time. However, sauropods that lived to old ages often have completely remodeled bone in their humeri and femora, with secondary osteons being the only feature. The number of crosscutting relationships of these osteons can be quantified to describe late ontogenetic stages within some sauropod taxa. We described the changes in number of secondary osteon generations as remodeling stages and provide a comparative ontogenetic scale of growth series of sauropod humeri and femora. Starting from the onset of remodeling to the occurrence of up to six generations of crosscutting relations of secondary osteons, the remodeling stages can be used independent of primary bone development. In combination with the HOS scheme of Klein and Sander (Reference Klein and Sander2008), these remodeling stages provide better resolved histologic ontogenies for Apatosaurinae, Giraffatitan, Camarasaurus, Ampelosaurus, Phuwiangosaurus, and Alamosaurus. The complementary aspect of HOS and RS can be used to provide a more precise description of the ontogenetic stage of sauropod propodials. RS can be used as a qualitative descriptor of the extent of remodeling, which can be used for intra- and interspecific comparative purposes. Additional specimens, particularly senescent individuals and other ontogenetic series of sauropodomorphs, would be beneficial for testing the robustness of the statistical outcome. Since variability of Haversian bone distribution is observable across many taxa, not just sauropods, the applicability of RS in other dinosaurs but also other extinct large terrestrial vertebrates is worthwhile to explore.
Acknowledgments
The authors would like to thank O. Dülfer, technician, for thin-section preparation, and N. Klein for providing data on histological ontogenetic stages and bone lengths for the sauropod specimens. We also thank A. Canoville for helpful discussions and A. H. van Heteren and E. Prondvai for advice on statistical analyses. We thank two reviewers for providing insightful comments on an earlier version of this article. We are forever grateful to all the curators who gave us permission to sample specimens under their care: D. Berman (CM), R. Cifelli and K. Davies (OMNH), Z. Csiki-Sava (FGGUB), W.-D Heinrich and H.-P. Schultz (MFN), L. Kórdós (MAFI), J. Le Loeuff (MDE), T. Rowe and the late W. Langston (TMM), K. Stadtman (BYU), H. J. Siber (SMA), and V. Suteethorn (PC.DMR). Funding was provided by several grants from the German Research Foundation (DFG) to P.M.S. K.S. is currently funded by a postdoctoral fellowship of the Foundation for Scientific Research Flandres (FWO).
This is contribution number 171 of the DFG Research Unit 533 “Biology of the Sauropod Dinosaurs.”