The 2016 election represents a unique opportunity for studying certain aspects of voter turnout and preferences. Not only did the election include the nation's first female major-party candidate on the Democratic ticket but also a Republican candidate whose name recognition was generated partly from reality television. Contrary to prior elections in which the minority vote has been overlooked, some scholars and commentators alike positioned Asian Americans, Blacks and Latinos as the crucial voting blocs necessary for an electoral win in 2016 because of their importance in Barack Obama's electoral success (Barreto et al. Reference Barreto, Fraga, Manzano, Martinez-Ebers and Segura2008; Ong, De la Cruz-Viesca and Nakanishi Reference Ong, De la Cruz-Viesca and Nakanishi2008; Philpot, Shaw and McGowen Reference Philpot, Shaw and McGowen2009). This framing of the minority vote not only offered an important opportunity to generate feelings of efficacy among minority voters, it also generated public attention and interest in the politics of minority communities. This has led to more reliable public opinion data that we can use to answer growing numbers of questions about political participation and vote choice among Asian American voters.
This paper thus leverages new and innovative data to offer some answers about how Asian American voters cast their ballot in 2016. Like other communities of color, Asian Americans largely supported Clinton. Although exit polls can offer this basic finding, we do not know as much about what differentiates those Asian Americans who supported Clinton from those who supported Trump. Media analyses of white voting populations showed that those living in rural areas and those of lower socio-economic status, particularly those who hold strong working-class identities, were key predictors of white vote choice for Trump. Those living in urban and coastal areas were more likely to vote for Clinton (Confessore and Cohn Reference Confessore and Cohn2016; Morin Reference Morin2016). This raises the question, do the same predictors that determined support for Clinton and Trump among white voters apply to Asian American voters?
Most analyses about candidate preferences in presidential elections are typically about voters. Yet, our understanding of the preferences of Asian Americans is, in many ways, incomplete if it only includes an analysis of the voting population. According to the 2016 Current Population Survey, voters make up only 35% of the Asian American voting-age adult population.Footnote 1 This relatively small proportion of voters is largely attributed to the fact that nearly 60% of the Asian American population is foreign-born. Immigrants must cross major institutional barriers of citizenship and registration before they can participate in elections. Communities with large immigrant populations are thus less likely to have high proportions of voters. Developing a full picture of Asian American politics, then, requires that we examine challenges related to the political incorporation of new immigrant voters. This means that a more comprehensive take on Asian America would include an analysis of both voters and non-voters.
We begin this paper by first addressing the issue of political incorporation by comparing the demographic differences between Asian American voters and non-voters. This analysis can help point to useful strategies for incorporating more Asian Americans into the electorate. The second half of the paper then analyzes Asian American support for Clinton and Trump in the 2016 election. To understand how Asian American politics might be shifting over time, we first offer a brief comparison between Asian American voter attitudes in 2016 and 2008, the previous election with no sitting incumbent running for office. We then offer an analysis of the factors that predicted support for Clinton among voters. The final section offers a summary of candidate choice and other political attitudes among non-voters. We offer this analysis to evaluate how the politics of Asian Americans could shift as these non-voters are incorporated into the political system.
DATA
For this paper, we offer analyses of Asian American political incorporation and attitudes using the 2016 Collaborative Multi-Racial Post-Election Survey (CMPS). The CMPS was an online survey of 10,145 adults conducted between December 3 2016 and February 15 2017 that sought to develop representative samples of minority communities. Within this sample, there were 3,006 Asian American respondents interviewed for this survey. This survey was also unique because it was offered in multiple languages, including Chinese, Korean, and Vietnamese. While most nationally representative samples typically only include a handful of Asian American respondents, the CMPS offers a large sample size of Asian American respondents, which allows us to more fully examine the nuances of Asian American political attitudes following the election.
POLITICAL INCORPORATION: DIFFERENCES BETWEEN VOTERS AND NON-VOTERS
According to the U.S. Census, Asian Americans are the fastest growing racial group in the United States. In addition, data show that the proportional size of voters within Asian America has been increasing over the last few elections. According to the Current Population Survey (CPS), 49.9% of voting-age, Asian Americans citizens cast a ballot in 2016.Footnote 2 This represents almost a 2 percentage point increase from prior elections; CPS estimates that 47.9% of eligible Asian Americans voted in 2012 and 48% in 2008. Turnout patterns among Asian Americans over the last three presidential elections thus differed from that of other racial minorities. Both Black and Latino turnout declined between 2012 (when turnout rates were 66.6% and 48%, respectively) and 2016 (when turnout rates were 59.6% and 47.6%, respectively) (File Reference File2017).
The growing share of voters among Asian Americans is significant given that this group has often been framed as having low rates of participation, particularly when it comes to voting. Studies on political participation have historically shown that Asian Americans report lower turnout rates relative to other racial groups (Bowler and Segura Reference Bowler and Segura2012). On the one hand, their lower rates of voting and registration are surprising given that Asian Americans are more likely to have, on average, higher levels of the resources—such as education and income—that are associated with higher rates of voting (Verba, Schlozman and Brady Reference Verba, Schlozman and Brady1995). On the other hand, since a majority of the Asian American population are immigrants, processes of immigrant incorporation must be taken into account when explaining Asian American political participation rates (Lien, Conway and Wong Reference Lien, Conway and Wong2004; Ramakrishnan Reference Ramakrishnan2006; Tam Cho Reference Tam Cho1999; Wong Reference Wong2006; Wong et al. Reference Wong, Ramakrishnan, Lee and Junn2011). For example, once controlling for citizenship status, Current Population Survey data show that 87% of registered Asian Americans turned out to vote in 2016. Moreover, Asian Americans are found to be very participatory in activities that do not require citizenship status, such as making political donations (Tam Cho Reference Tam Cho2003), and challenging legal precedent in the courts (Haney Lopez Reference Haney Lopez2006).
So although the number of voters within Asian America is growing, a sizeable share of the population still does not vote. The two key dimensions separating voters and non-voters are citizenship and registration status. Immigrant non-citizens are obviously ineligible to register and vote. 44.3% of first-generation Asian Americans are ineligible. But even among eligible citizens, only 56.3% are registered to vote. This reflects a lower rate of voter registration relative to other racial and ethnic groups in the United States: 57.3% of Latinos and 69.4% of African Americans are registered to vote. The low registration rate is particularly striking when we disaggregate by foreign-born status: 49.3% of native-born Asian Americans are registered to vote while 34.9% of immigrant citizens are registered. (Krogstad and Lopez Reference Krogstad and Lopez2017).
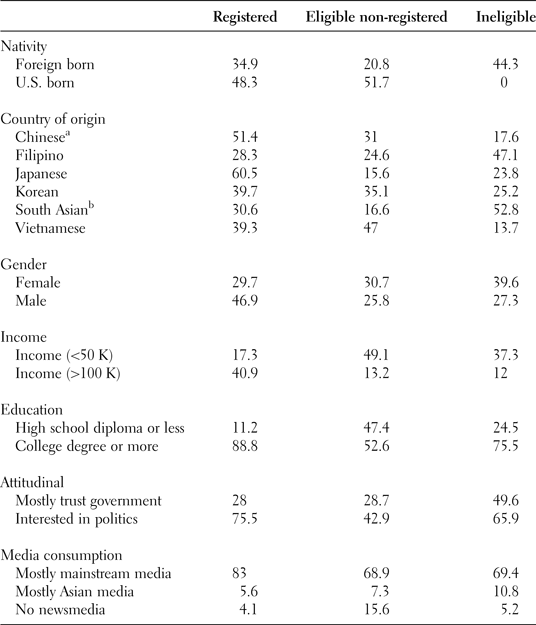
Registration rates can be one measure of the extent to which the population is politically incorporated (Lien Reference Lien and Cheng2017; Garza Reference Garza2004). Given this, it is useful to examine data on the non-registered population to better understand the challenges of political incorporation facing these Asian Americans. However, because the non-registered population includes both those who are ineligible to register and those who are eligible but have not registered to vote, we disaggregate the non-registered population into these two groups in this analysis. To begin, we calculate descriptive statistics for these two groups and compare their demographics with those who are, registered voters. Looking at Table 1, we find that registration rates vary by national origin. At 60.5%, Japanese Americans have the highest registration rate out of all Asian Americans, reflecting their long history in the United States. Ineligible voters make up the largest share of the Filipino and Southeast and South Asian populations. These groups constitute the majority of recent immigrants to the United States. The Vietnamese American population has a higher rate of citizenship (86.3% of the population are citizens), but only 39.3% of the population is registered to vote.
Comparison of socio-demographic characteristics across registered, eligible non-registered, and ineligible Asian Americans

Source: 2016 CMPS, data are weighted to reflect the national population.
a Includes Taiwanese.
b Includes Indian, Pakistani, Bangladeshi.
We also see that there is a gender disparity when it comes to registered and non-registered Asian Americans. Women are more likely than men to be non-registered or ineligible to vote. While 30% of women are registered to vote, 47% of men are. This is in direct contrast to nationwide averages, in which women are more likely to register and vote compared with men (File Reference File2015). When we look at socio-economic status, we see that 49.1% of Asian Americans with household incomes below $50,000 are eligible to vote, but are not registered. This contrasts with Asian Americans with incomes above $100,000. Forty-one percent of high-income respondents in the survey are registered to vote, while only 13% are eligible but unregistered. Similar patterns hold for education, where those with lower education levels are more likely to be unregistered even if they are eligible to vote.
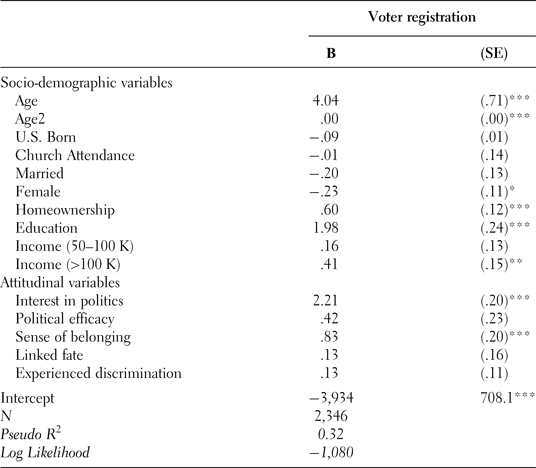
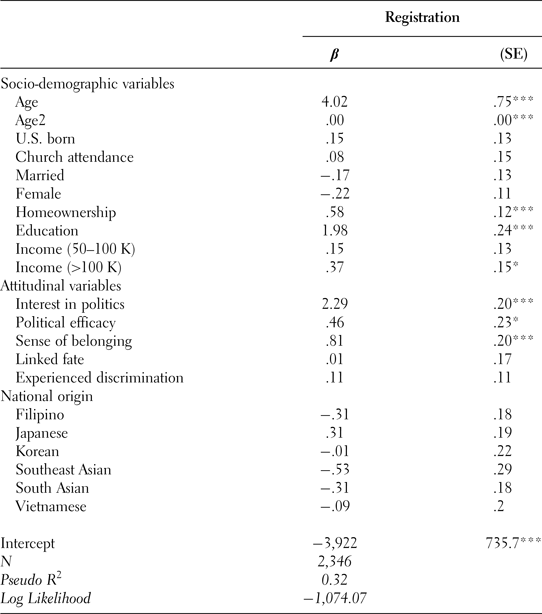
Given the distinctive characteristics of eligible non-voters, one question that arises is what predicts registration among eligible voters? To examine this, we ran a logit analysis among eligible Asian Americans, with registration status (zero for all non-registered and one for registered as the dependent variable). Respondents who were not citizens were excluded from this model. The model also included traditional control measures of educational attainment, income, gender, U.S. born, homeownership, and attendance at religious services (DeSipio Reference DeSipio1996; Verba and Nie Reference Verba and Nie1972; Verba, Scholzman, and Brady Reference Verba, Schlozman and Brady1995). In addition, we included attitudinal factors of interest in politics, political efficacy, feelings of linked fate, experience of discrimination, and a sense of belonging. We provide the question wording and coding for these variables in Appendix A.
Previous research on voter registration among whites tells us that those who are low in socio-economic status, women, and those who do not attend church are less likely to be registered (Bass and Casper Reference Bass and Casper2001; Verba and Nie Reference Verba and Nie1972; Verba, Schlozman, and Brady Reference Verba, Schlozman and Brady1995). For non-white populations, citizenship status remains a significant hurdle to cross before registration and political participation (Lien et al. Reference Lien2001; Lien, Conway, and Wong Reference Lien, Conway and Wong2004; Wong et al. Reference Wong, Ramakrishnan, Lee and Junn2011). We expect similar relationships will remain the case for Asian Americans. In terms of the attitudinal variables, we expect that Asian Americans who have high interest in politics, an increased sense of political efficacy, and high feelings of linked fate to other Asian Americans to be more likely to register than those who do not. Linked fate has been used as an explanatory variable for Asian American political participation in both experimental and survey settings, and has been found to have some traction in determining the likelihood to participate (Junn and Masuoka Reference Junn and Masuoka2008; Masuoka Reference Masuoka2006). Since registration is a precursor to voting, we anticipate that those with high linked fate will be more likely to register to vote compared with those with low linked fate. We also hypothesize that experiences with discrimination should motivate a person to look into additional avenues for political participation. Previous research suggests that Asian Americans have organized collectively across ethnicities in response to labor discrimination, segregation, and prejudice (see Okamoto Reference Okamoto2003) and so we anticipate that the experience of discrimination could also increase the desire to participate in the electoral process. Finally, citizens who feel politically efficacious are more likely to pay attention to politics, believe that their participation matters, and turnout to vote (Abramson Reference Abramson1983; Campbell, Gurin, and Miller Reference Campbell, Gerald and Warren1954). Since voting requires registration first and foremost, we expect that citizens high in political efficacy are more likely to register.
A new variable we include in this model is the respondent's sense of belonging in the United States. Belonging is characterized as the respondent's perceived integration into the social and cultural fabric of a country (Huddy and Khatib Reference Huddy and Khatib2007; Tajfel Reference Tajfel1981). Social belonging should precede political engagement in the sense that an individual must perceive of their own membership before they choose to become involved in the political system (Hoschchild and Lang Reference Hochschild and Charles2011; Maslow Reference Maslow1943; Ocampo Reference Ocampo2016). If a person reports a high sense of belonging in the United States, they should be more likely to participate politically compared with someone who feels less belonging. We, therefore, expect that Asian Americans who are lower on the belonging scale may feel distant from the American mainstream, leading them to not register and participate. Asian Americans have a long history of being viewed as outsiders and perpetual foreigners in the American racial hierarchy (Kim Reference Kim1999; Masuoka and Junn Reference Masuoka and Junn2013) and so this may explain why there is a subset of the population who is not engaged and not registered.
As seen in Table 2, the multivariate results are consistent with the descriptive statistics presented above. The model shows that Asian American women have lower odds of registration compared with men. Age has a parabolic relationship with registration—respondents at the younger and older end of the age continuum in our dataset are less likely to register than those in the middle. Homeownership, income greater than $100,000, and advances in educational attainment also significantly increased the likelihood of registration. Among attitudinal predictors, the effects of political efficacy, linked fate, and experiences of discrimination were statistically insignificant in our model. The only attitudinal predictors that were statistically significant were belonging and political interest. Earlier in our discussion, we mentioned that a sense of belonging is an important psychological factor that should be a necessary precondition to registration. The more a person feels like they belong in some aspect of U.S. society, the more likely they are to register to vote. Political interest also holds up in our model as another important predictor of likelihood to register. As a person becomes more interested in politics, they are more likely to register to vote.Footnote 3
Regression of registration status on socio-demographic variables and attitudinal variables among eligible Asian-Americans

*p < .10, **p < .05, ***p < .01.
Source: 2016 CMPS, data are unweighted.
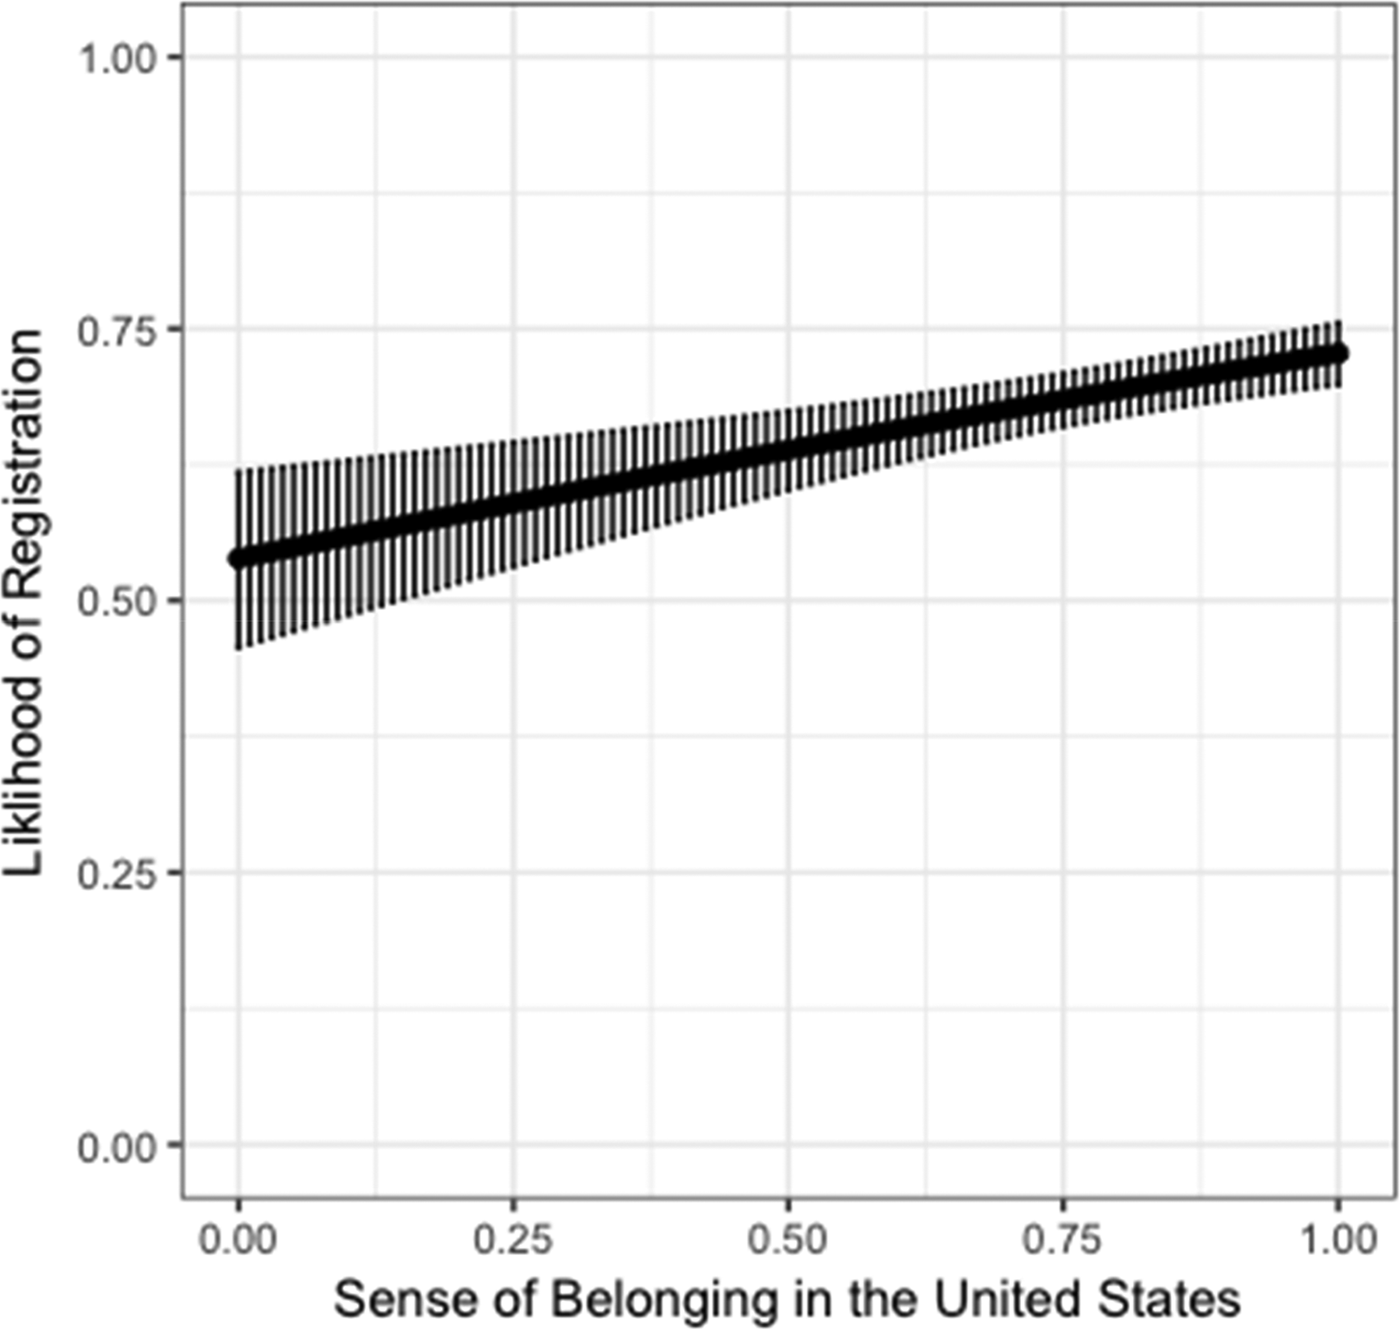
Since logit coefficients are difficult to interpret at face value, we calculated predicted probabilities to better illustrate the effects of a sense of belonging on registration (see Figure 1). The predictive probability shows that controlling for socio-economic and attitudinal factors, as an Asian American's sense of belonging goes from the lowest to the highest point on the response scale, their likelihood of registering to vote increases by about 25%. Controlling for personal socio-economic resources, religious service attendance, gender, and homeownership we find that psychological variables such as interest and belonging play a critical role in increasing the odds that an Asian American will register to vote. Although linked fate, political efficacy, and experiences with discrimination have been found to push Asian Americans towards the ballot box in some previous analyses, we do not find that these variables play as important of a role in propelling Asian American citizens to register. This suggests that the predictors to registration differ significantly from predictors of voter turnout.
Predicted Probabilities of Sense of Belonging on Registration. This predictive probability shows the likelihood of an Asian American citizen to register to vote as their hypothetical sense of belonging in the United States increases, controlling for age, gender, education, nativity, religious service attendance, homeownership, marital status, income, linked fate, experience with discrimination, interest in politics, and sense of efficacy.

There remains a substantial proportion of the Asian American citizen population that is not incorporated into the political structure. Unincorporated Asian Americans are poorer, have lower educational attainment, and are predominantly female. This is in stark contrast to the dominant narrative of Asian Americans having high socio-economic attainment. While those with higher socio-economic attainment are more likely to be incorporated, they do not provide a complete picture of Asian Americans. Future work may also look into the gender disparity to examine why Asian American women lack in voter registration relative to Asian American men and to other racial groups. Finally, the importance of a sense of belonging in predicting voter registration signals that unincorporated Asian Americans may feel distant from U.S. society, and thus more disengaged from politics.
ASIAN AMERICAN POLITICAL ATTITUDES IN THE ELECTION 2016
In this second section, we turn to an analysis of Asian American political attitudes in the 2016 Presidential election. We address the most common question asked after any competitive election: for which candidate did Asian Americans vote? Given our above analysis demonstrating the important differences between voters and non-voters, it may be the case that voters hold distinctly different attitudes compared with non-voters. If this is the case, then the successful mobilization and incorporation of non-voters could shift the future direction of the Asian American vote. Therefore, in addition to an analysis of voter preferences, we also offer an assessment of candidate preferences and political attitudes among non-voters.
Candidate Preferences among Voters
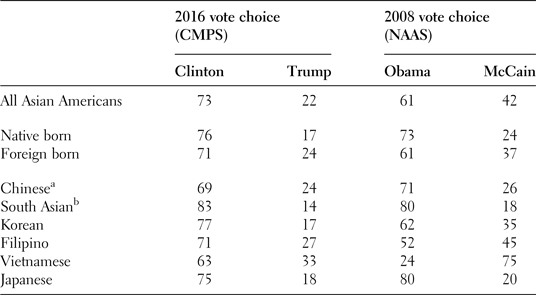
First, we examine candidate vote choice among Asian American voters. When we disaggregate this population to consider possible differences by immigrant status or national origin, we continue to find that regardless of how one analyzes the Asian American population, they were more likely to support Clinton compared with Trump. As Table 3 shows, both foreign-born and native-born Asian Americans overwhelmingly supported Clinton.Footnote 4 We also see that a slightly larger proportion of Asian immigrants voted for Trump compared with native-born Asian Americans. Considering the breakdowns by national origin group, all national origin groups supported Clinton in 2016. The highest level of support for Clinton came from South Asian voters, 83% of whom voted for the Democrat.
Candidate choice in the 2008 and 2016 election for Asian American voters

Percentages are rounded to the nearest whole number.
Data are weighted to the reflected national population.
a Chinese inlcudes Taiwanese.
b South Asian includes Indian, Pakistani, Bangladeshi.
In this way, Asian American vote choice in 2016 continues a 20-year pattern of Asian American support for Democratic candidates (Ramakrishnan Reference Ramakrishnan2016). Previous studies may have documented that Asian Americans are most likely to self-identify as Independent or as generally non-partisan (Hajnal and Lee Reference Hajnal and Lee2011). But when it ultimately comes down to casting a vote for a candidate, Asian American voters have trended towards the Democratic candidate. According to the CMPS, 72% of Asian American voters who identified as Independent or declined to state a party preference voted for Clinton. At the same time, support for Trump was low. Even those Asian Americans identifying as Republican cast ballots for other candidates: 36% of Republican-identified Asian Americans voted for Clinton or another candidate. In contrast, only 5% of Democrat-identified Asian Americans voted for Trump or another candidate.
But while Asian American voters have trended towards the Democratic party over time, we do find variation in levels of support for the Democratic candidate over different elections. We can compare vote choice figures between 2016 and 2008 using the 2008 National Asian American Survey.Footnote 5 In 2008, while there were more Asian Americans who voted for Obama compared with McCain, there was a larger share of Asian American voters willing to support the Republican candidate compared with what we saw in 2016. A proportionally larger share of foreign-born Asian Americans cast a ballot for McCain compared with the share that did for Trump. Moreover, Vietnamese American voters, who historically identify as Republican, overwhelmingly supported McCain in 2008, but Clinton in 2016. Filipino voters were also split more evenly in their support for the Democratic and Republican candidates in 2008 as compared with 2016. Thus, Asian American vote choice in 2016 did reflect a distinctive Democratic preference compared with previous elections.Footnote 6
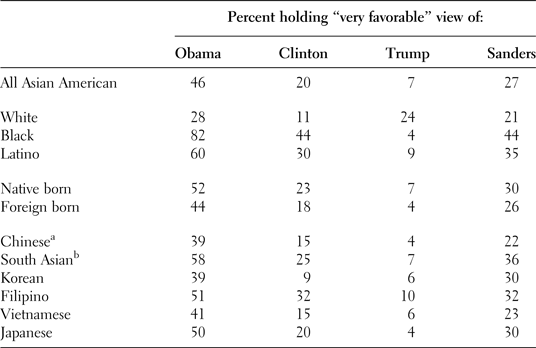
Interestingly, although most Asian Americans voted for Clinton in 2016, Asian American voters were not enthusiastic about her (see Table 4). Only 20% of Asian Americans felt “very favorable” towards Clinton. While all racial groups reported low favorability ratings of Clinton, Asian Americans’ ratings of Clinton were relatively low compared with Black and Latino ratings of Clinton: 44% of Blacks and 30% of Latinos reported “very favorable” ratings of Clinton. Asian Americans also awarded higher favorability ratings to other Democratic leaders relative to their rating of Clinton—especially President Obama and Democratic primary candidate Bernie Sanders. Levels of favorability towards Clinton were not uniform within the Asian American population, however: a somewhat higher proportion of native-born Asian Americans were favorable to Clinton compared with Asian immigrants. Filipinos had the largest share of respondents reporting high favorability of Clinton (35%), while only 9% of Koreans felt “very favorable” towards Clinton. Yet, even though Asian Americans were less favorable towards Clinton compared with other Democratic leaders, their favorability ratings of Trump were even lower. Thus, their overwhelming support for Clinton appears to be less a product of their strong support for Clinton than their strongly unfavorable views toward Trump. Overall, only 7% of Asian Americans felt “very favorable” towards Trump (49% reported feeling “very unfavorable” towards Trump. The numbers are higher for the native-born: 57% felt “very unfavorable” towards Trump.
Views of political leaders for Asian American voters

Percentages are rounded to the nearest whole number.
Data: 2016 CMPS, Data are weighted to reflect the national population.
a Includes Taiwanese.
b Includes Indian, Pakistani, Bangladeshi.
These descriptive patterns demonstrate important differences in political preferences when comparing across subgroups among Asian Americans. However, it is difficult to determine if the differences across nativity or national origin are, in fact, real differences or instead attributed to another factor that significantly varies across these groups. In order to identify the unique effect of each characteristic on candidate vote choice, we turn to multivariate analysis. The dependent variable for this analysis, is vote for Clinton—a dichotomous variable with “1” indicating voted for Clinton, and “0” otherwise. For independent variables, we include four sets of variables: socio-demographic factors, variables tracking media consumption, election-related factors and attitudinal variables. The socio-demographic variables we include are: age, nativity, marital status, gender, homeownership, education, income and church attendance. These variables were selected because they are employed in most studies on vote choice (Verba and Nie Reference Verba and Nie1972). For media consumption, the variables we include are: the amount of English media consumed and the amount of Asian-language media consumed. Both variables are dichotomous variables, with “1” indicating greater consumption of that kind of media. Wong et al. (Reference Wong, Ramakrishnan, Lee and Junn2011) argue that the consumption of English media can be used as a proxy for immigrant socialization. That is, those who rely on Asian-language ethnic media are less likely to be a citizen. To account for factors related to electoral politics, we included a variable accounting for partisanship. This variable is coded as a three-point Likert scale—Democrat, Independent, and Republican, with higher numbers indicating Republican identification. Finally, we consider the effect of key attitudinal factors: political efficacy, political interest, linked fate, experience of racial discrimination, and sense of belonging. For all of these variables, a higher value indicates a stronger sense of belonging, greater interest in politics, a higher sense of linked fate and the experience of discrimination. For a full description of the survey items used for these variables and their operationalization, please see Appendix A.
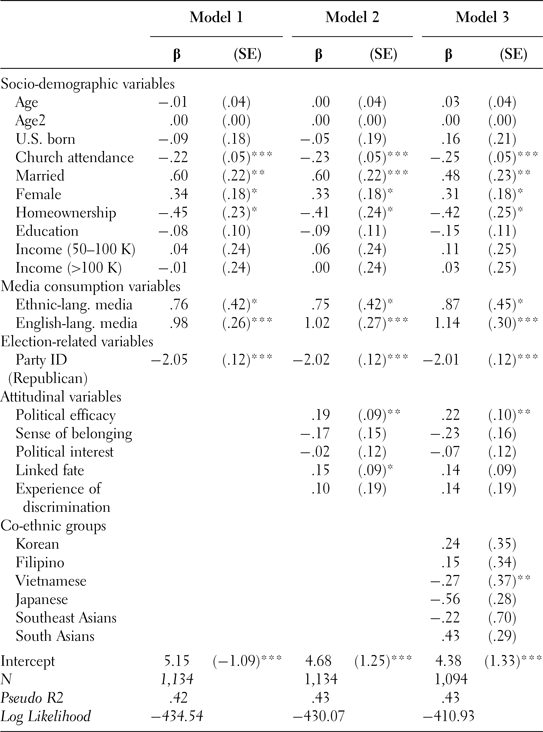
Since our dependent variable is dichotomous, we ran this analysis using a logit regression. We include three models: Model 1 represents the baseline model, which includes the socio-demographic, media and electoral variables, Model 2 adds the attitudinal variables, and Model 3 adds Asian national origin groups. The purpose of this approach is to examine whether the magnitude and direction of the baseline model variable change after adding the attitudinal and national origin variables to the model.
Table 5 summarizes the results. Model 1 shows that those identifying as Republican, frequently attending church, and owning homes are a less likely vote for Clinton, while those identifying as a Democrat, are female, and those who are married are more likely to support Clinton. Those patterns are relatively consistent with other models explaining Clinton support for Asian Americans (Ramakrishnan et al. Reference Ramakrishnan, Wong, Lee and Lee2016). High levels of consumption of English-language media are associated with Asian Americans’ support for Clinton. Likewise, although it is marginally statistically significant, consumption of ethnic-language media also has a positive correlation on support for Clinton. It is possible that these media consumption variables are proxies for the extent to which respondents are politically incorporated into the United States. Simple bivariate statistics show that 69% of U.S.-born and foreign-born Asian-American respondents watch English language media. In addition, foreign-born Asian American respondents who consume English-language media have lived in the United States for an average of 23 years. In comparison, those who primarily consume Asian-language media have lived in the United States for 13 years. Therefore, to some extent, the consumption of mainstream English language media tends to correlate with the length of the residence in the United States. The longer Asian immigrants live in the United States, the more they are exposed to American politics through English media. This reinforces Wong et al. (Reference Wong, Ramakrishnan, Lee and Junn2011)’s argument that English media consumption can serve as a proxy for socialization.
Predictors of vote choice for Clinton for Asian American voters

*<.10, **<.05, ***<.01.
Source: 2016 CMPS.
The variables in this regression are weighted.
Model 2 shows that higher levels of sense of political efficacy and a stronger sense of linked fate are positively associated with higher probabilities of voting for Hilary Clinton. When we calculated the predicted probabilities for political efficacy and linked fate, we found that when moving from the minimum value to the maximum value on each of these variables, the likelihood of voting for Clinton increased by 9.4% and 15%, respectively. Adding these attitudinal measures into the model does little to change the direction or magnitudes of the socio-demographic, media consumption, and electoral variables. This lends us the confidence that the effects of the attitudinal variables are consistent and robust.
Adding Asian national groups to the model (see Model 3) shows that being Vietnamese is associated with lower probabilities of voting for Clinton. The other national origin groups are not statistically significant. Furthermore, these additional variables also do not affect the direction or magnitude of the coefficients in general, except that the sense linked fate becomes statistically insignificant. Our conjecture is that since we added a lot of variables to the model, the influence of linked fate in accounting for the model variance is thus weakened and it narrowly misses the statistical significance. By and large, the impact of the attitudinal variables appears to be independent of those variables and consistent.
In short, the models in Table 5 evince a pattern of support for Hillary Clinton among Asian American voters that is consistent with other analyses of Asian American candidate choice in 2016 (see Ramakrishnan et al. Reference Ramakrishnan, Wong, Lee and Lee2016). We further found that similar socio-demographic factors that predicted support for Clinton among whites also predicted support for Clinton among Asian Americans. The analysis does not offer an answer for why this is the case, but we suspect that this is because the political messages had a similar mobilizing effect on Asian Americans as they did for white Americans. Interestingly, a sense of political efficacy was a key attitudinal factor that encouraged support for Clinton. Political efficacy has not typically been highlighted as a factor predicting Asian American support for Democratic candidates, so it may be the case that this finding is related to the specific context of the election. It could, however, also be the case that given the growing number of Asian American voters who have been added to the electorate over the past decade, those mobilization messages that have successfully resulted in voter turnout have also influenced support for Democratic candidates.
Candidate Preference and Political Preferences Among Non-Voters
Although there may be a clear pattern of the preferences and attitudes of Asian American voters, Asian American voters make up only half of the entire Asian American population. We do not have many analyses examining whether Asian American voters are reflective of the preferences of Asian American non-voters. If we disaggregate the population into voters and non-voters, we can then examine to what extent there are important attitudinal differences between these two groups. Given that incorporating these non-voters into future elections remains a pressing initiative for a range of political actors, we seek to address how the overall picture of Asian American preferences might change once non-voters are incorporated into the electorate. In this section we first we examine the attitudes of non-voters by looking at their rates of political interest, engagement, and partisan identification. We conclude this section by offering a summary of non-voters attitudes towards the 2016 presidential candidates. For this analysis, we continue to disaggregate non-voters into those who are eligible but not registered and those who are ineligible.
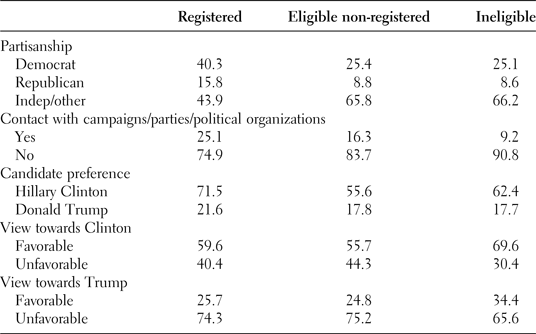
In terms of interest in politics, eligible non-registered respondents reported relatively low levels of political interest and affinity for mainstream politics. About 75% of registered Asian-Americans say they are “very interested” or “somewhat interested” interested in politics whereas only 43% of eligible non-registered Asian Americans report the same levels of interest (See Table 1). Registered voters understandably display higher levels of interest compared with other groups. After all, they are the ones who can directly participate in politics. Ineligible Asian Americans also display particularly high levels of interest in American politics (65.9%), even though they are legally unable to participate. What our data show here is that there is a steep drop in interest between ineligible Asian Americans and eligible non-registered Asian Americans. Given the demographic makeup of the Asian American population (who are predominantly foreign-born), it could be the case that either ineligible Asian Americans naturalize and register almost immediately or naturalize and then lapse into political apathy. The additional structural barrier of naturalization could potentially be responsible for making Asian Americans lapse in interest (Table 6).
Comparison of political attitudes across registered, eligible non-registered, and ineligible Asian Americans

Source: 2016 CMPS, data are weighted to reflect the national population.
If we measure engagement in politics partially as a function of media consumption, we find that Asian Americans generally keep informed by the news. Only 15.6% of eligible non-registered and 5.2% of ineligible Asian Americans report no news media consumption whatsoever. In contrast, 4.1% of registered respondents report that they do not watch the news. Moreover, Asian Americans, regardless of registration status, preferred mainstream or mostly mainstream news media, with very few relying on Asian-only ethnic media. In this way, we find few differences in engagement across registration groups.
In terms of party identification, eligible non-registered and ineligible respondents are much more likely to identify as Independent or “other” as a party; fully two-thirds of eligible non-registered respondents and ineligible respondents identify as Independent or “other” in terms of their partisanship. Asian Americans who are registered are slightly more likely to identify as Democrat (40.3%) and Republican (15.8%) but almost 44% of this group still identify as moderate or independent, despite registration status. Across all three groups (registered, eligible non-registered, and ineligible), Asian Americans do not display explicit partisan preferences, although there is a slight lean towards Democrat. This trend is consistent when it comes to political ideology. Forty-three percent of respondents thought of themselves as moderates, 34% as liberal, and 23% conservative.Footnote 7
This lack of political interest and affinity for mainstream politics among eligible non-registered respondents translated into relatively low levels of support for Clinton. Of the two non-voting groups, those who are eligible but non-registered reported the lowest preference for Clinton. When asked which candidate the respondent would support if that person could vote, 55.6% of eligible non-registered reported that they would support Clinton compared with the 62.4% of ineligible respondents. Views towards Clinton followed a similar trend, with 55.7% of eligible non-registered reporting favorable views towards Clinton. Ineligible Asian Americans were much more likely to report favorable views of Clinton at 69.6%, which is an even higher rate than that reported by registered voters. At the same time, of the three subgroups, ineligible Asian Americans were more favorable towards Trump at 34.4% reporting feeling “very/somewhat favorable” (compared with 24.8% for non-registered and 25.7% for registered). In contrast, eligible non-registered Asian Americans were the least likely to report support for Trump; only 17.8% put down Trump as their preferred candidate. Eligible non-registered Asian Americans were more likely to prefer a third party candidate compared with both the ineligible and registered voters. Since we also found that non-registered Asian Americans reported the lowest trust in government, this may be part of the reason why this group, in particular, is least open to Clinton (an establishment candidate), and the most likely to prefer an alternative candidate.
While incorporating these non-voters into elections will remain an important challenge for Asian America, their differences in political attitudes compared with voters may also change the overall picture of Asian American preferences once incorporated into the electorate. Ineligible Asian Americans, given their higher socio-economic status, may be more likely to register to vote after naturalization, compared with eligible non-registered population who has lower socio-economic attainment. Ineligible Asian Americans therefore, look more similar to registered Asian Americans in terms of educational attainment, income, and interest in politics. The strong independent or non-partisan preference among eligible non-registered and ineligible Asian Americans will also continue a trend among the Asian American electorate to not hold strong partisan identification. Yet, although Asian Americans are not wedded to either party, over the past few election cycles they have displayed a preference for Democratic candidates.
An important thing to note is that the Asian American electorate is often not targeted by political campaigns and organizations. Campaigns often view Asian Americans as difficult to target given the diversity of the population. Despite low mobilization efforts on behalf of candidates and campaigns, however, Asian American voters still turn out to participate at similar rates to that of Latinos. In fact, registration and turnout among Asian Americans was highest in Virginia, a battleground state that had significant campaign investment. By contrast, New York (home to the second largest Asian American population), has the lowest Asian American registration and turnout rate.Footnote 8 Low mobilization efforts in states that are not battleground states, such as New York and Hawaii, might be associated with otherwise eligible Asian Americans not participating.
LOOKING FORWARD TOWARDS 2020: LESSONS FOR ASIAN AMERICAN MOBILIZATION
This analysis of the 2016 election offers a number of important insights on Asian American vote choice and offers some useful lessons for Asian American mobilization in future elections. First, Asian American voters reflect a continued loyalty to the Democratic party. It may be the case that Asian Americans have not historically demonstrated the same level of overwhelming Democratic preference as what is found among Black Americans, but 2016 adds another election in which Asian American voters demonstrate a strong Democratic allegiance. Important to note is that in this election, Asian Americans offered support of the Democratic candidate even despite generally low favorability towards Clinton as a candidate. This trend speaks even more about their continued partisan support of the Democratic party.
We had anticipated that variables accounting for racial identity, such as linked fate and the experience of discrimination, would be clear predictors of vote choice in 2016. It could have been possible that the highly racialized nature of the 2016 election, in which issues such as immigration restriction, a Muslim ban, and criminal justice reform, were dominant features of the debate would have activated a racialized consciousness for Asian American voters. Although the linked fate variable reaches statistical significance in one of the models we specified, our analysis instead finds that other factors, in particular, political efficacy, were stronger predictors of support for Clinton. The connection between feelings of efficacy and support for the Democratic candidate has not been a common finding in studies on Asian American vote choice, which leads us to believe that this finding may be specific to the 2016 election. However, this finding does suggest that there are different messages outside those that highlight racial identity which can motivate Asian American voter support.
While the focus of this paper sought to explain Asian American vote choice in 2016, we also considered processes of Asian American incorporation into mainstream electoral politics. Having more in-depth data on the Asian American community through the CMPS allowed us to look at both voters and eligible non-voters in the population with greater nuance than before. Interestingly, we find that eligible non-voters have distinct preferences from voters in the Asian American population. First, they are poorer, have lower levels of educational attainment, and are more likely to be female. In addition, they report lower levels of interest and affinity for mainstream political institutions and candidates. In some ways not surprisingly, this underscores the fact that this population is less incorporated into civic and political life in the United States. Yet, the lack of incorporation does not mean that all non-voting Asian Americans are uninterested in politics. In fact, our analysis shows that those Asian Americans who are currently ineligible to vote report similar levels of interest in politics as those who are registered voters. Since their ineligibility is due primarily to their immigrant status, we might anticipate that these Asian Americans will cast a ballot once they acquire their citizenship status and are eligible to vote. Interestingly, those who are ineligible report similar partisan preferences as those who are registered which suggests that the incorporation of these Asian Americans may not change the overall pattern of Asian American vote choice.
But there is a significant share of Asian Americans who are eligible to vote but choose not to participate. These Asian Americans are less interested in politics compared with registered voters and the ineligible. This group raises questions about why are they disengaged in politics, and whether anything can be done to encourage them to vote. An important finding from this study shows that those who are eligible but not registered differ in their partisan preferences from registered voters and the ineligible. Therefore if mobilization strategies are successful in incorporating the eligible but non-registered into the electorate, then incorporating these Asian Americans may change the overall make-up of the Asian American vote given their divergent preferences.
In general, this study raises the question about whether mobilization efforts continue to be an important feature of Asian American political participation. On the one hand, it is striking that there exists a solid Asian American voting population which demonstrates clear Democratic loyalties even with such low levels of contact by political parties or other mainstream political institutions. However, on the other hand, the share of new immigrants and non-voters in the Asian American population means that this population is ripe for mobilization. Mobilizing institutions and actors thus potentially have the power to increase the size and direction of the Asian American vote.
ACKNOWLEDGMENTS
We would like to thank Marisa Abrajano, Jane Junn, and the participants at the USC Political Behavior conference for their helpful feedback and suggestions. We also thank Matt Barreto, Lorrie Frasure-Yokley, Janelle Wong, and Edward Vargas for organizing and implementing the 2016 Collaborative Multiracial Post-Election Survey (CMPS).
Appendix A. Question Wording and Operationalization of Variables
REGISTRATION
Are you currently registered to vote here in [Respondent's State]?
Yes = 1, No = 0
U.S. BORN
Were you born in the United States or another country?
United States (Inc Puerto Rico) = 1; Another country = 0
CITIZENSHIP
Which of the following best describes you…
I am a naturalized U.S. citizen = 1; Have applied for citizenship, but not yet finished/Legal permanent resident, but not applying for citizenship/I have a Visa/Not eligible to apply for citizenship = 0
CHURCH ATTENDANCE
Do you attend religious service or gathering: at least every week, almost every week, a few times a month, only a few times during the year, hardly ever or never?
Almost every week or more = 1; A few times a month = .75; Only a few times during the year = .5; Hardly ever = .25; Never = 0
INTEREST IN POLITICS
Some people are very interested in politics while other people cannot stand politics, how about you? Are you…
Very interested in politics = 1; Somewhat interested = .66; Not that interested in politics = .33; Not at all interested in politics = 0
POLITICAL EFFICACY
How much do you agree or disagree with the following statement: public officials do not care much what people like me think?
Strongly agree = 0; Agree = .25; Neither agree nor disagree = .5; Disagree = .75; Strongly disagree = 1
SENSE OF BELONGING
How strongly do you feel like you belong in the United States?
Strongly belong = 1; Moderately belong = .6; Slightly belong = .3; Not at all belong = 0
LINKED FATE
Do you think what happens generally to Asian people in this country will have something to do with what happens in your life?
Yes = 1; No = 0
EXPERIENCE DISCRIMINATION
Have you ever been treated unfairly or personally experienced discrimination because of your race, ethnicity, gender, sexuality, being an immigrant, religious heritage or having an accent?
Yes = 1; No = 0
MEDIA CONSUMPTION
We would like to know what news you feel like following right now. Please choose an outlet that you feel most like using at this moment.
Some English-language news outlets = 1, otherwise = 0; Some Asian-language news outlet = 1, otherwise = 0.
VOTE CHOICE (2016 CMPS)
In the election for President of the United States, did you vote for Hillary Clinton, Donald Trump, Gary Johnson, Jill Stein? Even if you did not vote, who did you support the most: Rotate list: Hillary Clinton, Donald Trump, Gary Johnson, Jill Stein?
Voted for Clinton or support Clinton most = 1, otherwise = 0; Voted for Trump or support Trump most = 1, otherwise = 0.
VOTE CHOICE (2008 NAAS)
Do you plan to vote for John McCain the Republican, or Barack Obama, the Democrat, or another candidate for President of the United States, or are you unsure at this point in time?
Plan to vote John McCain = 1, otherwise = 0; Plan to vote for Barack Obama = 1, otherwise = 0.
FAVORABILITY
Please indicate if you have a favorable view or unfavorable view of each person. If you haven't heard of them or are unfamiliar with them, that's fine.
Very favorable to Hillary Clinton = 1, otherwise = 0; Very favorable to Donald Trump = 1, otherwise = 0; Very favorable to Barack Obama = 1, otherwise = 0; Very favorable to Bernie Sanders = 1, otherwise = 0.
Regression of registration status on socio-demographic variables and attitudinal variables among eligible Asian-Americans with national-origin specific controls