


Introduction
Secular trends are a biological phenomenon that has been observed since the 19th century and include intergenerational changes in body size, changes in the timing of maturation, and so on (Ong et al., Reference Ong, Ahmed and Dunger2006; Non-Communicable Disease Risk Factor Collaboration [NCD-RisC], 2016). Height is an anthropometric measure of nutritional levels and health status during childhood and adolescence and can strongly predict health and developmental outcomes across the lifespan (NCD-RisC, 2020). Anthropometric data, such as height, also help to make clinical decisions and provide guidance for the development of public health policies related to health and nutrition (Bustamante et al., Reference Bustamante, Santos, Maia, Freitas, Garganta, Katzmarzyk and Pereira2025).
Human height is not only determined by genes, but also influenced by environmental factors such as geographic location, socioeconomic status, and emotional factors (Bogin et al., Reference Bogin, Hermanussen and Scheffler2022; Sinha et al., Reference Sinha, Shah, Osmond, Fall, Bhargava and Sachdev2022; NCD-RisC, 2023). Altitude is an important environmental factor that affects the height of children and adolescents (Bi et al., Reference Bi, Lin, Zhang, Gui and Shi2023; Bustamante et al., Reference Bustamante, Santos, Pereira, Freitas, Katzmarzyk and Maia2022 Reference Bustamante, Santos, Maia, Freitas, Garganta, Katzmarzyk and Pereira). People living at high altitude are challenged by natural environmental stresses such as low pressure, hypoxia, high radiation, wind and ultraviolet light, and corresponding plateau-associated symptomatic diseases and acute respiratory infections (Smith et al., Reference Smith, Lehmann, Coakley, Spooner and Alpers1991; Bustamante et al., Reference Bustamante, Santos, Maia, Freitas, Garganta, Katzmarzyk and Pereira2025). These environmental factors contribute to the short stature and the slow secular trend of children and adolescents at high altitude compared with their counterparts at low altitude (Bianba et al., Reference Bianba, Yangzong, Gonggalanzi, Berntsen, Andersen, Stigum, Nafstad and Bjertness2015; Bi et al., Reference Bi, Lin, Zhang, Gui and Shi2023; Bustamante et al., Reference Bustamante, Santos, Maia, Freitas, Garganta, Katzmarzyk and Pereira2025). Much evidence showed positive secular trends in height of children and adolescents globally or in many countries (NCD-RisC, 2020), but there is little evidence for those living at high altitudes. Recently, there have been only some updated data from Peru (Hoke and Leatherman, Reference Hoke and Leatherman2019; Bustamante et al., Reference Bustamante, Santos, Maia, Freitas, Garganta, Katzmarzyk and Pereira2025).
Tibet is located in the Qinghai-Tibet Plateau (QTP) with an average altitude of 4,000 m. Tibetans are the main ethnic group that has been living here for a long time, and according to the 2020 Population Census, the Tibetan population accounts for 86% of the total population in Tibet (Office of the Leading Group of the State Council for the Seventh National Population Census, 2022). In 1959, democratic reforms were implemented in Tibet, which completely abolished the feudal serfdom system and established a people’s democratic system. This greatly liberated social productive forces and promoted the development of agriculture and animal husbandry. In September 1965, the Tibet Autonomous Region was formally established, marking the full implementation of the system of regional ethnic autonomy in Tibet. Subsequently, Tibet’s capacity for self-development continued to strengthen, with rapid progress in socioeconomic development (The People’s Government of Xizang Autonomous Region, 2024). China’s rapid economic development and nutritional transition over the past few decades have contributed to a continuous increase in the height of children and adolescents (Li et al., Reference Li, Maimaiti, Zhou and Zang2024). Current evidence has suggested that there are subnational and ethnic differences in the secular trend in height among children and adolescents in China (Song et al., Reference Song, Hu, Zhang and Ma2015; Yan et al., Reference Yan, Liu, Ma, Zhang, Dang, Hu, Ma and Song2021). However, there is little evidence on the growth trends of Tibetan children and adolescents, and some recent surveys have only provided cross-sectional data (Bianba et al., Reference Bianba, Yangzong, Gonggalanzi, Berntsen, Andersen, Stigum, Nafstad and Bjertness2015; Bi et al., Reference Bi, Lin, Zhang, Gui and Shi2023). Lhasa, as the capital of Tibet, has an average altitude of 3,600 m and is located at the southwestern margin of the QTP. Since 1965, large-scale growth and development surveys of Tibetan students have been conducted in Lhasa, and much growth data have been accumulated (Hygiene Section of Health Epidemic Prevention Station of Tibet Autonomous Region, 1979; National Student Physical Fitness and Investigation Group, 1987). Previous studies reported that height increased among Tibetan students in Lhasa (Hygiene Section of Health Epidemic Prevention Station of Tibet Autonomous Region, 1979; National Student Physical Fitness and Investigation Group, 1987; Hu et al., Reference Hu, Ji, Zhao and Zhang2005; Ma et al., Reference Ma, Wu, Zhou, Yang, Tsren, He and Ye2009). However, these studies have a short time span, old data, and incomplete estimates. The long-term history of research and rigorous growth records in this region provides a unique opportunity to study the growth of Tibetan children and adolescents.
Besides investigating changes in body size, recognizing changes in pubertal developmental patterns can provide additional information on secular trends. Growth curves of children and adolescents are commonly used as a representative and easily measurable method of assessing pubertal growth and development in children and adolescents. The age at peak height velocity (APHV) obtained from growth curves reflects the onset of pubertal development, and the peak height velocity (PHV) reflects the velocity of pubertal development (Cole et al., Reference Cole and Mori2018; Gomula et al., Reference Gomula, Nowak-Szczepanska, Hermanussen, Scheffler and Koziel2021). Although fitting growth curves usually requires longitudinal data on height, this measurement is difficult and time-consuming (Aksglaede et al., Reference Aksglaede, Olsen, Sørensen and Juul2008), and some researchers have used cross-sectional data to fit curves to estimate biological parameters associated with pubertal growth spurts (Cole and Mori, Reference Cole and Mori2018; Gomula et al., Reference Gomula, Nowak-Szczepanska, Hermanussen, Scheffler and Koziel2021). The SuperImposition by Translation and Rotation (SITAR) growth curve model that was recently developed provides a new method for analysing pubertal height (Cole et al., Reference Cole, Donaldson and Ben-Shlomo2010). SITAR was a shape-invariant model that incorporated natural cubic splines. A notable feature of this model was its ability to estimate a baseline growth curve for the entire sample and to derive individual growth curves by adjusting specific parameters (referred to as random parameters), which was a capability not offered by random intercept-random slope models (such as the Preess-Baines growth curve). The SITAR model used a cubic transformation to convert complex growth data into three clinically relevant parameters that represented the size, tempo, and velocity of growth. SITAR was originally developed to simulate the growth trajectories of individual children or adolescents using longitudinal data. However, Cole and Mori (Reference Cole and Mori2018), Schneider and Ogasawara (Reference Schneider and Ogasawara2018), Ohuma et al. (Reference Ohuma, Bassani, Qamar, Yang and Roth2021), Schneider et al. (Reference Schneider, Ogasawara and Cole2021), and Zhang et al. (Reference Zhang, Wu, Zhong, Shao, Wei, Dong, Zhu, Tao and Wu2023) have recently demonstrated that SITAR could be applied to cross-sectional height, weight, and lung capacity data for children and adolescents stratified by sex. The SITAR model parameters derived from cross-sectional data were broadly similar to those derived from pseudo-cohort data and are effective in explaining population-average anthropometric growth trends (Cole and Mori, Reference Cole and Mori2018). When growth curves are fitted using cross-sectional samples, the curves resemble ‘growth curves’ of mean height by age, where ‘individual’ corresponds to a specific survey (Cole and Mori, Reference Cole and Mori2018).
Therefore, by several cross-sectional surveys from 1965 to 2019 in Lhasa, Tibet, this paper aimed to investigate secular trends and pubertal growth patterns in body height among Tibetan children and adolescents in China.
Methods
Data sources
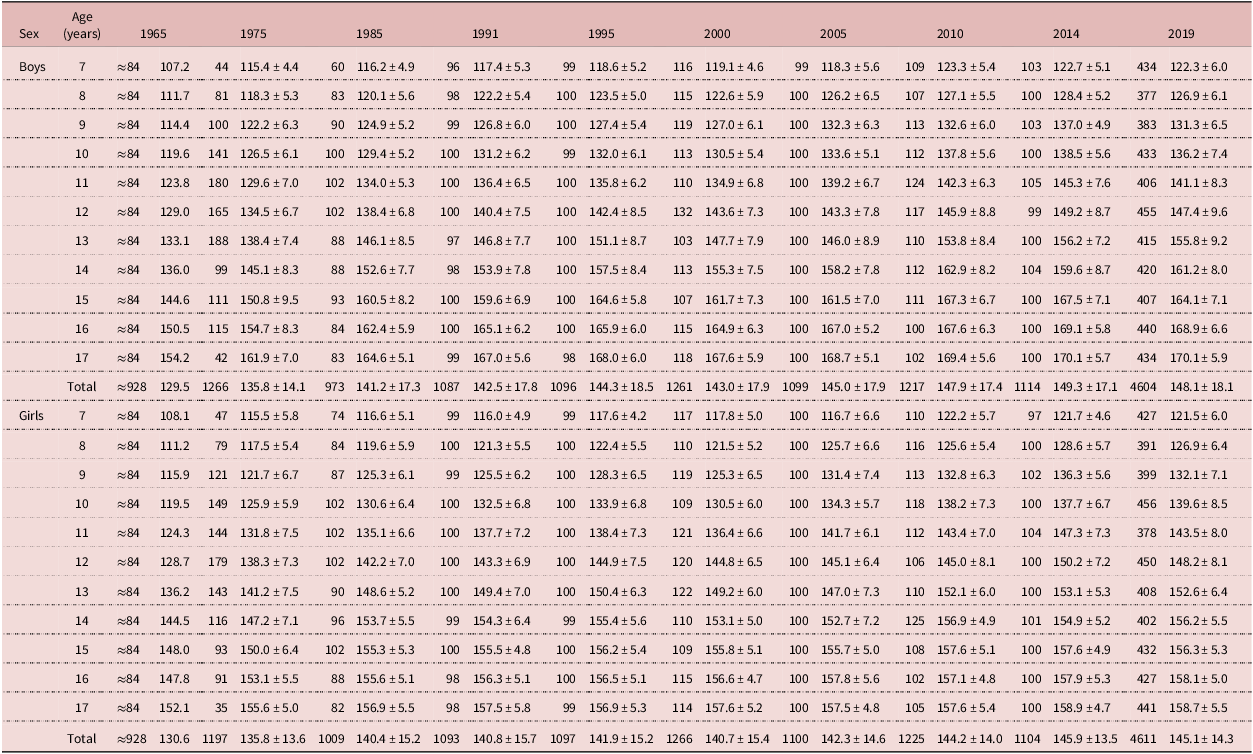
This study used published summary statistics from ten cross-sectional surveys from 1965 to 2019, which were reported in the literature (Hygiene Section of Health Epidemic Prevention Station of Tibet Autonomous Region, 1979; National Student Physical Fitness and Investigation Group, 1987, 1993, 1997, 2002; Hu et al., Reference Hu, Ji, Zhao and Zhang2005; National Student Physical Fitness and Investigation Group, 2007, 2012, 2016, 2022). Successive cross-sectional surveys were conducted in Lhasa in 1965 and 1975 by the Health and Epidemic Prevention Station of the Tibet Autonomous Region (now called the Center for Disease Control and Prevention of the Tibet Autonomous Region). Between April and June 1965, a total of 2,025 healthy samples of Tibetan students aged 7–18 years were obtained from six randomly selected schools in Lhasa using random cluster sampling. A total of 2,463 healthy samples of Tibetan students aged 7–17 years were obtained from the same schools in 1975 using the same sampling method. In 1985, the Ministry of Education, the Ministry of Health, the Ministry of Science and Technology, the National Ethnic Affairs Commission of the People’s Republic of China, and the General Administration of Sport of China organized the Chinese National Survey on Students’ Constitution and Health (CNSSCH). CNSSCH, China’s largest, most representative, and most authoritative survey of students’ physical fitness and health status, was conducted almost every five years, and has been conducted eight times so far (1985, 1991, 1995, 2000, 2005, 2010, 2014, and 2019). The Tibetan Survey on Students’ Constitution and Health is part of CNSSCH. The 1985 survey was conducted using a random cluster sampling, with three additional sampled schools in Lhasa added to the 1975 sample. Then, students were stratified by grade and sampled by class (cluster) to constitute a survey sample of healthy Tibetan students aged 7–18 years. The sample size for each sex and age group was almost the same. The 1985 and 1991 surveys were conducted from March to July, and each subsequent survey was conducted from September to November. The sampling methods, instruments, and measurement procedures of the CNSSCH were the same in each survey year. Staff members receive rigorous training. Ages in all surveys from 1965 to 2019 were calculated as exact ages. For example, the age of 7 years represents between 7 years with 1 day and 8 years. Finally, this study extracted height data for Tibetan children and adolescents aged 7–17 years from each survey (which was the sample that was included in all surveys), and these data included sex- and age-specific sample sizes, means, and standard deviations (SDs). Samples of 2,463, 1,982, 2,180, 2,193, 2,527, 2,199, 2,442, 2,218, and 9,215 were obtained in 1975, 1985, 1991, 1995, 2000, 2005, 2010, 2014, and 2019, respectively. Note that the 1965 survey data are only available for the total sample size and sex- and age-specific means. To facilitate subsequent calculations, the sample size was averaged for each sex and age group. All available data are shown in Table 1.
Sample sizes, means, and standard deviations of height among Tibetan children and adolescents by wave, sex and age

Table 1. Long description
The table presents data on sample sizes, means, and standard deviations of height among Tibetan children and adolescents aged 7 to 17 years, categorized by sex and age, across different survey years from 1965 to 2019. The table has 21 rows and 16 columns. The columns are labeled with the survey years: 1965, 1975, 1985, 1991, 1995, 2000, 2005, 2010, 2014, and 2019. The rows are labeled with age groups (7 to 17 years) and sex (Boys and Girls), followed by a total for each age group and sex. Each cell contains the sample size, mean height, and standard deviation for the corresponding age group, sex, and survey year. The table provides a comprehensive overview of the height data collected over the years, showing trends and variations in the height of Tibetan children and adolescents.
Note: The 1965 survey data are only available for the total sample size and sex- and age-specific means (2025 individuals aged 7–18 years). To facilitate subsequent calculations, the sample size was averaged for each sex and age group.
Measurements
Detailed records of the instruments and calibration procedures used in the 1965 and 1975 surveys were unavailable. Both surveys were conducted by the Health and Epidemic Prevention Station of the Tibet Autonomous Region, and the 1975 survey was conducted in the same schools as the 1965 survey using the same random cluster sampling approach. However, standardized methods for measuring standing height in children and adolescents had already been established in China before these surveys, including the national recommendations for child and adolescent growth surveys published in 1965 and the national anthropometric survey protocol developed in 1975 (Jiangxi Provincial Pediatrics Academic Conference and Sixth National Pediatrics Academic Conference of the Chinese Medical Association, 1965; Working group on the survey and research on children’s physical development, 1976). Contemporary Chinese anthropometric practice used either a wooden column-type stadiometer or a vertically fixed measuring scale with a horizontal headboard. Despite differences in instrument construction, these devices applied the same basic anthropometric principle; barefoot standing height was measured as the vertical distance from the vertex of the head to the standing surface, with the body positioned upright and a horizontal headboard placed against the vertex. From 1985 onwards, the CNSSCH used a mechanical stadiometer based on the same measurement principle and standardized standing posture. The apparatus recommended by Cameron (Reference Cameron1978) was used to measure height from 1985 to 2019. The students stood barefoot on the base plate with his/her back towards the column, and his/her trunk was naturally straight. The head was straight, and both eyes were looking straight ahead (the upper edge of the tragus was horizontal to the lower edge of the eye sockets). The upper limbs were naturally hanging down, and the legs were straight. Two heels together and toes separated by about 60°, heel, sacrum, and two scapula contact with the column, into a ‘three-point-one-line’ standing position. The staff slid down the horizontal platen along the column to the top of the head with one hand. Readings were taken when the staff’s eyes were horizontal to the plane of the horizontal platen. Records were taken in centimetres and were accurate to 0.1 centimetres (cm).
Statistical analysis
Means of height were classified by sex and age, and best-fitting/most parsimonious sample-weighted regressions (linear or quadratic or cubic regressions) were performed. The optimal model was selected according to the minimum Bayesian information criterion (BIC). The change was expressed as absolute change (i.e., the slope B of the regression), percentage change (% per year, i.e., the slope of the regression as a percentage of the sample-weighted mean of all means in the regression), and standardized (Cohen’s) effect size (ES) (i.e., the slope of the regression divided by the combined SD of all SDs in the regression). Note that a series of slopes on the polynomial curve was calculated by differentiating for each test year. Given that SDs were missing for 1965, the combined SDs were calculated using all SDs from 1975 to 2019. The above calculations were used to obtain sex- and age-specific annual changes (1966, 1967 … 2019). The change during the entire survey period was calculated as the sum of all annual changes. Following the procedure described by Tomkinson et al. (Reference Tomkinson, Kaster, Dooley, Fitzgerald, Annandale, Ferrar, Lang and Smith2021), population-weighted total changes (for boys and girls) were calculated by combining sex-age-specific changes using stratified population weighting in each test (Equation 1). Population-weighted changes ensured that trends across subgroups and periods remained comparable, eliminating the impact of differences in demographic characteristics. The population weighting was derived from the sex-age-specific Tibetan population data from the 2020 Population Census in China (Office of the Leading Group of the State Council for the Seventh National Population Census, 2022). The formula was as follows:
 $$\overline{\Delta }={\sum^k_{i=1} \Delta _i\cdot w_i \over \sum^k_{i=1} w_i}$$
Δ represents the population-weighted total change, Δ represents the sex-age-specific change, w represents the sex-age-specific population, and k represents the number of sex-age-specific groups. Total changes from 1965 to 2019 and changes per decade from 1965 to 1970, 1970 to 1980, 1980 to 1990, 1990 to 2000, 2000 to 2010, and 2010 to 2019 were calculated. The 95% confidence interval (CI) for the annual average change was calculated as the weighted average change ±1.96 standard errors (SEs). SEs were calculated as the annual weighted SD divided by the square root of the number of age groups. To account for the magnitude of changes in the mean, ESs of 0.2, 0.5, and 0.8 were used as thresholds for small, medium, and large, respectively, with ESs of <0.2 considered negligible changes (Cohen, Reference Cohen1988).
The SITAR model was fitted using the ‘sitar’ package version 1.4.0 in R version 4.4.2. The SITAR model fitted two growth curves, a height–distance curve and a height–velocity curve. For the longitudinal data, SITAR fitted the average growth curve for all individuals and the growth curve for each individual. The average growth curve can be adjusted to the growth curve of an individual by three random effects: size, tempo, and velocity (Cole et al., Reference Cole, Donaldson and Ben-Shlomo2010). The adjustment of size reflects the temporal change in adult height, although the adjustments of tempo and velocity reflect temporal changes in maturation velocity (Cole and Mori, Reference Cole and Mori2018). For height for boys and girls, two independent models were fitted, in which ten cross-sectional surveys were considered as ten individual growth curves. Age was calculated from the date of birth and the date of examination and subsequently classified into 1-year age intervals; for example, the 7-year age group comprised children aged ≥7.0 and <8.0 years. Because only age-specific summary statistics rather than individual exact ages were available for the present analyses, the midpoint of each 1-year age interval (i.e., 7.5, 8.5, …, 17.5 years) was used as the age coordinate when fitting the SITAR models, consistent with the approach used by Cole and Mori (Reference Cole and Mori2018). Size, tempo, and velocity were estimated as random effects with zero mean, along with the corresponding fixed effects included in the model. A natural cubic B-spline was used to model the mean height curve. The degrees of freedom (df) determine the flexibility of the spline, with lower df producing a smoother but potentially underfitted curve and higher df allowing greater flexibility at the cost of increased model complexity. Following the standard SITAR model-selection procedure, a series of otherwise identical models with different spline df were fitted separately for boys and girls, and the optimal df was selected according to the minimum BIC, which balances goodness of fit against model complexity (Cole et al., Reference Cole, Donaldson and Ben-Shlomo2010; Cole and Mori, Reference Cole and Mori2018). The optimal models had 4 df for boys and 5 df for girls. PHV and APHV were calculated for each survey using the ‘iapvbs’ package version 0.0.2 developed by Cao et al, (Reference Cao, Hui and Wong2018). Height–distance and height–velocity curves were plotted. Trends in PHV and APHV were estimated using sample-weighted linear regression. Two-sided P values < 0.05 were considered significant. All the statistical analyses were performed by using R 4.4.2 (R Foundation for Statistical Computing, Vienna, Austria) and Stata 17.0 (StataCorp, Texas, USA).
Results
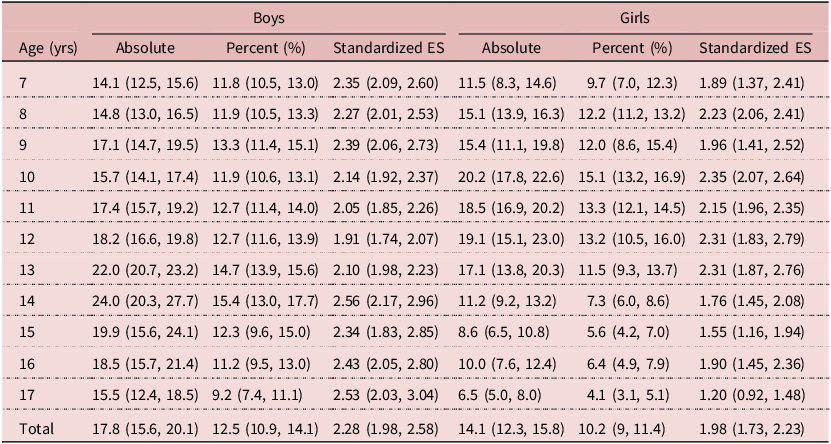
Table 1 shows the sample size, mean, and SD for sex- and age-specific heights across all survey years. From 1965 to 2019, height continued to increase for both boys and girls in each age group. During the entire survey period, population-based height increased by 17.8 cm (95% CI: 15.6 to 20.1 cm) or 12.5% (95% CI: 10.9 to 14.1%) or 2.28 ES (95% CI: 1.98 to 2.58 ES) for boys and by 14.1 cm (95% CI: 12.3 to 15.8 cm) or 10.2% (95% CI: 9.0 to 11.4 cm) or 1.98 ES (95% CI: 1.73 to 2.23 cm) for girls. Significant height increases occurred across all subgroups (1.20 ES to 2.56 ES). Among boys, the largest increase occurred at the age of 14 (24.0 cm or 2.56 ES), whereas the smallest increase was observed at the age of 7 (14.1 cm or 2.35 ES). Among girls, the largest increase occurred at the age of 10 (20.2 cm or 2.35 ES), and the smallest increase was at the age of 17 (6.5 cm or 1.20 ES) (Table 2).
Changes in means and 95% confidence intervals of height among Tibetan children and adolescents from 1965 to 2019

Table 2. Long description
The table presents data on the sample size, mean, and standard deviation for sex- and age-specific heights across all survey years from 1965 to 2019. It includes columns for age, absolute height, percent, and standardized ES for both boys and girls. The table has 12 rows for each age group from 7 to 17 years, plus a total row. For boys, the absolute height ranges from 14.1 cm at age 7 to 24.0 cm at age 14. For girls, the absolute height ranges from 11.5 cm at age 7 to 20.2 cm at age 10. The percent and standardized ES values vary across ages and sexes, indicating significant height increases over the survey period.
Note: Standardized ESs in means of 0.2, 0.5, and 0.8 are used as thresholds for small, moderate, and large, respectively, with an ES of<0.2 considered to be negligible. ES is the effect size.
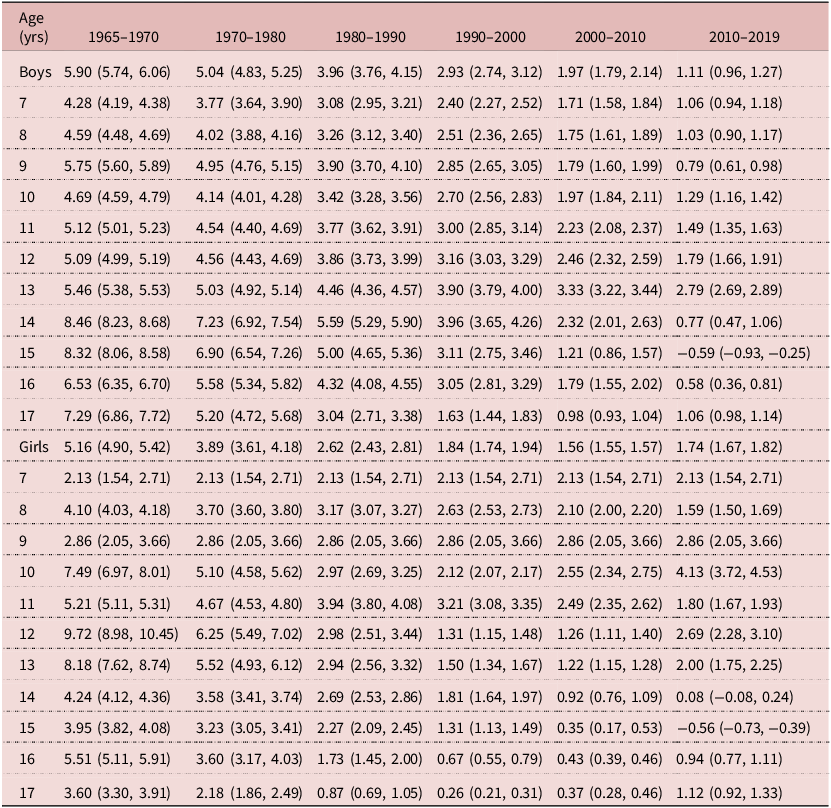
To investigate changes in the pace of trends in height, the changes in height per decade were estimated across periods. Among boys, there was a moderate increase per decade (5.90 cm or 0.76 ES) from 1965 to 1970, followed by a gradual deceleration in this trend. A small increase per decade (1.97 cm or 0.25 ES) occurred from 2000 to 2010, although the increase from 2010 to 2019 was negligible (1.11 cm or 0.14 ES). Trends for each age group were nearly consistent with those for the overall population in boys. The changes in the pace of trends in height differed from those in boys for girls. From 1965 to 1970, there was a moderate increase per decade (5.16 cm or 0.74 ES). The trend slowed during the 1970s and 1980s, with increases of 0.55 ES (3.89 cm) and 0.37 ES (2.62 cm) per decade, respectively. However, the trend remained stable for the subsequent 29 years, showing small increases per decade: 0.26 ES (1.84 cm), 0.21 ES (1.56 cm), and 0.24 ES (1.74 cm), respectively. Trends by age group differ from overall patterns among girls. Girls aged 7–11 years experienced significant increases per decade across all periods, even as the pace of trends slowed. Girls aged 12–17 years showed negligible changes per decade since the 21st century (Table 3, Figure 1).
Changes in effect sizes and 95% confidence intervals of height among Tibetan children and adolescents from 1965 to 2019 by period. Standardized effect sizes (ESs) in means of 0.2, 0.5, and 0.8 are used as thresholds for small, moderate, and large, respectively, with an ES of <0.2 considered to be negligible. Trends in means are estimated in each sex-age-specific group by best-fitting/most parsimonious regressions (linear or quadratic or cubic regressions).

Changes in means per decade and 95% confidence intervals of height among Tibetan children and adolescents from 1965 to 2019 by period (cm)

Table 3. Long description
The table presents data on changes in height per decade among Tibetan children and adolescents, categorized by age and gender, from 1965 to 2019. It includes 18 rows and 7 columns. The columns are labeled with the periods 1965-1970, 1970-1980, 1980-1990, 1990-2000, 2000-2010, and 2010-2019. The rows are labeled with age groups from 7 to 17 years, separated into boys and girls. Each cell contains the mean height change in centimeters and the 95% confidence interval for that period. Notable trends include a moderate increase in height per decade from 1965 to 1970 for both boys and girls, followed by a gradual deceleration in subsequent decades. For boys, the increase from 2010 to 2019 was negligible. For girls, the trend remained stable from 1990 to 2019, with small increases per decade. Girls aged 7-11 years experienced significant increases per decade across all periods, while girls aged 12-17 years showed negligible changes per decade since the 21st century.
Figures 2 and 3 show the growth spurt curves for Tibetan children and adolescents aged 7–17 years from 1965 to 2019 by sex. Both boys and girls experienced a growth spurt. Before the onset of the spurt, there was little difference in height between girls and boys. As girls entered the spurt earlier, their height surpassed that of boys. Later, when boys entered their growth spurt phase, their height exceeded that of girls after reaching the APHV. Across all ten cross-sectional surveys, average APHV for boys was 14.14 ± 0.83 years, later than that 10.85 ± 0.91 years for girls (t = 8.417, P < 0.001). The average PHV for boys was 7.04 ± 0.35 cm/year, exceeding that of girls at 5.86 ± 0.19 cm/year (t = 9.376, P < 0.001). From 1965 to 2019, the PHV for boys increased from 6.53 to 7.36 cm/year (P = 0.007), whereas the APHV decreased from 15.84 years to 13.39 years (P < 0.001). Girls showed no significant trend in PHV (P = 0.974), but APHV decreased from 12.85 years to 10.00 years (P < 0.001) (Table 4).
The growth curves of Tibetan boys aged 7–17 years by Superimposition by Translation and Rotation (SITAR) model according to sex in 1965 (a), 1975 (b), 1985 (c), 1991 (d),1995 (e), 2000 (f), 2005 (g), 2010 (h), 2014 (i), and 2019 (j). The solid and dashed curves on the left y-axis represent the fitted values from SITAR modal and observed values of height, respectively. The dashed curves on the right y-axis represents height velocity. The dashed vertical lines locate the peak height velocity and the age at peak height velocity.

The growth curves of Tibetan girls aged 7–17 years by Superimposition by Translation and Rotation (SITAR) model according to sex in 1965 (a), 1975 (b), 1985 (c), 1991 (d),1995 (e), 2000 (f), 2005 (g), 2010 (h), 2014 (I), and 2019 (J). The solid and dashed curves on the left y-axis represent the fitted values from SITAR modal and observed values of height, respectively. The dashed curves on the right y-axis represents height velocity. The dashed vertical lines locate the peak height velocity and the age at peak height velocity.

Figure 3. Long description
Panel A: A line graph for 1965 shows height in centimeters on the left y-axis and height velocity in centimeters per year on the right y-axis. The solid line represents fitted values from the SITAR model, while the dashed lines represent observed height values and height velocity. The vertical dashed line indicates the peak height velocity and the age at peak height velocity. Panel B: A line graph for 1975 with similar axes and representations as Panel A. Panel C: A line graph for 1985 with similar axes and representations as Panel A. Panel D: A line graph for 1991 with similar axes and representations as Panel A. Panel E: A line graph for 1995 with similar axes and representations as Panel A. Panel F: A line graph for 2000 with similar axes and representations as Panel A. Panel G: A line graph for 2005 with similar axes and representations as Panel A. Panel H: A line graph for 2010 with similar axes and representations as Panel A. Panel I: A line graph for 2014 with similar axes and representations as Panel A. Panel J: A line graph for 2019 with similar axes and representations as Panel A.
The peak height velocity and age at peak height velocity among Tibetan children and adolescents by wave and sex

Table 4. Long description
The table presents data on peak height velocity (PHV) and age at peak height velocity (APHV) for Tibetan boys and girls from 1965 to 2019. It has 11 columns and 4 rows, including headers. The columns are labeled: Sex, Tempo, 1965, 1975, 1985, 1991, 1995, 2000, 2005, 2010, 2014, 2019, B, and P. The rows are labeled: Boys PHV (cm/year), Boys APHV (year), Girls PHV (cm/year), and Girls APHV (year). Row 1: Boys PHV (cm/year): Tempo, 6.53, 6.36, 7.21, 7.03, 7.43, 7.16, 6.90, 7.27, 7.13, 7.36, 0.015, 0.007. Row 2: Boys APHV (year): Tempo, 15.84, 15.33, 14.18, 14.16, 13.70, 14.00, 14.02, 13.41, 13.38, 13.39, -0.041, <0.001. Row 3: Girls PHV (cm/year): Tempo, 5.90, 5.53, 6.04, 6.09, 6.01, 6.02, 5.63, 5.74, 5.83, 5.84, -0.0001, 0.974. Row 4: Girls APHV (year): Tempo, 12.85, 11.76, 11.08, 10.90, 10.67, 10.93, 10.49, 10.09, 9.77, 10.00, -0.045, <0.001.
PHV, peak height velocity; APHV, age at peak height velocity. Trends in PHV and APHV were estimated using sample-weighted linear regressions.
Discussion
This study found that the height of Tibetan children and adolescents has shown an upward trend over the past 50 years, which was consistent with previous research (Hu et al., Reference Hu, Ji, Zhao and Zhang2005; Ma et al., Reference Ma, Wu, Zhou, Yang, Tsren, He and Ye2009; Song et al., Reference Song, Hu, Zhang and Ma2015). Long-term growth trends represent one of the most significant biological phenomena in human development since the 19th century. A global study covering 200 countries and territories showed that the trends in height among children and adolescents in Western industrialized countries have nearly stagnated, whereas rapid increases have been observed in emerging economies, such as China (NCD-RisC, 2020). Evidence indicated that although the magnitude of increases varied, significant gains in child and adolescent height were observed across all regions and ethnic groups in China (Song et al., Reference Song, Hu, Zhang and Ma2015; Yan et al., Reference Yan, Liu, Ma, Zhang, Dang, Hu, Ma and Song2021). Although individual height is largely determined by genetic factors, environmental factors such as geographical setting, socioeconomic status, healthcare access and lifestyle habits also influence height development, particularly improvements in living conditions and socioeconomic progress (NCD-RisC, 2016, 2020; Bogin et al., Reference Bogin, Hermanussen and Scheffler2022; Sinha et al., Reference Sinha, Shah, Osmond, Fall, Bhargava and Sachdev2022; NCD-RisC, 2023).
Since the establishment of the Tibet Autonomous Region, the region has experienced rapid development in socioeconomic conditions, transportation, education, healthcare, and infrastructure construction (The People’s Government of Xizang Autonomous Region, 2024). During this study period, Tibet’s per capita gross domestic product increased from 241 yuan in 1965 to 48,902 yuan in 2019, when urbanization accelerated markedly; the proportion of the population living in urban areas increased from approximately 13% in 1980 to 31.5% in 2019 (Bureau of Statistics of Tibet Autonomous Region, 2020). Urbanization might improve access to food, sanitation, education, and healthcare, which were important environmental determinants of linear growth. Harris et al. (Reference Harris, Crawford, Yangzom, Pinzo, Gyaltsen and Hudes2001) reported stunting in 60% of nonurban Tibetan children aged ≥24 months compared with 35% of urban children, indicating the importance of living conditions beyond altitude itself. Living conditions associated with the cold high-altitude environment have also improved. Lhasa has a cold season lasting approximately 6 months, but a large-scale urban heating project initiated in 2012 achieved almost complete coverage of the built-up urban area by 2013, with heating coverage reaching approximately 98% by 2014; the proportion of heating provided by clean energy has gradually increased (People’s Government of the Tibet Autonomous Region, 2018). Although this improvement occurred relatively late in the study period and cannot explain the earlier secular gains, it illustrates the progressive reduction in cold stress and improvement in housing conditions experienced by recent cohorts. At the same time, the disease and healthcare environments changed markedly. Tibet expanded its vaccination and infectious-disease control programmes from the 1980s onwards, and the incidence and mortality of notifiable infectious diseases declined from 3,864.12 and 6.65 per 100,000 population in 1978 to 378.53 and 0.93 per 100,000 in 2019, respectively. Healthcare capacity also expanded substantially: the number of medical and health institutions increased from 193 in 1965 to 1,642 in 2019, when health technicians increased from 1.77 to 5.89 per 1,000 population (Bureau of Statistics of Tibet Autonomous Region, 2020). Reduced infectious-disease burden and improved access to healthcare may promote linear growth by reducing recurrent infection, inflammation, and associated nutritional losses during childhood. Additionally, given the constraints of environmental conditions and differences in lifestyle habits, residents in the Tibet region typically consume a relatively monotonous diet, with herders consuming almost no vegetables. Insufficient intake of nutrients, particularly high-quality protein, vitamins, minerals, and trace elements, impacts the growth and development of children and adolescents. In recent years, with regional economic development, the dietary structure of Tibetan children and adolescents has shifted from a low-protein, low-vitamin monotonous diet to a more diverse dietary pattern, further promoting growth and development (Ma et al., Reference Ma, Wu, Zhou, Yang, Tsren, He and Ye2009). In sum, altitude-related hypoxia remained a relatively persistent ecological constraint, whereas nutrition, housing and heating, urban living conditions, infectious-disease control, and healthcare access improved substantially over time. These changes may have progressively reduced non-hypoxic constraints on growth and allowed Tibetan children to express a greater proportion of their growth potential.
In terms of pace of long-term trends, the trends in height has gradually declined, aligning with the national pattern in China (Yan et al., Reference Yan, Liu, Ma, Zhang, Dang, Hu, Ma and Song2021; Li et al., Reference Li, Maimaiti, Zhou and Zang2024). The height of Chinese children and adolescents is approaching the upper limit of genetic potential, meaning that even with continued economic growth, height gains will no longer be as pronounced as before. Over the past 50 years, the trend in height has been significantly stronger for boys than for girls, with the height difference between 17-year-old Tibetan boys and girls increasing from 2.1 to 11.4 cm. This sex difference reflects a significant manifestation of sustained positive growth trends, meaning that the longer the growth trend persists, the greater the sexual height difference in adulthood. The underlying mechanism may stem from genetically determined sex differences in growth potential, with males exhibiting higher sensitivity than females to nutritional status, disease burden, and workloads (NCD-RisC, 2016; Li et al., Reference Li, Maimaiti, Zhou and Zang2024). However, the sexual height difference among Tibetan adolescents has not yet reached the 12∼13 cm observed among Han Chinese nationwide, and Han Chinese children and adolescents still possess growth potential for height (Li et al., Reference Li, Maimaiti, Zhou and Zang2024). Notably, although trends in height have declined compared with the period before the 21st century, this decline is more pronounced among boys. Since the 21st century, trends in height among girls have remained relatively stable. This may be related to the promotion of sexual equality. In China, due to the social perception of a ‘son preference’, boys generally receive more parental care and family nutrition. Moreover, in the past agricultural society, men were more needed for physical labour, and food allocation tended to prioritize boys’ nutritional needs (Zhou et al., Reference Zhou, Zhang, Li, Wan, Liu and He2025). Recently, campaigns promoting sexual equality in China, economic development, and institutional transformation have increased employment opportunities for women, with society placing greater emphasis on women’s health and equality. This finding might be considered within the context of broader changes in the gender-related social environment. Traditional son preference in China has been associated with sex differences in childhood growth, potentially through unequal intra-household allocation of nutritional and health resources (Kubo and Chaudhuri, Reference Kubo and Chaudhuri2017). Moreover, in the past agricultural society, men were more needed for physical labour, and food allocation tended to prioritize boys’ nutritional needs (Zhou et al., Reference Zhou, Zhang, Li, Wan, Liu and He2025). Over recent decades, however, son preference in China has gradually weakened alongside socioeconomic development and changing gender norms (Tang and Hou, Reference Tang and Hou2024). Such changes may have contributed to a more equitable allocation of health and nutritional resources and, consequently, to a reduction in earlier environmental constraints on girls’ growth. Nevertheless, this represents a social explanation for the observed sex difference in secular height gains rather than a direct causal relationship.
This study found that in 2019, the APHV for Tibetan boys and girls was 13.39 years and 10.00 years, respectively, with PHV estimates of 7.36 and 5.84 cm/year. The parameters of the adolescent growth spurt vary across different reports worldwide. The estimated APHV of 10.00 years in girls is earlier than that reported in most longitudinal studies. Longitudinal data from 2006 to 2016 reported APHVs of 12.7 years and 10.8 years for Chinese boys and girls, respectively, with PHVs of 9.6 cm/year and 8.7 cm/year (Chen et al., Reference Chen, Su, Zhang, Ma, Liu, Yang, Li, Gao, Chen, Ma, Wang, Wen, Jiang, Dong, Song and Ma2022). Repeated cross-sectional data from 1996 to 2012 reported that the APHV for Polish boys aged 7–18 years decreased from 14.4 to 13.0 years, whereas PHV showed no significant trend (7.12 to 7.72 cm/year) (Gomula et al., Reference Gomula, Nowak-Szczepanska, Hermanussen, Scheffler and Koziel2021). In Denmark, APHV decreased from 12.5 years to 12.0 years among girls born 1930–35 to those born 1965–70, and from 14.5 years to 14.2 years among boys born 1935–40 to those born 1965–69 (Aksglaede et al., Reference Aksglaede, Olsen, Sørensen and Juul2008). Among Swedish boys in birth cohorts from 1947 to 1996, APHV decreased from 14.16 to 13.7 years (Ohlsson et al., Reference Ohlsson, Bygdell, Celind, Sondén, Tidblad, Sävendahl and Kindblom2019). Unfortunately, considerable variation in APHV estimation methods limits comparability across studies. This study found that both Tibetan girls and boys exhibited an earlier trend in APHV, whereas boys showed an earlier trend in PHV, aligning with foreign research despite differing estimation methods (Aksglaede et al., Reference Aksglaede, Olsen, Sørensen and Juul2008; Ohlsson et al., Reference Ohlsson, Bygdell, Celind, Sondén, Tidblad, Sävendahl and Kindblom2019; Gomula et al., Reference Gomula, Nowak-Szczepanska, Hermanussen, Scheffler and Koziel2021). However, although girls experienced earlier pubertal development, their PHV did not show significant changes. This may be because girls typically undergo faster bone maturation during puberty compared to boys, have shorter growth periods, and possess lower growth spurt potential (Karlberg, Reference Karlberg2002). Beyond growth curves, the age of first nocturnal emission in boys and the age of menarche in girls are commonly used as key indicators for assessing pubertal development. Over the past decades, an advancing trend has been observed across nearly all regions of China (Ma et al., Reference Ma, Shi, Dang, Zhong, Liu, Cai, Dong, Hu, Ma and Song2023; Shi et al., Reference Shi, Ma, Liu, Dang, Zhong, Cai, Hu, Ma, Song and Lau2023). Previous studies indicate that the temporal trend of puberty is negatively correlated with body mass index or overweight/obesity (Ohlsson et al., Reference Ohlsson, Bygdell, Celind, Sondén, Tidblad, Sävendahl and Kindblom2019; Chen et al., Reference Chen, Su, Zhang, Ma, Liu, Yang, Li, Gao, Chen, Ma, Wang, Wen, Jiang, Dong, Song and Ma2022). In a nationally representative Mexican sample, APHV was estimated at 10.4 years in normal-weight girls and 9.6 years in girls with overweight/obesity (Flores et al., Reference Flores, Datta Banik, Cameron and Fragoso2024). A study of children living at approximately 3,800 m in Puno, Peru, reported an APHV of 9.96 years in girls (Sanchez-Macedo et al., Reference Sanchez-Macedo, Vidal-Espinoza, Minango-Negrete, Ronque, Campos, Fuentes-López, Vargas-Ramos, Rivera-Portugal, Cossio-Bolaños and Gomez-Campos2024). Given that the present estimates were derived from cross-sectional age-specific mean height data, APHV represents the age of maximum velocity of the population-average growth curve rather than the timing of PHV in individual children. Thus, the results provide stronger evidence for a secular advancement in population-level growth tempo than for an exceptionally early individual pubertal milestone. Adolescence represents a critical developmental period for children and adolescents. It is recommended to initiate early sexual education for Tibetan children and adolescents in schools and communities, paying close attention to their physical and psychological characteristics during puberty. Strengthening nutritional and psychological education will help them develop healthy behaviours and lifestyle habits, thereby promoting the healthy growth of Tibetan children and adolescents.
This study analysed long-term trends in height and changes in the pubertal growth spurt among Tibetan children and adolescents using data spanning several decades. Consistent sampling methods and survey sites across years minimized estimation errors. The study has several limitations. First, although APHV serves as a proxy for pubertal timing, it is derived from direct height measurements, providing an objective estimate of pubertal timing. APHVs are closely correlated with actual pubertal timing, as these data derive from physical examinations of secondary sexual characteristics. In contrast, self-reported pubertal timing shows a moderate association with physician-confirmed secondary sexual characteristics. Second, findings from cross-sectional surveys rather than longitudinal cohort studies may not accurately reflect secular trends in height. Because the data at each age point were derived from different populations, the APHV and PHV estimated by the model represented the peak age and peak growth velocity of the population-average curve, respectively, and could not be interpreted as the timing of individual maturation, growth intensity, or interindividual variation. Individual heterogeneity in maturation timing might cause the population growth curve to flatten, resulting in PHV being more significantly affected than APHV. Although the SITAR model yielded more accurate size and tempo parameters when fitting growth curves from cross-sectional data compared with longitudinal data, it might underestimate the velocity effect (Cole and Mori, Reference Cole and Mori2018); however, trend information remains valuable. Third, as individual-level data were unavailable, group-level analyses could not adjust for factors such as socioeconomic status, physical activity, and nutritional status, limiting the interpretation of trends. Fourth, the SDs of height were unavailable for the 1965 survey. Although SDs were not used in fitting the linear and polynomial regression models, and their absence therefore hardly did affect the estimated temporal trends in mean height expressed in centimetres, ESs involving 1965 were standardized using a common pooled SD derived from the available data for 1975–2019. This approach assumes that the dispersion of height in 1965 was broadly comparable to that observed in subsequent surveys. If the actual variability in 1965 differed materially from that in later years, the absolute magnitude and potentially the conventional classification of the standardized ESs may have been over- or underestimated. Nevertheless, because the same standardizing denominator was applied across survey waves, this limitation does not affect the direction or overall pattern of the temporal changes in mean height. Fifth, the absence of detailed records on the specific instruments, calibration procedures, and field quality-control procedures used in 1965 and 1975 remains a limitation. Earlier Chinese anthropometric surveys commonly used wooden or other stadiometers, whereas the CNSSCH subsequently used standardized mechanical stadiometers. Although these instruments were based on essentially the same measurement principle and standing-height protocol, differences in instrument calibration or field implementation could have introduced systematic measurement error in the early waves. Such error cannot be quantified retrospectively and may have affected the exact magnitude of secular change involving the 1965 and 1975 measurements. However, because the basic anatomical definition, standing posture, and vertical measurement principle were consistent across methods, a major discontinuity caused solely by a change in measurement technique appears unlikely. Nevertheless, unrecorded differences in instrument calibration or field implementation could have introduced some systematic error and may have affected the accuracy. Finally, the study population consisted of Tibetan children and adolescents in Lhasa, and findings should be cautiously applied to the entire Tibetan population nationwide. Future research requires larger-scale growth monitoring and larger-sample surveys to investigate the growth and development levels of Tibetan children and adolescents.
Conclusion
This study reveals a secular trend of significant increases in height among Tibetan children and adolescents in Lhasa from 1965 to 2019, with a recent deceleration in trends, particularly among boys. Puberty development has advanced in both boys and girls. These changes are closely linked to Tibet’s socioeconomic development and improved nutritional conditions, while also suggesting that growth potential may be gradually approaching a plateau phase. More public health policies are needed to promote the growth and development of Tibetan children and adolescents and prevent negative impacts from sustained growth. To address the trend of earlier puberty, systematic early sexual education and health guidance should be implemented in schools and communities. Concurrently, a continuous growth and development monitoring system should be established to support the healthy growth of this population.
Data availability statement
The data analysed during this study have been published openly and are freely available.
Acknowledgements
We thank all staff who worked on the survey on the growth and development of children and adolescents in Lhasa from 1965 to 2019.
Funding statement
This research received no specific grant from any funding agency, commercial entity, or not-for-profit organization.
Competing interests
The authors have no conflicts of interest to declare.
Ethical standard
The authors assert that all procedures contributing to this work comply with the ethical standards of the relevant national and institutional committees on human experimentation and with the Helsinki Declaration of 1975, as revised in 2008. The participants provided their written informed consent to participate in this study. The summary statistics analysed during this study have been published openly and are freely available.





 Open access

