Introduction
As a result of the increased demand for locally grown foods and the growing number of farmers' markets and community-supported agriculture organizations (CSAs), the number of farm operations classified as vegetable and melon farms (North American Industry Classification System code 1112) increased in Alabama, Arkansas, Florida, Georgia, Louisiana, Mississippi and South Carolina from 5657 operations in 2002 to 6287 operations in 2007Reference Darby, Batte, Ernst and Roe 1 – 4 . These states comprise the southern farm production region as defined by the United States Department of Agriculture, National Agricultural Statistics Service (USDA, NASS) 5 . In Alabama, the number of vegetable and melon farms increased by 133 operations from 2002 to 2007. In 2007, Alabama had the highest number of vegetable and melon farms among states in the southern region, at 1118 operations 4 .
Tomatoes (Solanum lycopersicum L.) were produced on 712 of the Alabama vegetable and melon farms in 2007. However, tomato production peaked in Alabama in the mid-1970s at 3764 ha, and has steadily declined over the past 30 years. Since 1999, tomato producers have, on average, planted 526 ha yr−1. While the production area has declined, per hectare yield has increased from 23,453 kg ha−1 in 1999 to 42,095 kg ha−1 in 2011 4 .
Vegetable production requires a high level of management to control a wide variety of pests. Producers are faced with high production costs, variable prices and unpredictable weather. One production alternative available to vegetable producers is to adopt a conservation tillage system using winter cover crops, such as cereal rye (Secale cereale L.) and crimson clover (Trifolium incarnatum L.). Conservation systems are utilized in row crop production but have not been readily adopted into vegetable production. Cover crops provide a variety of agronomic benefits that include improved soil physical properties, increased soil organic carbon, soil moisture conservation, reduced surface runoff, weed control and nutrient cyclingReference Ducamp, Arriaga, Balkcom, Prior, van Santen and Mitchell 6 – Reference Snapp, Swinton, Labarta, Mutch, Black, Leep, Nyiraneza and O'Neil 10 . Many of the agronomic benefits can be translated into economic benefits by decreasing input costs and stabilizing yield variability.
Previous research has shown that cover crop use in tomato production is a feasible alternative to plastic mulch. Kornecki and Arriaga reported that marketable tomato yields produced using a rye or clover cover crop were greater than or equal to marketable tomato yields produced under plastic in 3 out of 4 years in AlabamaReference Kornecki and Arriaga 8 . Sainju et al. concluded that, in Georgia, the use of a legume cover crop increased tomato fruit yield compared with no cover cropReference Sainju, Singh and Whitehead 9 . The use of cover crops, particularly hairy vetch (Vicia villosa Roth.), also has the potential to increase yield by extending the harvest seasonReference Teasdale and Abdul-Baki 11 and producing higher yieldsReference Abdul-Baki, Teasdale, Goth and Haynes 12 , Reference Campiglia, Mancinelli, Radicetti and Caporali 13 .
While the use of a conservation system using cover crops has numerous agronomic benefits, it also has the potential to decrease production costs. Under a conservation system using cover crops, producers no longer have to purchase plastic, prepare bed, and remove plastic mulch after harvest, thereby decreasing labor needed for tomato production. Iráizoz et al. estimated technical efficiency for horticulture production in Spain, and concluded that tomato production inputs were used more efficiently when operations increased output per labor unitReference Iráizoz, Rapún and Zabaleta 14 . While the conservation system requires establishment and termination of a cover crop, less labor is needed to produce tomatoes.
The economic impact of cover crop use in tomato production is mixed in the literature. Results differ by type of cover crop and growing conditions. Kelly et al. concluded that, in Maryland from 1991 to 1993, returns were higher in a hairy vetch system than in a plastic systemReference Kelly, Lu, Adbul-Baki and Teasdale 15 . The hairy vetch system produced higher yields with an extended harvest season. In other research conducted in Maryland, Wu et al., using data for 1997–1999, stated that revenue and net returns for a hairy vetch system as compared to a plastic system were varied, depending on growing conditionsReference Wu, Liu, Mills, Coffman and Teasdale 16 . Research in Virginia conducted between 1998 and 1999, produced similar results with limited economic viability of organic mulch in tomato production as compared to plastic mulchReference Sterrett, Hohlt and Savage 17 . Kelly et al. and Wu et al. both used a safety-first criterion (SFC) to examine production risk; however, the results were mixedReference Kelly, Lu, Adbul-Baki and Teasdale 15 , Reference Wu, Liu, Mills, Coffman and Teasdale 16 . Kelly et al. reported that hairy vetch is the least risky alternative under the given study conditionsReference Kelly, Lu, Adbul-Baki and Teasdale 15 , while Wu et al. showed plastic mulch had the lowest economic riskReference Wu, Liu, Mills, Coffman and Teasdale 16 .
Assuming that producers accept different levels of economic risk, it is important to evaluate production treatments relative to risk, along with net returns. For example, a treatment may have the highest net return as well as the highest level of economic risk. Most previous tomato literature applies the SFC to analyze risk. One alternative to the SFC for conducting risk analysis is to compare estimated net returns for the production alternatives for different risk aversion levels using the stochastic efficiency with respect to a function (SERF) methodReference Richardson, Schumann and Feldman 18 , utilizing the Simulation and Econometrics to Analyze Risk (SIMETAR) softwareReference Hardaker, Richardson, Lien and Schumann 19 to simulate net return, yield and price distributions. This method has been applied to other agriculture-related topics in previous literature, such as comparing the economic performance of different tillage systems, farm policies, rental arrangements and integrated weed management alternativesReference Archer and Reicosky 20 – Reference Williams, Llewelyn, Pendell, Schlegel and Dumler 26 .
Tomato production is a relatively small portion of agricultural sales in Alabama and across the Southeast; however, demand for locally grown vegetables is increasingReference Brown and Miller 27 , Reference Wixson, Katchova, Woods and Hu 28 . Tomato producers are faced with uncertain yields and prices, and utilizing a production system that will reduce economic risk while maintaining yield may keep tomato producers economically sustainable into the future. A conservation production system with high biomass cover crops may be an economically viable alternative for tomato producers in Alabama. The objective of this study was to estimate the profitability of alternative production systems using different cover crops (cereal rye and crimson clover) and different subsoiler shanks for fresh-market tomato production relative to a commonly used plastic mulch system, and to determine the preferred treatment using risk analysis.
Materials and Methods
Field experiment
The study was conducted during the 2005–2008 growing seasons at the North Alabama Horticultural Research Station (NAHRS) in Cullman, AL on a Hartselle fine sandy loam soil (fine-loamy, siliceous, sub-active, thermic Typic Hapludults). The experimental design was a split plot with four treatment replications, and it was initiated in the fall of 2004. The cover treatment was comprised of three cover types: plastic mulch, cereal rye and crimson clover. For each cover crop (cereal rye and crimson clover) treatment, three subsoil shanks treatments were applied: no shank, slim shank and wide shank. Each treatment option was compared to the plastic mulch treatment, which is the typical method used in tomato production in Alabama. The plots were 2.8 m wide and had a single row of tomatoes in the middle.
Each fall (2004–2007) cover crops were planted with a no-till drill (AGCO-TYE Grain Drill, Model 124-530X, Duluth, Georgia, USA) in rows 18 cm apart in plots 6.1 m long. The cover crops were planted on October 28, October 30, October 19, and November 2 in 2004, 2005, 2006 and 2007, respectively. Cereal rye was seeded at a rate of 101 kg ha−1, and crimson clover was seeded at 28 kg ha−1. Each spring (2005–2008), nitrogen was applied to the cereal rye plots at a rate of 67 kg ha−1. The winter cover crops were terminated on April 8, April 12, April 9 and April 17 in 2005, 2006, 2007 and 2008, respectively, with one pass with a mechanical roller crimper, followed by a supplemental chemical application of glyphosate at a rate of 1.1 kg ha−1 (a.i.). The roller crimper was 2.8 m wide and consisted of a round drum with equally spaced blunt, straight, steel bars around the drum's circumference and across the drum's length. The cover crops were terminated at the early milk stage for rye and the full flowering stage for clover. Cover crop termination was completed approximately 3 weeks before transplanting tomatoes to eliminate the potential for competition for water and nutrients between the cash crop and the cover crop. Tomato cultivar Florida 47 seedlings were transplanted on May 4, May 15, May 2 and May 1 in 2005, 2006, 2007 and 2008, respectively. Fourteen seedlings per plot (38 cm spacing between plants) were planted using a modified RJ No-Till transplanter (RJ Equipment, Blenhiem, ON, Canada). The experiment is described in detail by Kornecki and ArriagaReference Kornecki and Arriaga 8 .
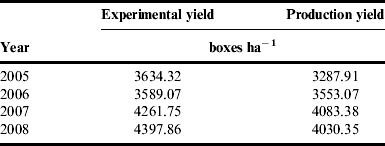
Tomatoes were harvested on a weekly basis from July 2 to August 15, 2005, from August 3 to August 23, 2006, from July 24 to August 20, 2007, and from July 21 to August 18, 2008. Marketable yields are used in this study, which does not include damaged or diseased fruit. The fruit were graded by size (small, medium, large and extra-large). The tomato yields presented in this paper are experimental yields, and are potentially higher than yields realized by the average tomato producer in Alabama. However, as shown in Table 1, the average experimental yields were consistent with average yields in Alabama in each of the 4 years of the study. Although the average experimental yields were higher than average production yields in each year, production yields were 90% or greater of the average experimental yields. The largest difference between the two yields (367.51 kg ha−1) occurred in 2008.
Average experimental yields at the NAHRS in Cullman, AL compared to average Alabama production yields, 2005–2008 (USDA, 2012b).

Economic analysis
For the purposes of this analysis, profitability was defined by net returns. Net returns were calculated as the difference between gross revenues and production costs for each treatment on a dollar per hectare basis. Gross revenues were calculated based on the average weekly dollar per box price for tomatoes based on grades (small, medium, large and extra-large) at the terminal market in Atlanta, Georgia 29 . The weight of a box was 11.34 kg. Low- and high-end prices were reported for each grade category from different suppliers (domestic suppliers aggregated by State). Prices from international suppliers (such as Mexico) were not considered. The low-end tomato prices by size averaged over 2005–2008 are presented in Fig. 1. All prices were indexed to 2008 US$ using the Gross Domestic Product (GDP) Inflator. The average low-end price across all sizes and periods of harvest was 11.51 US$ box−1, which is more reflective of the average marketing year price received by producers in Alabama from 2005 to 2008 for fresh market tomatoes across all sizes 4 (7.80 US$ box−1). Week 1 corresponds to the first week of July and week 9 corresponds to the last week of August regardless of year. Prices for all sizes of tomatoes peak during the fourth and fifth weeks and decline throughout August and start to increase again at the end of the nine-week period. The periods of harvest (period 1 through period 6) in this study correspond with weeks 4 to 9 in Fig. 1.
Weekly tomato prices from July to August at Atlanta, Georgia (Terminal Market) averaged over 2005, 2006, 2007 and 2008Reference Brown and Miller 27 .

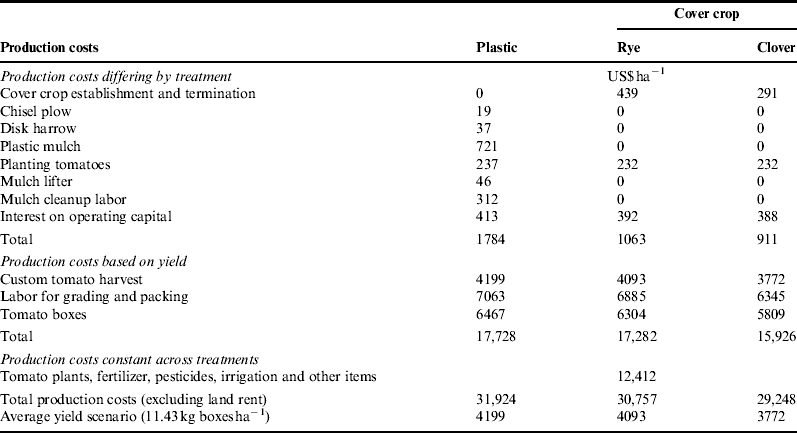
Productions costs for the three types of cover (plastic, cereal rye and crimson clover) were derived from 2009 tomato enterprise budgets 30 and are presented in Table 2. Input prices represent 2008 input prices. Three types of production costs were considered: costs that were constant across all types of cover, costs that differed by type of cover and yield-dependent costs. The planting rate of tomatoes, applications of fertilizer and pesticides, and irrigation rates did not differ among plastic, cereal rye and crimson clover cover. All experimental plots received the same amount of fertilizer, amounts and types of pesticides, and amounts of irrigation water. Although these inputs were held constant across all treatments, there is the potential for the use of cover crops to impact (either positively or negatively) the amount of fertilizer, pesticides and irrigation needed in tomato production; however, these effects were not considered in this study. The tillage system, method of planting, post-harvest activities and interest on operating capital varied by treatment, and were based on the experimental design. Machinery costs were based on variable and fixed costs, and machinery for field operations was sized to represent typical machinery used by small vegetable producers in Alabama. The costs associated with tomato boxes, custom harvesting, and labor for grading and packing varied with the tomato yield of each treatment. Since management costs, land rent and depreciation on buildings can be substantially different among producers, they were not included in the production costs.
Total production costs (US$ ha−1) for staked fresh-market tomatoes (MSU, 2009).

While plastic mulch is expensive and labor intensive, establishing a high-residue cover crop on a small surface is not without expense. As shown in Table 2, the difference in production costs, based on average yields, between plastic mulch and a rye cover crop is 1167 US$ ha−1 and between plastic mulch and a clover cover crop is 2676 US$ ha−1. The cost to establish a rye cover crop is higher than the cost to establish the clover cover crop by 1509 US$ ha−1 due to lower cover crop seed costs for clover and the application of nitrogen fertilizer to the rye cover crop. Moving to a cover crop system also reduces labor needs associated with plastic mulch installation, removal and disposal. There are additional production activities that may be impacted by adopting a conservation system in place of plastic mulch, such as the ability to meet supply requirements and/or the timely planting of subsequent crops; however, these were not considered as part of this analysis. Producers should consider all aspects of their operation prior to adopting different production systems and/or technology.
Data were analyzed using SAS PROC GLIMMIX 31 . The dependent variable was annual net returns and net returns by harvest period, both measured in US$ ha−1. Plastic mulch was the check treatment, and a binary variable (control) was generated to allow for comparisons between plastic mulch and the other main effects. The control, cover, shank, and the interaction between cover and shank were considered fixed effects. Replication and the interaction between replication and cover were considered random effects. Data were analyzed separately by year, following Kornecki and ArriagaReference Kornecki and Arriaga 8 . Multiple comparison tests for differences between the control binary variable and treatments were identified using the Dunnett's test and a significance level of P=0.10.
A stochastic simulation model was used to generate net returns for each treatment based on simulated tomato yields for each treatment for producing tomatoes, as well as tomato price. SIMETARReference Richardson, Schumann and Feldman 18 was employed to estimate the Gray, Richardson, Klose and Schumann (GRKS) distributions for yield using experimental dataReference Bishop, Curtis and Kim 32 – Reference Rodríguez, Popp, Thomsen, Friedrich and Rom 34 and empirical distributions for price. The GRKS distribution is similar to triangular distribution, and is useful when there are minimal input data. Like multivariate empirical (MVE) distributionReference Richardson, Klose and Gray 35 , it is a closed form distribution, eliminating the possibility of values outside of a reasonable range. The minimum, median and maximum were needed to estimate the GRKS distribution. For tomato yield, the minimum, median and maximum yields from the 16 yield observations (four replications/production alternative for 4 years) for each production alternative were used in fitting the GRKS distributions.
Empirical distributions for price were estimated using the average low-end weekly price per box for tomatoes based across all grades (small, medium, large and extra-large) at the terminal market in Atlanta, Georgia 29 . For comparison purposes, net returns were generated based on MVE distributions for price using the average high-end weekly price per box. Net returns were also simulated using the high-end price distribution. One thousand iterations of net returns, yields and price were simulated using GRKS and empirical distributions, respectively. Three thousand iterations were also simulated; however, the means and variances were not statistically different at the 5% probability level from the means and variances simulated with 1000 iterations, based on the t-test and F-test, respectively.
Tomato production alternatives were ranked using SERF under a negative exponential utility function, which compares a set of production alternatives based on the certainty equivalents (CE) over a range of absolute risk aversion coefficients (ARACs) or risk attitudes. The CE for a given treatment is the monetary value that would make a producer indifferent between that treatment and another treatment. The most preferred treatment has the largest CE. These estimates are an approximation and should not be considered precise. Their precision is based on the accuracy of the utility function and probability distributionsReference Harwood, Heifner, Coble, Perry and Somwaru 36 . The ARAC value corresponds to the level of risk aversion of the producer. Following Hardaker et al., the absolute risk aversion was the relative risk aversion divided by wealth, where wealth was the average simulated net return over all production alternativesReference Hardaker, Richardson, Lien and Schumann 19 . The lower ARAC value is assumed to be zero (risk neutral). The upper bound (risk averse) is calculated as four (very risk averse) divided by the average simulated net return over all treatments (15,769 US$ ha−1). In this study, the upper ARAC value equals 0.00025. The difference between the CE values at a given ARAC level is the risk premium, which is the minimum amount a producer would have to receive to decide to convert to a more risky alternative from a less risky alternative.
Results and Discussion
Gross revenues and net returns
In general, there was a lack of statistical significance (P≤0.10) across all years and treatments. The control binary (P<0.001 for gross revenue and net return) and cover (P=0.009 for gross revenue and P=0.0582 for net return) were statistically significant in 2008. The control binary (P=0.0631) was statistically significant in 2006, and cover (P=0.0853) was statistically significant in 2007 for gross revenue. The only interaction that was statistically significant was the interaction between cover crop and shank in 2007 for both gross revenue and net returns (P=0.0322 and P=0.0384, respectively). Given the lack of significance for the interaction term, the primary focus of the following discussion is on the main effects for treatments. The lack of statistical significance is similar to the results presented by Wu et al.Reference Wu, Liu, Mills, Coffman and Teasdale 16 , and is consistent with the results presented by Kornecki and ArriagaReference Kornecki and Arriaga 8 .
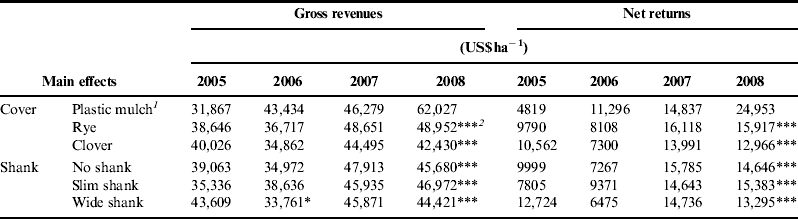
Table 3 presents the gross revenues and net returns between plastic mulch and the main effects in 2005 through 2008. In 2 out of the 4 years, gross revenues and net returns were higher for the rye cover crop than for plastic mulch; however, these differences were not significantly significant. Net returns for plastic mulch (24,953 US$ ha−1) were higher than rye and clover (15,917 US$ ha−1 and 12,966 US$ ha−1, respectively) in 2008. The first year of the experiment (2005) was the only year where net returns were higher for clover (10,562 US$ ha−1) than for plastic mulch (4819 US$ ha−1). The rye treatment produced higher net returns than the clover treatment in 3 out of the 4 years; however, the difference (2951 US$ ha−1) was only significant (P=0.0582) in 2008. Net returns were higher in 2007 and 2008 than in 2005 and 2006 over all cover treatments. Kornecki and ArriagaReference Kornecki and Arriaga 8 attributed lower yields in 2005 to unusually low temperatures after planting on May 4, 2005. Flowering and maturing was delayed in 2006 due to an extended period of rainfall, lower temperatures and a delayed first harvest, as compared to the other years. Although there was a drought in 2007, net returns across all three treatments were higher in 2007, as compared to 2005 and 2006.
Gross revenues and net returns by year, cover and shank treatment as compared to plastic mulch for tomato production.

1 The rye and clover main effects, as well as the shank main effects, are compared to the industry standard (plastic mulch). The gross revenues and net returns for plastic mulch, cover and shank effects are the totals.
2 *,**,*** Significantly different at P≤0.10,0.05 or 0.01, respectively, from plastic mulch.
The gross revenues and net returns for the shank treatments followed a similar pattern across years as gross revenues and net returns for the cover treatments. Net returns for no shank, slim shank and wide shank effects were statistically lower than net returns for plastic mulch (P<0.001) in 2008. In the remaining years, there was no significant difference between plastic mulch and shank treatments for both gross revenue and net returns, with the exception of statistically lower gross revenues for the wide shank in 2006 (P=0.0801). Of the three shank treatments, the slim shank treatment had the highest gross revenues and net returns in 2 of the 4 years.
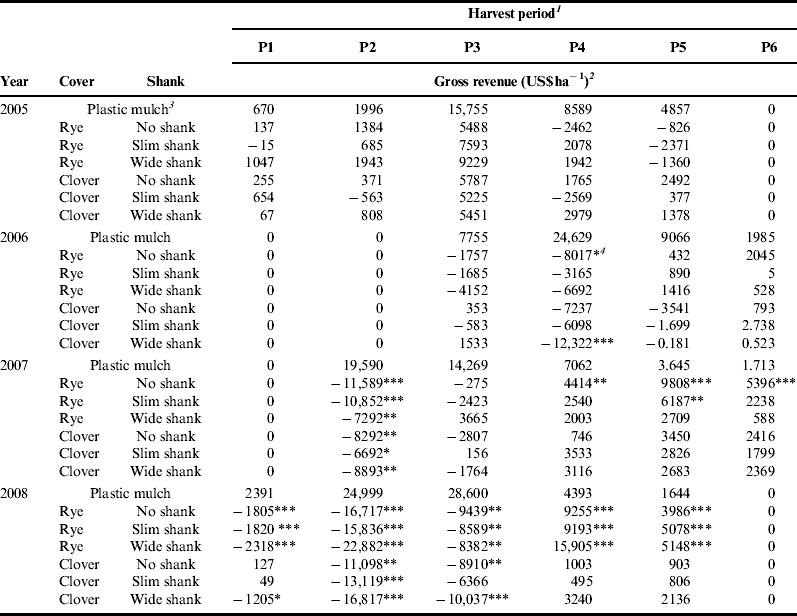
Table 4 presents the difference in gross revenue between plastic mulch and the cover and shank production option by year and harvest period. Comparisons were made between the six production options (rye/no shank, rye/slim shank, rye/wide shank, clover/no shank, clover/slim shank, and clover/wide shank) and the industry standard (plastic mulch). Six harvest periods were considered even though tomatoes were not harvested in all six periods each year due to differing planting dates and rates of maturity. When gross revenues were analyzed by harvest period, an interesting trend emerged. In 2006, 2007 and 2008, plastic mulch had higher gross revenues in the earlier periods, and, in the later periods, the cover/shank production options had higher gross revenues. This is consistent with previous literature supporting the extended harvest periods with conservation systems and cover cropsReference Teasdale and Abdul-Baki 11 , Reference Kelly, Lu, Adbul-Baki and Teasdale 15 , Reference Abdul-Baki, Teasdale, Korcak, Chitwood and Huettel 37 .
Difference in gross revenue between plastic mulch and the cover/shank treatments for tomato production by harvest period.

1 P1, P2, P3, P4, P5, and P6 correspond to the six-week period beginning the fourth week of July and ending the last week of August.
2 A negative value means that the gross revenue for the treatment was less than the control, while a positive number indicates that gross revenues were greater than the control. A zero value means that tomatoes were not harvested in that period.
3 The rye and clover main effects, as well as the shank main effects, are compared to the industry standard (plastic mulch). The gross revenues and net returns for plastic mulch are the totals, and the gross revenues and the net returns for the cover and shank effects are the difference between the effect and plastic mulch.
4 *,**,*** Significantly different at P≤0.10,0.05, or 0.01, respectively, from plastic mulch.
Simulated net returns
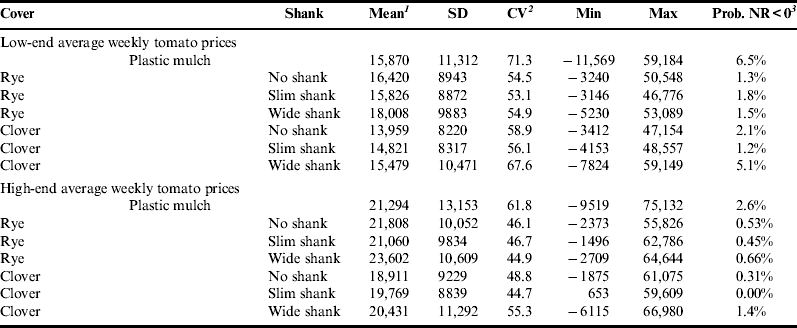
Summary statistics for the simulated net returns for low-end average weekly prices are presented in Table 5. Based on the low-end average weekly prices, rye/wide shank had the largest net returns (18,008 US$ ha−1) followed by rye/no shank, plastic mulch and rye/slim shank (16,420, 15,870 and 15,826 US$ ha−1, respectively). Clover/no shank had the lowest net returns (13,959 US$ ha−1). The return variability, as measured by the CV, was the lowest for rye/slim shank (CV=53.1), followed by rye/no shank (CV=54.5). Plastic mulch (CV=71.3) had the largest return variability, as well as the greatest probability of having negative net returns (6.5%). Clover/wide shank had the second largest return variability (CV=67.6) and one of the largest probabilities of having negative net returns (5.1%). Rye/no shank and clover/slim shank had the smallest probability of having negative net returns (1.3 and 1.2%, respectively).
Summary statistics of simulated net returns (US$ ha−1) for low-end and high-end average weekly tomato prices.

1 Summary statistics calculated from 1000 simulated iterations.
2 CV is the coefficient of variation and is the SD divided by the mean multiplied by 100. It is a unitless measure of relative risk.
3 Probability of receiving a negative net return.
CE and risk premiums to cover crops
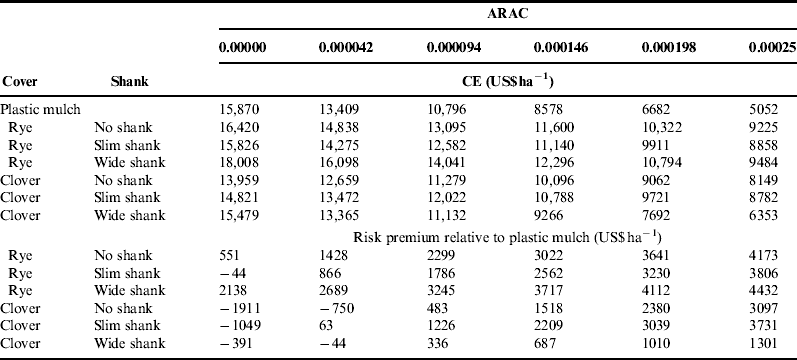
CE and risk premiums based on low-end average weekly tomato prices were presented by treatment for various ARACs in Table 6. When ARAC equaled zero, CE equaled mean net returns. CE declined as ARAC levels increased (as producers became more risk averse). Rye/wide shank was the most preferred treatment for producers with ARAC levels less than 0.00025. As risk aversion increased, plastic mulch became the least preferred treatment, followed by clover/wide shank and clover/no shank. At all levels of risk, at least one treatment that included a cover crop was preferred over the more common plastic. Rye/wide shank and rye/no shank were preferred to plastic mulch at all ARAC levels.
Net returns CE and plastic mulch risk premiums by treatment for various ARAC.

The risk premiums for rye/wide shank and rye/no shank were positive across all ARAC levels, as shown in Table 6, implying monetary benefits to tomatoes planted into a rye cover crop using a wide shank were greater than monetary benefits of plastic mulch. For example, a risk neutral (ARAC=0) producer would have to be paid 551 US$ ha−1 to switch from rye/no shank to plastic mulch, while a risk averse producer (ARAC=0.00025) would have to be paid 4173 US$ ha−1 to switch from rye/no shank to plastic mulch. For risk neutral producers, risk premiums for rye/slim shank, clover/no shank, clover/slim shank and clover/wide shank were negative, implying monetary benefits to plastic mulch were greater than the monetary benefit to tomatoes planted into these treatments. The risk premiums for all treatments relative to plastic mulch increased as risk aversion increased. For all treatments, the monetary benefits of adopting a cover crop were positive at the highest level of risk aversion as compared to plastic mulch.
SERF method
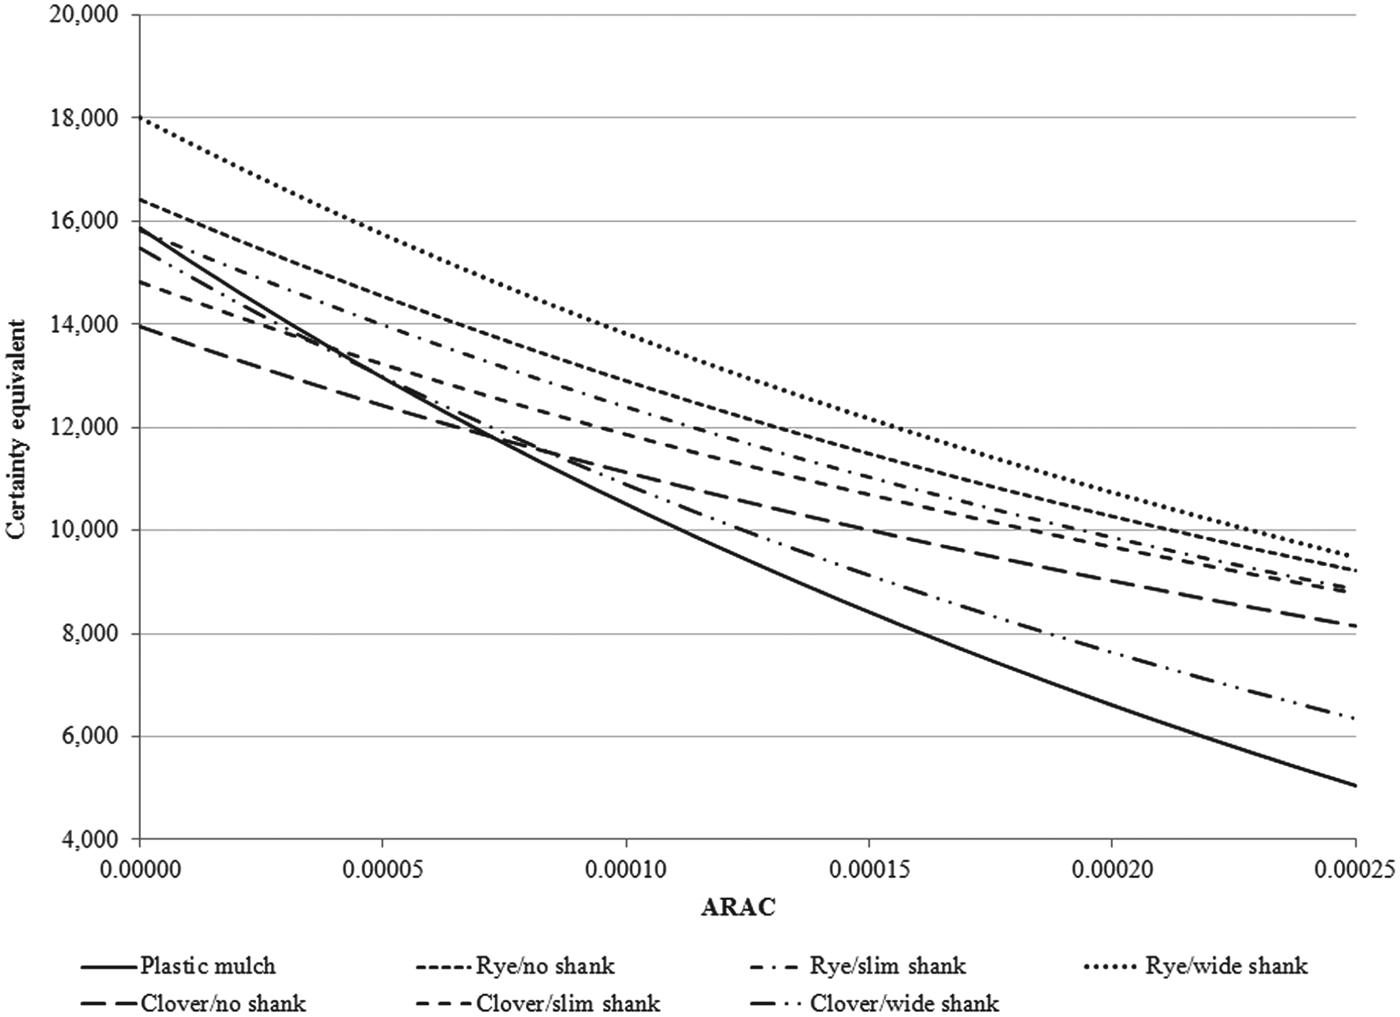
Figure 2 presents the SERF results across ARACs ranging from 0 to 0.00025 (or risk neutral to strongly risk averse) relative to plastic mulch based on low-end average weekly tomato prices. According to Hardaker et al., the risk preferred treatment was the treatment with the highest risk premium value at any given point on the graphReference Richardson, Schumann and Feldman 18 . The SERF efficient set contained rye/wide shank for producers across all ARAC levels. Rye/no shank was also preferred to plastic mulch across all ARAC levels, and rye/slim shank at ARAC levels greater than 0. For ARAC levels >0.000073, all six cover crop treatments were preferred to plastic mulch. The CE gap between the cover crop/shank treatments and plastic mulch widened with increasing levels of risk; however, the CE gap between cover crop treatments narrowed with increasing levels of risk. Therefore, risk related to net returns may have a substantial impact on a tomato producer's preference for adopting systems using a rye or clover cover crops in place of plastic mulch.
Risk premiums for the most risk-preferred tomato production treatment relative to plastic mulch.

Sensitivity analysis with respect to tomato price
Sensitivity analysis was conducted for tomato prices to investigate the results under high-end average weekly prices. The simulation net returns, as shown in Table 5, were similar to the simulation results for the low-end average weekly prices; however, the average clover/no shank (19,769 US$ ha−1) was higher than for clover/slim shank (18,911 US$ ha−1). Plastic mulch and clover/wide shank had the highest CV and the largest probabilities of having negative net returns. The treatments with the lowest CV were different under the high-end average weekly prices (rye/wide shank and clover/slim shank) as compared to the low-end average weekly prices (rye/no shank and rye/wide shank).
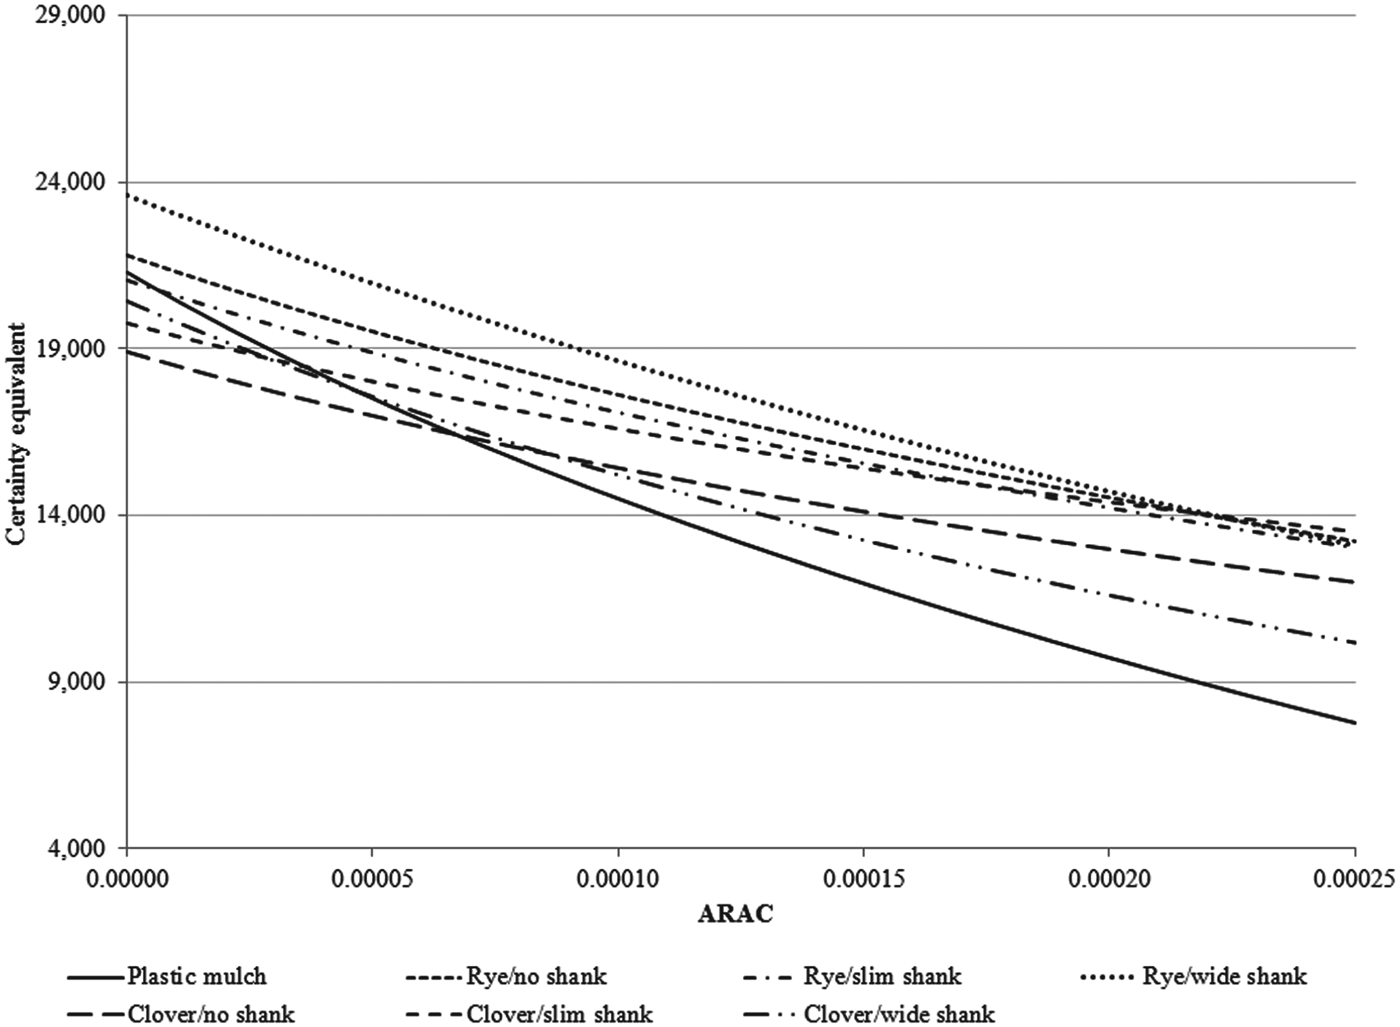
Based on Fig. 3, which presents the SERF results across ARACs ranging from 0 to 0.00025 (or risk neutral to strongly risk averse) relative to plastic mulch based on high-end average weekly tomato prices, it was clear that the results are similar with one exception. At high ARAC levels (risk-averse producers), there was little difference between the three rye cover crop treatments and the clover/slim shank treatment. Under low-end average weekly tomato prices, rye/wide shank was the preferred treatment for very risk-averse producers; however, under high-end average weekly tomato prices, clover/slim shank was the preferred alternative. Under high-end average weekly tomato prices, the overall conclusion that risk related to net returns may have a substantial impact on a tomato producer's preference for adopting systems using a rye or clover cover crop in place of plastic mulch does not change.
Risk premiums for the most risk-preferred tomato production treatment relative to plastic mulch based on high-end average weekly tomato prices.

Conclusion
This analysis evaluated the net returns for tomato production in Alabama using two different cover crops and three different shank options in comparison to the more common plastic mulch production system. The risk efficiency of a cover crop system in tomato production was also examined using simulation and the SERF method. Based on the experimental data, gross revenues and net returns from tomato production using a rye cover crop were higher than tomato production using plastic mulch in 2 of the 4 years. For the clover cover crop, gross revenues and net returns were higher in 1 out of the 4 years. The use of a cover crop decreased production costs compared to plastic mulch, and the profitability of this system could be increased with a reduction in the cost of establishment and termination of the cover crop.
Tomato producers are faced with different production and financial situations. Their risk preferences play an important role in determining their production decisions. Under the low-end average weekly tomato prices and weather conditions during 2005–2008, the preferred treatment for a risk neutral producer was planting tomatoes into a rye cover crop with a wide shank. For a strongly risk averse producer, all six cover crop treatments were preferred to plastic mulch. Similar conclusions were reached under high-end average weekly tomato prices. Cover crops provide less variability in yield as compared to plastic, as well as higher yields in later harvest periods. The use of a cover crop in tomato production has the potential to be an equally profitable, less risky alternative to plastic mulch in Alabama.