INTRODUCTION
Flooding is a major stress and constraint to rice production and about 20 million ha in rain-fed lowlands in south and south-east Asia are adversely affected by floods each year. Damage to plants caused by submergence could have several causes linked to floodwater conditions, particularly interference with normal gas exchange and light interception (Das et al., Reference Das, Panda, Sarkar, Reddy and Ismail2009). The adverse effects of flooding on rice vary by genotype, and of particular importance are the carbohydrate status of the plant before and after submergence, the developmental stage at which flooding occurs, the duration and depth and the level of turbidity and turbulence of floodwater (Das et al., Reference Das, Sarkar and Ismail2005). Submergence tolerance in rice is an important trait and is physiologically complex but seems to be genetically simple (Xu and Mackill, 1996; Xu et al., Reference Xu, Xu, Fukao, Canalas, Maghirang-Rodriguez, Heuer, Ismail, Bailey-Serres, Ronald and Mackill2006). The Indian cultivar FR13A is the most widely studied and used source of submergence tolerance in rice breeding, and a major quantitative trait locus (QTL)-designated Sub1 was identified that controls most of the submergence tolerance of this genotype (Xu and Mackill, Reference Xu and Mackill1996). Sub1 was subsequently fine-mapped and cloned, and three genes encoding putative ethylene responsive factors (ERF), Sub1A, Sub1B and Sub1C, were identified, with Sub1A recognised as the primary determinant of submergence tolerance (Xu et al., Reference Xu, Xu, Fukao, Canalas, Maghirang-Rodriguez, Heuer, Ismail, Bailey-Serres, Ronald and Mackill2006). Moreover, precise gene-based markers were designed for Sub1 and used for its successful introgression into popular high-yielding rice varieties (Neeraja et al., Reference Neeraja, Maghirang-Rodriguez, Pamplona, Heuer, Collard, Septiningsih, Vergara, Sanchez, Xu, Ismail and Mackill2007; Septiningsih et al., Reference Septiningsih, Pamplona, Sanchez, Neeraja, Vergara, Heuer, Ismail and Mackill2009). Subsequent testing of introgression lines in the field showed no apparent effects on agronomic performance, grain yield or quality in the absence of submergence (Neeraja et al., Reference Neeraja, Maghirang-Rodriguez, Pamplona, Heuer, Collard, Septiningsih, Vergara, Sanchez, Xu, Ismail and Mackill2007; Sarkar et al., Reference Sarkar, Panda, Reddy, Patnaik, Mackill and Ismail2009). Recently the Sub 1 QTL has been introgressed into the highly popular submergence–susceptible cultivar Swarna. Swarna Sub1, which has been the most popular Sub1 variety to date (Reddy et al., Reference Reddy, Sarkar, Patnaik, Singh, Singh, Ismail and Mackill2010), has shown excellent survival under natural submergence in farmers' fields. However, the physiological bases of Sub1 in withstanding tolerance under complete submergence are yet to be worked out.
The present study is an effort to characterise the submergence sensitivity in rice plants either possessing or not possessing Sub1 on the basis of the changes in non-structural carbohydrate (NSC) content before and after submergence, effective utilisation of carbohydrate by metabolising enzymes such as amylases, starch phosphorylase and alcohol dehydrogenase.
MATERIAL AND METHODS
Plant material and growth conditions
The experiment was conducted with two indica rice (Oryza sativa L.) cultivars: Swarna and Swarna Sub1. Swarna Sub1, the most popular Sub1 variety to date is being disseminated widely in eastern India, Bangladesh and Nepal, and has been well accepted by the farmers (Reddy et al., Reference Reddy, Sarkar, Patnaik, Singh, Singh, Ismail and Mackill2010). Seeds were sown directly in earthen pots containing two kg of farm soil and farmyard manure (3:1). Each pot was supplied with 80-mg urea, 192-mg single super phosphate (P2O5) and 70-mg muriate of potash (K2O). Fourteen-day-old seedlings were submerged in water in a concrete tank to a height of 110 cm for 7 d.
The characteristics of the floodwater in terms of light transmission were measured at 1200 h (LI-COR, Lincoln, USA) every alternate days, and water temperature and oxygen concentration were determined at 0600 and 1700 h (Syland, Heppenheim, Germany). Light intensity at 60-cm water depth from the top or at the vicinity of canopy level varied from 215 to 319 μmol m−2 s−1, as incident radiation above the water surface varied from 1743 to 1812 μmol m−2 s−1. The oxygen concentration at the same water depth was 2.5 to 3.1 mg L−1 at 0600 h and 4.6 to 5.8 mg L−1 at 1700 h. The temperature did not vary much (≅4oC), being 26.6 to 30.7 °C throughout the period of the experiment.
Measurement of non-structural carbohydrate and plant height
Non-structural carbohydrate (sugar and starch) content of the shoot was estimated after seven days of complete submergence and respective non-submerged control plants following the procedure of Yoshida et al. (Reference Yoshida, Forno, Cock and Gomez1976) with three replications. For each measurement, shoot (leaf and leaf sheath) samples of five plants were oven-dried and grounded to a fine powder, and extracted using 80% ethanol (v/v). The extract was then used for soluble sugar analysis after addition of anthrone reagent, followed by a measurement of absorbance at 630 nm using a spectrophotometer (model SL 164 double beam, ELICO, Hyderabad, India). The residue remaining after extraction of soluble sugars was dried and extracted using perchloric acid and then analysed for starch (as glucose equivalent) using the anthrone reagent as for soluble sugars. Plant height and extent of elongation of the plant shoot were determined by subtracting plant height of respecting control plant from that after submergence and expressing it as percentage of change due to submergence.
Measurement of carbohydrate catabolic enzymes
Alcohol dehydrogenase activity was measured by taking 500 mg of fresh tissue homogenised in 3 ml of an extraction medium of 100-mM Tris-HCl buffer (pH 7.5) containing 3-mM Dithotheriotol (DTT), 2.0-mM MgCl2, 50-mM KCl and 1-mM EDTA. The homogenate was centrifuged at 12,000 rpm for 20 min at 0–4 °C. The supernatant was used for enzyme assay. The activity was measured following Ram et al. (Reference Ram, Lal and Chaturvedi2000). The assay medium contained 50-mM Tris-HCl (pH 7.5), 62.5-mM MgCl2, 3-mM NADH, 100-mM acetaldehyde and enzyme extract. The change in absorbency was taken at 340 nm using a spectrophotometer (model SL 164 double beam, ELICO, Hyderabad, India) and the activity was expressed as the change in absorbance min−1 mg−1 protein.
Starch phosphorylase activity was measured following Thimmaiah (1999). Plant samples of 500 mg were homogenised in10 ml of citrate buffer (0.5 M, pH 6.0). The homogenate was clarified by centrifuge at 0–4 °C at 10,000 rpm. The supernatant was used for enzyme assay. The reaction mixture contained 1-ml extracting buffer, 0.2-ml soluble starch solution (5%) and 0.8-ml enzyme extract. The reaction mixture was incubated for 5 min at 35 °C. After incubation, 1 ml of G1-P solution (0.1 M) was added and kept for 1 h. The reaction was stopped by adding 5 ml of 10% trichloroacetic acid. The reaction mixture was clarified and centrifuged at 4 °C at 10,000 rpm. The absorbance was measured at 630 nm using a spectrophotometer (model SL 164 double beam, ELICO, Hyderabad, India). The activity was expressed as mg inorganic phosphorous released h−1 mg−1 protein.
Amylase activity was measured by taking 500 mg of plant tissue, which was extracted in 10 ml of ice-cold 10-mM CaCl2 solution. The homogenate was centrifuged at 12,000 rpm for 20 min at 0–4 °C. The supernatant was used for total and α-amylase enzyme assay. For total amylase assay, 1 ml of 1% (w/v) starch solution in 0.1-M citrate buffer (pH 5.0) and 1-ml enzyme extract was incubated at 30 °C for 30 min in a water-bath. The reaction was terminated by adding 2 ml of 1% dinitrosalicylicacid (DNSA) reagent. For α-amylase, the supernatant was heated with 3-mM CaCl2 at 75 °C for 15 min to inactivate β-amylase and α-glucosidase (Guglielminetti et al., Reference Guglielminetti, Perata and Alpi1995). Both the amylases were then assayed by measuring the rate of generation of reducing sugars from soluble starch and the enzyme activity was expressed as mg maltose liberated min−1 mg−1 protein.
Statistical analysis
Different parameters were compared by ANOVA using IRRISTAT (International Rice Research Institute, Philippines) software's least significant difference (LSD p < 0.05).
RESULTS
Survival under submergence
The two cultivars responded differently to submergence in terms of survival. Ninety percent of Swarna Sub1 plants survived after 7 d of submergence in comparison with less than 15% in Swarna (data not shown).
Non-structural carbohydrate and elongation growth
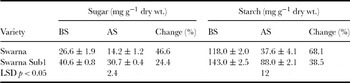
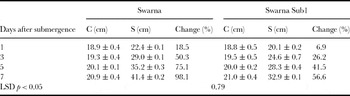
The level of NSC (sugar and starch) before submergence was significantly higher in Swarna Sub1 compared with Swarna (Table 1). The reduction of starch content was greater than soluble sugar content, yet the cultivar Swarna with Sub1 QTL maintained more than twice as much NSC than Swarna during submergence. After 7-d submergence, the reduction in sugar content was 46.6% in Swarna but only 24.4% in Swarna Sub1 compared with non-submerged control plants. The reduction of starch content was 68.1% and 38.5%, respectively. Plant height increased due to submergence in both Swarna and Swarna Sub1 (Table 2) but the elongation was greater in Swarna compared with Swarna Sub1. The rate of elongation was the greatest between the 1st and 3rd day of submergence but thereafter continued at a slower rate in both the cultivars. After 7 d of submergence, the increase in plant height was more than 98% in Swarna whereas Swarna Sub1 only increased by 57%.
Shoot non-structural carbohydrate (sugar and starch) content in Swarna and Swarna Sub1 rice cultivars before and after 7 d complete submergence and percentage changes due to submergence. Data are the means of three replications ± standard deviation.

BS: before submergence, AS: after submergence, change (%) = [(AS – BS)/BS] × 100.
Plant height of control and submerged plants and percentage changes due to submergence in Swarna and Swarna Sub1 cultivars. Data are the means of three replications ± standard deviation.

C: control, S: submergence, change (%) = [(S – C)/C] × 100.
Changes of carbohydrate catabolic enzymes
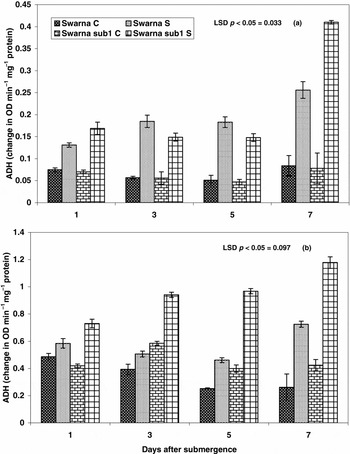
Submergence was associated with a marked increase in alcohol dehydrogenase activity in both leaf sheath and leaf tissues (Figure 1). However, the activity of alcohol dehydrogenase was comparatively low in leaf tissue compared with leaf sheathes. Swarna Sub1 showed higher alcohol dehydrogenase activity compared with Swarna at 1 and 7 d of submergence in leaf tissue. Submergence significantly enhanced the alcohol dehydrogenase activity in the leaf sheath compared with the control. Swarna Sub1 showed significant grater magnitude of activity compared with Swarna.
Changes of alcohol dehydrogenase activity in (a) leaf, and (b) leaf sheath of Swarna and Swarna Sub1 cv. during different days of submergence along with respective air-grown control plants. Vertical bar represents standard deviation. LSD p < 0.05.

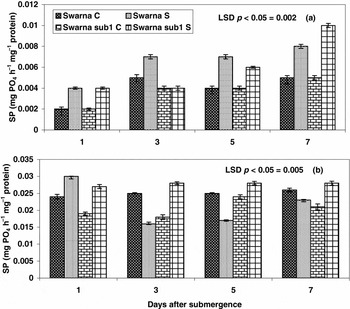
Changes in starch phosphorylase activity in leaf sheath and leaf tissues are shown in Figure 2. Activity was greater in leaf sheath compared with leaf tissue under both control and submerged conditions. In leaf tissue, Swarna showed greater activity than Swarna Sub1 after 3 and 5 d of submergence compared with the control, whereas Swarna Sub1 showed significantly more activity of it after 7 d of submergence. In leaf sheath Swarna Sub1 maintained significantly greater starch phosphorylase activities after 3, 5 and 7 d of submergence compared to Swarna.
Changes of starch phosphorylase activity in (a) leaf, and (b) leaf sheath of Swarna and Swarna Sub1 during different days of submergence along with respective air-grown control plants. Vertical bar represents standard deviation. LSD p < 0.05.

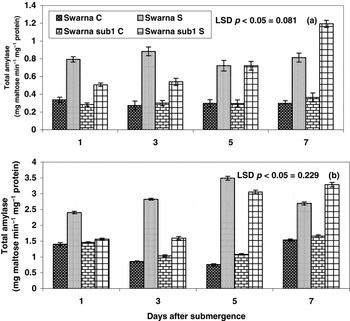
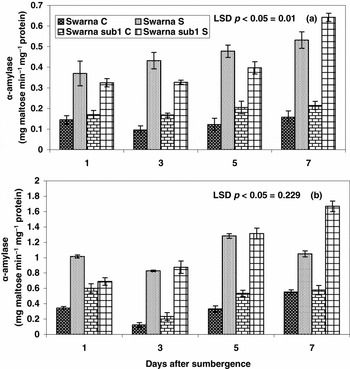
Total amylase and α-amylase activities both in leaf and leaf sheath tissue are presented in Figures 3 and 4. Submergence was associated with an increase in total amylase and α-amylase activities in both leaf sheath and leaf tissues compared with control plants. Total amylase and α-amylase activities were higher in the leaf sheath compared with leaf tissue. Swarna showed significantly higher activity of total amylase after 3 and 5 d of submergence compared with Swarna Sub1 but after 7 d of submergence Swarna Sub1 had significantly more activity than Swarna (Figure 3). There were no significant varietal differences in α-amylase activity under submergence in leaf tissue but in leaf sheath the α-amylase activity was greater in Swarna Sub1 than in Swarna (Figure 4).
Changes of total amylase activity in (a) leaf, and (b) leaf sheath of Swarna and Swarna Sub1 cv. during different days of submergence along with respective air-grown control plants. Vertical bar represents standard deviation. LSD p < 0.05.

Changes of α-amylase activity in (a) leaf, and (b) leaf sheath of Swarna and Swarna Sub1 during different days of submergence along with respective air-grown control plants. Vertical bar represents standard deviation. LSD p < 0.05.

DISCUSSION
Submergence imposes a complex abiotic stress (Bailey-Serres and Voesenek, Reference Bailey-Serres and Voesenek2008; Sarkar et al., Reference Sarkar, Reddy, Sharma and Ismail2006) and the extent of injury caused by complete submergence is largely dependent on floodwater conditions, particularly its temperature, turbidity and the extent of light penetration (Das et al., Reference Das, Panda, Sarkar, Reddy and Ismail2009). The 104-fold reduction in diffusion of gases in water relative to air limits the exchange of carbon dioxide and oxygen necessary for photosynthesis and respiration and increases the cellular concentration of gaseous hormone, ethylene. The reduction in light energy that reaches underwater leaves, especially in turbid waters, hastens chlorosis and leaf senescence (Panda et al., Reference Panda, Sharma and Sarkar2008). The major symptoms of submergence, such as reduced plant survival (Sarkar et al., Reference Sarkar, Reddy, Sharma and Ismail2006), were observed in Swarna compared with Swarna Sub1.
Swarna Sub1 had greater NSC content compared with Swarna (Table 1) and more limited elongation (Table 2) than Swarna, suggesting that, during submergence, carbohydrate was used more in Swarna compared with Swarna Sub1. Introgression of the Sub1 QTL resulted in greater accumulation of NSC before submergence and maintained more of it after submergence. Generally, our results demonstrated that elongation competes for essential energy supply, and that reducing elongation can conserve carbohydrates and increase submergence tolerance. Fukao et al. (Reference Fukao, Xu, Ronald and Bailey-Serres2006) demonstrated that genotypes lacking submergence-induced Sub1A-1 rapidly consume leaf starch and soluble sugars to maintain elongation growth during submergence. By contrast, genotypes with the Sub1 haplotype introgressed from FR13A consume carbohydrate energy reserves more slowly during submergence, maintaining growth at a rate similar to plants in air. When 14-day-old plants were submerged for 16 days, the viability of the Sub 1 line (M202 (Sub 1)) was 98%, whereas that of the non-tolerant japonica (M202) was only 10%. The low viability of M202 coincided with three times more shoot elongation. Findings with these near-isogenic lines were generally consistent with early studies that compared FR13A to unrelated submergence intolerant varieties. Sub 1A-1 promoter activity in internodes and in the collar region and leaf base is consistent with a role in suppressing division and elongation of cells (Singh et al., Reference Singh, Dang, Vergara, Pandey, Sanchez, Neeraja, Septiningsih, Mendioro, Tecson-Mendoza, Ismal, Mackill and Heuer2010). Overall, the submergence tolerance conferred by the Sub 1 variety is correlated with better maintenance of total soluble carbohydrates and limited elongation growth.
The activity of alcohol dehydrogenase increased greatly during submergence in both cultivars. However, it increased more in Swarna Sub1 than in Swarna (Figure 1). The response of plant tissues to oxygen depletion involves an increase in alcoholic fermentation (Ellis and Setter, Reference Ellis and Setter1999). This suggests a key role for fermentation in plant tissues in response to anoxia. Ethanolic fermentation has been identified as the main pathway for glucose metabolism in anaerobic rice seedlings (Menegus et al., Reference Menegus, Cattaruzza, Mattana, Beffagna and Ragg1991). Ellis and Setter (Reference Ellis and Setter1999) described induction of ethanol release from hypoxically treated rice seedlings, but did not find a clear correlation between the rate of ethanol synthesis and anoxia tolerance while comparing four contrasting rice cultivars. The present investigation suggests that Sub 1 QTL played a vital role in the activities of alcohol dehydrogenase so that plants could get sufficient energy and metabolites (NAD+) for sustenance during complete submergence.
Starch phosphorylase activities under submergence were higher in Swarna Sub1 compared with Swarna (Figure 2). Das et al. (Reference Das, Nanda, Sarkar and Lodh2000) reported an initial decrease in the activity of starch phosphorylase after 2 d of submergence whereas the activity of it increased after 4 d of submergence, and declined sharply both in tolerant and susceptible cultivars. Very little work has been done on the role of starch phosphorylase in starch breakdown and its relation with submergence tolerance. A negative correlation between the activities of starch phosphorylase and starch disappearance during grain filling suggests that the enzyme may be involved in starch synthesis instead of remobilisation (Beck and Ziegler, Reference Beck and Ziegler1989). Plaxton (Reference Plaxton1996), however, suggested the role of starch phosphorylase in remobilisation of starch. Great variations in the activity of starch phosphorylase activity because of the submergence stress suggests that the enzyme might be involved in the degradation of starch, which was mobilised from tissues to tissues for supply of energy (Sauter, Reference Sauter2000; Sarkar et al., Reference Sarkar, Reddy, Sharma and Ismail2006). The glycolytic pathways in which α-amylase acts together with the debranching enzyme result in the formation of oligosaccharides, which undergo starch phosphorylase-catalysed phosphorolysis using inorganic phosphate to yield D-gluocose-1-phosphate and conserve the energy (Sauter, Reference Sauter2000). Enzymes such as α-amylase were stimulated in submerged rice seedlings in response to submergence (Figure 4). Hence, the activity of it is not a limiting factor to break down the reserve starch. Swarna Sub1 was more efficient in conserving starch due to higher activities of starch phosphorylase compared with Swarna.
CONCLUSION
Submergence sensitive cv. Swarna accelerated the rate of stem and leaf elongation more during submergence relative to non-submerged plants, which resembles the effective inter-nodal elongation of partially submerged deep-water rice. The variety lacking the Sub1 QTL rapidly consumed NSC to maintain elongation growth under submergence in contrast to the genotype with the Sub1 QTL that consumed energy reserves more slowly during submergence and maintained growth at similar rates to those of the non-submerged controls. Overall, submergence tolerance conferred by the Swarna Sub1 QTL is correlated with better maintenance and utilisation of NSC than Swarna.
Acknowledgement
Authors are grateful to the Director, Central Rice Research Institute, Cuttack for providing necessary facilities for this study.