


1 Introduction
Flexible or flexibly mounted bodies with bluff cross-section and exposed to a cross-current are common in nature (e.g. plants and trees in wind) and engineering applications (e.g. mooring lines immersed in ocean currents). Such physical systems are often subjected to flow-induced vibrations (FIV). These vibrations may have a dramatic impact on the structures as they result, among other effects, in amplified drag forces and increased fatigue damage. They can also be exploited as a mechanical energy converter in the context of flow energy harvesting. The physical analysis and prediction of FIV have motivated a number of studies, as collected in Blevins (Reference Blevins1990), Naudascher & Rockwell (Reference Naudascher and Rockwell1994) and Païidoussis, Price & de Langre (Reference Païdoussis, Price and de Langre2010).
The present study focuses on the FIV of a flexibly mounted, rigid circular cylinder, free to oscillate in an arbitrary direction and forced to rotate about its axis; it follows two prior works concerning comparable configurations where the cylinder was allowed to move in the direction either normal to the current (Bourguet & Lo Jacono Reference Bourguet and Lo Jacono2014) or aligned with the current (Bourguet & Lo Jacono Reference Bourguet and Lo Jacono2015) and it aims at bridging the gap between the contrasted results reported in these previous papers, as explained in the following. These physical configurations may be regarded as paradigms of symmetry breaking in fluid–structure interaction. They may also provide insights for practical applications, which involve vibration enhancement for energy harvesting or reduction to minimize the fatigue of offshore structures such as drilling risers; intermediate configurations, where the direction of motion is neither parallel nor perpendicular to the current, often occur in real systems.
Two forms of FIV are frequently encountered for bluff bodies: vortex-induced vibrations (VIV) and motion-induced vibrations (MIV). VIV result from a mechanism of synchronization,referred to as lock-in,between body response and flow unsteadiness associated with vortex formation in the wake. This fluid–structure interaction phenomenon has been well documented in the literature. A rigid, non-rotating, circular cylinder forced or free to oscillate within a cross-current has often served as a canonical problem (Bishop & Hassan Reference Bishop and Hassan1964; Bearman Reference Bearman1984, Reference Bearman2011; Ongoren & Rockwell Reference Ongoren and Rockwell1988; Mittal & Tezduyar Reference Mittal and Tezduyar1992; Carberry, Sheridan & Rockwell Reference Carberry, Sheridan and Rockwell2001; Cetiner & Rockwell Reference Cetiner and Rockwell2001; Sarpkaya Reference Sarpkaya2004; Williamson & Govardhan Reference Williamson and Govardhan2004; Leontini et al.
Reference Leontini, Stewart, Thompson and Hourigan2006; Dahl et al.
Reference Dahl, Hover, Triantafyllou and Oakley2010; Cagney & Balabani Reference Cagney and Balabani2014; Konstantinidis Reference Konstantinidis2014; Gsell, Bourguet & Braza Reference Gsell, Bourguet and Braza2016; Navrose & Mittal Reference Mittal2016) but VIV occur in a myriad of configurations, including for non-axisymmetric bodies (Obasaju, Ermshaus & Naudascher Reference Obasaju, Ermshaus and Naudascher1990; Okajima et al.
Reference Okajima, Ohtsuyama, Nagamori, Nakano and Kiwata1999; Nemes et al.
Reference Nemes, Zhao, Lo Jacono and Sheridan2012; Zhao, Cheng & Zhou Reference Zhao, Cheng and Zhou2013) and rotating circular cylinders, as discussed hereafter. For a flexibly mounted rigid body, VIV usually appear over a well-defined range of the reduced velocity (
 $U^{\star }$
), i.e. inverse of the oscillator natural frequency non-dimensionalised by the inflow velocity and the body diameter. The typical amplitudes of VIV are of the order of one body diameter in the direction normal to the current (cross-flow direction) and one or more orders of magnitude lower in the direction parallel to the current (in-line direction). In contrast, MIV do not require wake-body synchronization. They develop when the motion of the bluff body tends to enhance the energy transfer from the flow to the structure, leading to self-excited oscillations generally referred to as galloping responses (Païidoussis et al.
Reference Païdoussis, Price and de Langre2010). The amplitude of MIV tends to increase unboundedly with
 $U^{\star }$
and their frequency is generally lower than VIV frequencies (Den Hartog Reference Den Hartog1932; Parkinson & Smith Reference Parkinson and Smith1964; Mukhopadhyay & Dugundji Reference Mukhopadhyay and Dugundji1976; Nakamura & Tomonari Reference Nakamura and Tomonari1977). They can often be predicted through quasi-steady approaches due to the absence of synchronization with flow unsteadiness. The term quasi-steady refers to a decoupling between the typical time scales of flow unsteadiness and body motion: each step of body oscillation is seen as a steady configuration (i.e. body moving at a constant velocity) by the flow. In some cases, VIV and MIV regions may overlap, leading to mixed vibration regimes (Bearman et al.
Reference Bearman, Gartshore, Maull and Parkinson1987; Nemes et al.
Reference Nemes, Zhao, Lo Jacono and Sheridan2012; Mannini, Marra & Bartoli Reference Mannini, Marra and Bartoli2014); in such regimes, the regular increase of the vibration amplitude as a function of the reduced velocity may be distorted by local occurrences of wake-body synchronization (e.g. Zhao et al.
Reference Zhao, Leontini, Lo Jacono and Sheridan2014a
).
Due to the symmetry of the physical system, a rigid, non-rotating, circular cylinder placed in a uniform cross-current is subjected to VIV but not to MIV. The present work addresses the alteration of the system behaviour when a forced rotation is applied to the cylinder. The effects of cylinder rotation have been extensively analysed in the rigidly mounted body case (Coutanceau & Ménard Reference Coutanceau and Ménard1985; Chew, Cheng & Luo Reference Chew, Cheng and Luo1995; Kang, Choi & Lee Reference Kang, Choi and Lee1999; Stojković, Breuer & Durst Reference Stojković, Breuer and Durst2002; Mittal & Kumar Reference Mittal and Kumar2003; El Akoury et al.
Reference El Akoury, Braza, Perrin, Harran and Hoarau2008; Pralits, Brandt & Giannetti Reference Pralits, Brandt and Giannetti2010; Rao et al.
Reference Rao, Radi, Leontini, Thompson, Sheridan and Hourigan2015). The rotation leads to a cancellation of the alternating von Kármán vortex shedding and associated force fluctuations above a rotation rate (
 $\unicode[STIX]{x1D6FC}$
) close to 2, over a wide range of Reynolds numbers (
 $Re$
), based on the cylinder diameter and current velocity; the rotation rate is defined as the ratio between the cylinder surface velocity and the oncoming flow velocity. The rotation also impacts the flow three-dimensional transition, which may occur at a much lower Reynolds number than in the absence of rotation (Pralits, Giannetti & Brandt Reference Pralits, Giannetti and Brandt2013; Rao et al.
Reference Rao, Leontini, Thompson and Hourigan2013).
A few recent works have examined the problem where the rotating cylinder is elastically mounted and free to move in one direction. Most of the previous studies considered a degree of freedom in the cross-flow direction (Bourguet & Lo Jacono Reference Bourguet and Lo Jacono2014; Zhao, Cheng & Lu Reference Zhao, Cheng and Lu2014b
; Seyed-Aghazadeh & Modarres-Sadeghi Reference Seyed-Aghazadeh and Modarres-Sadeghi2015; Wong et al.
Reference Wong, Zhao, Lo Jacono, Thompson and Sheridan2017). The maximum amplitude of oscillation, which can considerably increase with the rotation, and the size of the vibration region in the rotation rate-reduced velocity domain vary from one study to the other, due to differences in the physical parameters of the experiments and numerical simulations (e.g. Reynolds number, structural damping, structure to displaced fluid mass ratio). However, in all cases, including in the higher range of
 $\unicode[STIX]{x1D6FC}$
, the response of the oscillator remains essentially comparable to the VIV developing for
 $\unicode[STIX]{x1D6FC}=0$
: the lock-in condition is established, the vibration amplitude exhibits a bell-shaped evolution as a function of
 $U^{\star }$
. For structural properties and a value of the Reynolds number (
 $Re=100$
) similar to those selected in the present work, prior simulation results (Bourguet & Lo Jacono Reference Bourguet and Lo Jacono2014) showed that the cylinder vibrates up to a rotation rate close to 4, i.e. far beyond the critical value at which the rotation suppresses vortex shedding in the rigidly mounted body case, with a maximum amplitude of 1.9 diameters, which corresponds to three times the maximum amplitude in the non-rotating case. The flow was also found to remain two-dimensional under transverse oscillation, in a range of
 $\unicode[STIX]{x1D6FC}$
where the rotation causes three-dimensional transition when the body does not oscillate. The case where the elastically mounted, rotating cylinder is free to move in the in-line direction was addressed in a previous study (Bourguet & Lo Jacono Reference Bourguet and Lo Jacono2015), with the same physical parameters as those selected in the above-mentioned paper and in the present work. Contrary to what was observed with the cross-flow degree of freedom, two distinct regions emerge in the rotation rate-reduced velocity domain: a region of VIV-like responses for
 $\unicode[STIX]{x1D6FC}<2$
and a region where the vibrations resemble galloping responses, with amplitudes continuously increasing with
 $U^{\star }$
, for
 $\unicode[STIX]{x1D6FC}>2.7$
. Such galloping-like responses were also reported at high rotation rates when the cylinder is free to move in both the in-line and cross-flow directions (Stansby & Rainey Reference Stansby and Rainey2001; Yogeswaran & Mittal Reference Yogeswaran, Mittal, Mittal and Biswas2011). For the in-line degree-of-freedom oscillator, the above-mentioned study showed that body oscillation and flow unsteadiness remain synchronised in the region of galloping-like responses and that the vibrations cannot be predicted by a quasi-steady approach. The flow was found to become three-dimensional at a lower rotation rate than for a non-vibrating cylinder, i.e. the opposite trend as in the case of transverse oscillations.
The transition between the contrasted behaviours observed when the rotating cylinder was allowed to oscillate in the in-line direction or in the cross-flow direction remains to be explored; this is the object of the present work. In order to describe this transition and in particular clarify the passage between the distinct vibration regimes, the orientation of the vibration plane is introduced as a new parameter of the problem. This orientation is defined by the angle (
 $\unicode[STIX]{x1D703}$
) between the direction of the current and the direction of vibration, i.e.
 $\unicode[STIX]{x1D703}=0^{\circ }$
corresponds to the in-line degree of freedom and
 $\unicode[STIX]{x1D703}=90^{\circ }$
to the cross-flow degree of freedom. The behaviour of the coupled flow–structure system is investigated by means of two- and three-dimensional numerical simulations, for
 $\unicode[STIX]{x1D703}\in [0^{\circ },180^{\circ }]$
and over a wide range of reduced velocities. The Reynolds number is set to
 $100$
as in the previously mentioned studies concerning the in-line and cross-flow vibrations of a rotating cylinder. Three values of the rotation rate are examined. The non-rotating body case (
 $\unicode[STIX]{x1D6FC}=0$
) is considered as a reference case. In this case, Brika & Laneville (Reference Brika and Laneville1995) reported a reduction of VIV amplitude and synchronization window as
 $\unicode[STIX]{x1D703}$
is decreased from
 $90^{\circ }$
to
 $45^{\circ }$
, while Ongoren & Rockwell (Reference Ongoren and Rockwell1988) examined via forced vibrations the flow patterns emerging in this context; it, however, appears that the responses of a non-rotating cylinder, oscillating in an arbitrary direction, have received little attention in the literature. In addition to the non-rotating cylinder case, two cases of forced rotation are considered: a low value of the rotation rate (
 $\unicode[STIX]{x1D6FC}=1$
) for which only VIV-like responses have been observed in prior works and a high value of the rotation rate (
 $\unicode[STIX]{x1D6FC}=3$
), for which both VIV- and galloping-like regimes occur, as well as flow three-dimensional transition.
The paper is organized as follows. The physical model and the numerical method are described in § 2. The structural responses are quantified in § 3. The fluid forces are examined in § 4, with particular attention paid to the quasi-steady analysis of the problem. The flow physics, including wake-body synchronization and the three-dimensional transition, is studied in § 5. The main findings of this work are summarized in § 6.
2 Formulation and numerical method
The physical system and its modelling are presented in § 2.1. The numerical method employed and its validation are described in § 2.2.
2.1 Flow–structure system
A sketch of the physical system is presented in figure 1. The configuration is the same as in two previous studies concerning the flow-induced vibrations of a rotating cylinder (Bourguet & Lo Jacono Reference Bourguet and Lo Jacono2014, Reference Bourguet and Lo Jacono2015), except that in the present work, the elastically mounted, rigid circular cylinder is free to move in an arbitrary direction, instead of the cross-flow or in-line direction.
Sketch of the physical configuration.

The
 $(x,y,z)$
frame is fixed. The axis of the cylinder is parallel to the
 $z$
axis. The body is placed in an incompressible cross-current which is aligned with the
 $x$
axis. The Reynolds number based on the oncoming flow velocity (
 $U$
) and cylinder diameter (
 $D$
),
 $Re=\unicode[STIX]{x1D70C}_{f}UD/\unicode[STIX]{x1D707}$
, where
 $\unicode[STIX]{x1D70C}_{f}$
and
 $\unicode[STIX]{x1D707}$
denote the fluid density and viscosity, is set equal to 100, as in the above-mentioned works. As suggested by these prior studies and also confirmed by the present results, the flow remains two-dimensional over a wide region of the parameter space and the three-dimensional transition has only a limited influence on the system behaviour. The two-dimensional Navier–Stokes equations are thus employed over the entire parameter space to predict the flow dynamics and the three-dimensional Navier–Stokes equations are considered in selected points to investigate the three-dimensional transition. In the three-dimensional case, the cylinder aspect ratio is set to
 $L/D=10$
, where
 $L$
is the cylinder length in the spanwise direction (
 $z$
axis).
The cylinder can translate in an arbitrary direction, normal to the
 $z$
axis and defined by its angle
 $\unicode[STIX]{x1D703}$
with respect to the
 $x$
axis. In the following,
 $\unicode[STIX]{x1D703}$
is referred to as the vibration angle. The structural stiffness, damping ratio and mass per unit length are designated by
 $k$
,
 $\unicode[STIX]{x1D709}$
and
 $\unicode[STIX]{x1D70C}_{c}$
, respectively. All the physical variables are non-dimensionalised by the cylinder diameter, the oncoming flow velocity and the fluid density. The non-dimensional mass of the structure is defined as
 $m=\unicode[STIX]{x1D70C}_{c}/\unicode[STIX]{x1D70C}_{f}D^{2}$
. The non-dimensional cylinder displacement, velocity and acceleration are denoted by
 $\unicode[STIX]{x1D701}$
,
 $\dot{\unicode[STIX]{x1D701}}$
and
 $\ddot{\unicode[STIX]{x1D701}}$
, respectively. The in-line and cross-flow force coefficients are defined as
 $C_{x}=2\langle F_{x}\rangle /\unicode[STIX]{x1D70C}_{f}DU^{2}$
and
 $C_{y}=2\langle F_{y}\rangle /\unicode[STIX]{x1D70C}_{f}DU^{2}$
, where
 $F_{x}$
and
 $F_{y}$
are the dimensional sectional fluid forces aligned with the
 $x$
and
 $y$
axes, and
 $\langle \phantom{a}\rangle$
the span-averaging operator; in the two-dimensional case,
 $\langle F_{x}\rangle =F_{x}$
and
 $\langle F_{y}\rangle =F_{y}$
. The force coefficient in the direction of body motion is defined as
 $$\begin{eqnarray}C=C_{x}\cos (\unicode[STIX]{x1D703})+C_{y}\sin (\unicode[STIX]{x1D703}).\end{eqnarray}$$
The dynamics of the one-degree-of-freedom oscillator is governed by the following equation:
 $$\begin{eqnarray}\ddot{\unicode[STIX]{x1D701}}+{\displaystyle \frac{4\unicode[STIX]{x03C0}\unicode[STIX]{x1D709}}{U^{\star }}}\dot{\unicode[STIX]{x1D701}}+\left({\displaystyle \frac{2\unicode[STIX]{x03C0}}{U^{\star }}}\right)^{2}\unicode[STIX]{x1D701}={\displaystyle \frac{C}{2m}}.\end{eqnarray}$$
The reduced velocity is defined as
 $U^{\star }=1/f_{n}$
, where
 $f_{n}$
is the non-dimensional natural frequency in vacuum,
 $f_{n}=D/2\unicode[STIX]{x03C0}U\sqrt{k/\unicode[STIX]{x1D70C}_{c}}$
. As in the above-mentioned studies, the structural damping is set equal to zero (
 $\unicode[STIX]{x1D709}=0$
) to allow maximum amplitude oscillations and
 $m$
is set equal to 10.
A forced, counter-clockwise, steady rotation about its axis is applied to the cylinder. The rotation is controlled by the rotation rate
 $\unicode[STIX]{x1D6FC}=\unicode[STIX]{x1D6FA}D/2U$
, where
 $\unicode[STIX]{x1D6FA}$
is the angular velocity of the cylinder.
The behaviour of the system is explored in the
 $(\unicode[STIX]{x1D6FC},\unicode[STIX]{x1D703},U^{\star })$
parameter space. Three values of the rotation rate are considered,
 $\unicode[STIX]{x1D6FC}\in \{0,1,3\}$
, in order to cover the reference, non-rotating cylinder case and two typical rotating cylinder cases, i.e. a low value and a high value of
 $\unicode[STIX]{x1D6FC}$
, for which contrasted behaviours have been identified in prior works, as previously mentioned. The vibration angle varies from
 $\unicode[STIX]{x1D703}=0^{\circ }$
to
 $\unicode[STIX]{x1D703}=180^{\circ }$
. For
 $\unicode[STIX]{x1D6FC}=0$
, the simulations are restricted to the range
 $\unicode[STIX]{x1D703}\in [0^{\circ },90^{\circ }]$
since the complementary cases (
 $\unicode[STIX]{x1D703}\in [90^{\circ },180^{\circ }]$
) can be deduced by symmetry considerations. The following ranges of reduced velocities are examined:
 $U^{\star }\in [1.5,11.5]$
for
 $\unicode[STIX]{x1D6FC}\in \{0,1\}$
and
 $U^{\star }\in [5.5,30]$
for
 $\unicode[STIX]{x1D6FC}=3$
.
In order to assess the validity of a quasi-steady approach for the prediction of the system behaviour, a series of two-dimensional simulations where the cylinder is forced to translate at a constant velocity is also carried out for each rotation rate.
2.2 Numerical method
A summary of the numerical method, which is the same as in previous studies concerning comparable configurations (Bourguet & Lo Jacono Reference Bourguet and Lo Jacono2014, Reference Bourguet and Lo Jacono2015), and some additional validation results are presented here.
The coupled flow–structure equations are solved by the parallelised code Nektar, which is based on the spectral/
 $hp$
element method (Karniadakis & Sherwin Reference Karniadakis and Sherwin1999). A large rectangular computational domain is considered (
 $350D$
downstream and
 $250D$
in front, above and below the cylinder) in order to avoid any spurious blockage effects due to domain size. A no-slip condition is applied on the cylinder surface. Flow periodicity conditions are employed on the side (spanwise) boundaries in the three-dimensional case.
(a) Time-averaged in-line force coefficient, (b) time-averaged cross-flow force coefficient, (c) maximum amplitude of vibration and (d) dominant vibration frequency, as functions of the polynomial order, in the case of a flexibly mounted cylinder for
 $(\unicode[STIX]{x1D6FC},\unicode[STIX]{x1D703},U^{\star })=(3,135^{\circ },28)$
.

As shown in § 3, the vibration amplitudes reached in the present parameter space may be larger than those observed in the above mentioned studies. In addition to the validation results reported in these prior works, a convergence study in a typical case of very large amplitude oscillations is presented in figure 2. In this figure, the evolutions of the time-averaged force coefficients (
 $\overline{\phantom{a}}$
denotes the time-averaged value), maximum amplitude of vibration (
 $\tilde{\phantom{a}}$
denotes the fluctuation about the time-averaged value) and dominant vibration frequency, as functions of the spectral element polynomial order are plotted for
 $(\unicode[STIX]{x1D6FC},\unicode[STIX]{x1D703},U^{\star })=(3,135^{\circ },28)$
. A polynomial order equal to 4 is selected since an increase from order 4 to 5 has no significant influence on the results. In this typical case of large amplitude vibrations, it has also been verified that dividing the non-dimensional time step by 2 (i.e. from 0.001 to 0.0005) has no impact. For the three-dimensional simulations, 64 complex Fourier modes are employed in the spanwise direction; doubling the number of Fourier modes only has a negligible effect on the results.
The simulations are initialised with the established periodic flow past a stationary cylinder at
 $Re=100$
. Then the forced rotation is started and the body is released. The analysis is based on time series of more than 40 oscillation cycles, collected after convergence of the time-averaged and root mean square (r.m.s.) values of the fluid force coefficients and body displacement.
3 Structural responses
An overview of the flow-induced vibrations of the cylinder is presented in figure 3. In figure 3(a–c), the maximum oscillation amplitude of the body about its time-averaged position is plotted in the vibration angle–reduced velocity domain for each value of the rotation rate under study. As mentioned in § 2.1, the entire parameter space is covered by means of two-dimensional simulations of the flow. The flow undergoes three-dimensional transition over a range of
 $\unicode[STIX]{x1D703}$
for
 $\unicode[STIX]{x1D6FC}=3$
, as described in § 5.3. The three-dimensional simulations carried out in this region of the parameter space show that the transition has only a limited influence on the responses and they confirm the trends identified under two-dimensional flow assumption. Some three-dimensional simulation results are presented in the following to support this observation.
(a–c) Maximum amplitude of vibration and (d–f) large-amplitude vibration region (striped area), as functions of the vibration angle and reduced velocity, for (a,d)
 $\unicode[STIX]{x1D6FC}=0$
, (b,e)
 $\unicode[STIX]{x1D6FC}=1$
, (c,f)
 $\unicode[STIX]{x1D6FC}=3$
. In (d–f), the areas where the cylinder exhibits oscillations of any amplitudes are denoted by a light grey background; black dashed lines delimitate the regions of VIV-like and galloping-like responses in (f); for each bell-shaped response curve, a red dashed-dotted line indicates the value of the reduced velocity where the peak amplitude is reached; the value of the force-displacement phase difference is specified in blue and a blue dashed line denotes the location of the phase jump (no phase jump is observed for
 $\unicode[STIX]{x1D6FC}=3$
, in (f)).

In the absence of rotation (figure 3
a), the evolution of the vibration amplitude as a function of
 $U^{\star }$
exhibits, for each
 $\unicode[STIX]{x1D703}>0^{\circ }$
, a bell shape centred about
 $U^{\star }\approx 6$
. The vibrations occurring for
 $\unicode[STIX]{x1D703}=0^{\circ }$
at
 $Re=100$
remain very small and are not visible in the plot; they also present a bell-shaped evolution but centred about
 $U^{\star }\approx 3$
, as shown in a prior work (Bourguet & Lo Jacono Reference Bourguet and Lo Jacono2015). From
 $\unicode[STIX]{x1D703}=0^{\circ }$
, the peak amplitude and the width of the bell increase monotonically with
 $\unicode[STIX]{x1D703}$
, up to
 $\unicode[STIX]{x1D703}=90^{\circ }$
, as also observed by Brika & Laneville (Reference Brika and Laneville1995) for
 $\unicode[STIX]{x1D703}\in [45^{\circ },90^{\circ }]$
. The response amplification is particularly steep between
 $\unicode[STIX]{x1D703}=30^{\circ }$
and
 $\unicode[STIX]{x1D703}=45^{\circ }$
, where the peak magnitude is multiplied by 4. Due to the system symmetry for
 $\unicode[STIX]{x1D6FC}=0$
, each case of vibration angle
 $\unicode[STIX]{x1D703}\in [90^{\circ },180^{\circ }]$
is equivalent to the case
 $180^{\circ }-\unicode[STIX]{x1D703}$
, and the plot is thus symmetrical with respect to
 $\unicode[STIX]{x1D703}=90^{\circ }$
. A slight augmentation of the structural response amplitudes and widening of the vibration windows can be noted once the cylinder is subjected to a slow rotation at the rate of 1 (figure 3
b). The rotation breaks the above-mentioned symmetry about
 $\unicode[STIX]{x1D703}=90^{\circ }$
and a subtle asymmetry indeed appears in the plot. The global shape of the responses remains, however, comparable to that observed for
 $\unicode[STIX]{x1D6FC}=0$
and is typical of VIV. The vibrations occurring when the rotation rate is increased to 3 are depicted in figure 3(c). It is recalled that for a rigidly mounted cylinder, this value of
 $\unicode[STIX]{x1D6FC}$
leads to the suppression of vortex shedding. Here, the elastically mounted cylinder exhibits flow-induced vibrations over the entire range of
 $\unicode[STIX]{x1D703}$
. The occurrence of structural oscillations beyond the critical value
 $\unicode[STIX]{x1D6FC}\approx 2$
had also been reported in previous works (e.g. Wong et al.
Reference Wong, Zhao, Lo Jacono, Thompson and Sheridan2017). Contrary to what was observed for
 $\unicode[STIX]{x1D6FC}=0$
and
 $\unicode[STIX]{x1D6FC}=1$
, two distinct forms of response emerge when the vibration angle is varied. From
 $\unicode[STIX]{x1D703}=0^{\circ }$
up to a critical value located between
 $10^{\circ }$
and
 $20^{\circ }$
, the oscillations present galloping-like evolutions, i.e. beyond a critical value of the reduced velocity, their amplitude grows unboundedly with
 $U^{\star }$
. When
 $\unicode[STIX]{x1D703}$
is further increased above this critical value, the system exhibits VIV-like responses. It can be noted that the width and amplitude of the bell-shaped curve as a function of
 $U^{\star }$
may considerably increase compared to the lower-
 $\unicode[STIX]{x1D6FC}$
cases. A second critical value of
 $\unicode[STIX]{x1D703}$
is reached between
 $90^{\circ }$
and
 $100^{\circ }$
, beyond which galloping-like responses resume. The contrasted behaviours of the system uncovered in prior studies for
 $\unicode[STIX]{x1D703}=90^{\circ }$
(Bourguet & Lo Jacono Reference Bourguet and Lo Jacono2014) and
 $\unicode[STIX]{x1D703}=0^{\circ }$
(Bourguet & Lo Jacono Reference Bourguet and Lo Jacono2015) are typical cases of VIV-like and galloping-like responses; a continuous vision of the transition between these two typical cases is presented here.
A complementary visualisation of the body response in the
 $(\unicode[STIX]{x1D703},U^{\star })$
domain is proposed, for each
 $\unicode[STIX]{x1D6FC}$
, in figure 3(d–f). In these maps, the areas of the parameter space where the cylinder exhibits oscillations of any amplitudes are denoted by a light grey background. The regions where the maximum oscillation amplitude is larger than 0.025 are indicated by striped zones; these regions are referred to as large-amplitude vibration regions or, to simplify the reading, vibration regions, in the following. For
 $\unicode[STIX]{x1D6FC}\in \{0,1\}$
(figure 3
d,e), the cylinder exhibits some oscillations over the entire domain, as generally observed in the presence of unsteady wakes (e.g. Leontini et al.
Reference Leontini, Stewart, Thompson and Hourigan2006). In contrast, the body remains stationary outside the large-amplitude vibration region for
 $\unicode[STIX]{x1D6FC}=3$
(white areas in figure 3
f) where the flow is steady, as discussed in § 5. For
 $\unicode[STIX]{x1D6FC}=3$
, the areas characterised by VIV-like and galloping-like responses are indicated in the map. For each case of bell-shaped response curve, the value of
 $U^{\star }$
associated with the peak amplitude is represented by a red dashed-dotted line. A comparison of the maps obtained for
 $\unicode[STIX]{x1D6FC}=0$
and
 $\unicode[STIX]{x1D6FC}=1$
(figure 3
d,e) illustrates the widening of the vibration region and the slight asymmetry about
 $\unicode[STIX]{x1D703}=90^{\circ }$
induced by the slow rotation. This asymmetry is dramatically amplified for
 $\unicode[STIX]{x1D6FC}=3$
(figure 3
f).
The structural responses are periodic and, in most cases, close to sinusoidal, i.e. dominated by a single frequency. In some rare cases near the symmetrical configuration
 $\unicode[STIX]{x1D703}=0^{\circ }$
, both the fundamental and the second harmonic components exhibit significant contributions to the response spectrum. In the following, the term vibration frequency refers to the dominant vibration frequency, which is denoted by
 $f$
. The deviation between the vibration frequency and the natural frequency of the oscillator (
 $f_{n}$
) is measured via the frequency ratio
 $f^{\star }=f/f_{n}=fU^{\star }$
.
(a–c) Maximum amplitude of vibration and (d–f) dominant vibration frequency normalised by the oscillator natural frequency, as functions of the reduced velocity, over a range of vibration angles, for (a,d)
 $\unicode[STIX]{x1D6FC}=0$
, (b,e)
 $\unicode[STIX]{x1D6FC}=1$
, (c,f)
 $\unicode[STIX]{x1D6FC}=3$
. In (d–f), the frequency ratios associated with vibration amplitudes larger than 0.025 are represented; in each plot, a dashed line indicates the frequency of vortex shedding in the rigidly mounted, non-rotating cylinder case (Strouhal frequency) normalised by the oscillator natural frequency. In (c,f), the three-dimensional simulation results are denoted by circled blue symbols.

In order to provide a more quantitative description of the responses, the maximum vibration amplitude is plotted in figure 4(a–c), as a function of
 $U^{\star }$
, for each value of
 $\unicode[STIX]{x1D6FC}$
and selected vibration angles. The frequency ratios associated with the large-amplitude vibrations identified in figure 3(d–f) (amplitudes larger than 0.025) are represented in figure 4(d–f). In the absence of rotation (
 $\unicode[STIX]{x1D6FC}=0$
) and for
 $\unicode[STIX]{x1D703}=0^{\circ }$
, a peak of vibration appears near
 $U^{\star }=3$
, with amplitudes of
 $1.5\times 10^{-3}$
and dominant frequencies close to twice the Strouhal frequency (the frequency of vortex formation downstream of a rigidly mounted, non-rotating cylinder). The same axis ranges are considered in figure 4(a,b) and figure 4(d,e), i.e.
 $\unicode[STIX]{x1D6FC}=0$
versus
 $\unicode[STIX]{x1D6FC}=1$
cases, to highlight the influence of the imposed rotation, in particular the amplification of the bell-shaped responses. For
 $\unicode[STIX]{x1D6FC}=1$
, clear differences can be noted between the responses observed for
 $\unicode[STIX]{x1D703}=45^{\circ }$
and
 $\unicode[STIX]{x1D703}=135^{\circ }$
whereas for
 $\unicode[STIX]{x1D6FC}=0$
, these two configurations are equivalent.
For
 $\unicode[STIX]{x1D6FC}=3$
, the growth of the galloping-like response amplitude with
 $U^{\star }$
exhibits a substantial variability as a function of the vibration angle (figure 4
c). The very steep growth encountered for
 $\unicode[STIX]{x1D703}\in [110^{\circ },140^{\circ }]$
leads to vibration amplitudes approximately twice larger than those reported in a previous study for
 $\unicode[STIX]{x1D703}=0^{\circ }$
(Bourguet & Lo Jacono Reference Bourguet and Lo Jacono2015). In addition, the shape of the response curve varies from one case to the other: a quasi-linear evolution is noted for
 $\unicode[STIX]{x1D703}=110^{\circ }$
while pronounced undulations occur for
 $\unicode[STIX]{x1D703}=150^{\circ }$
. These successive steps in the response curve, which appear for
 $\unicode[STIX]{x1D703}\in [120^{\circ },170^{\circ }]$
approximately, resemble the ‘kinks’ identified by Bearman et al. (Reference Bearman, Gartshore, Maull and Parkinson1987) and suggest a possible interaction with wake patterns; this point is addressed in § 5.
The vibration frequency generally follows the Strouhal frequency (dashed lines in figure 4
d–f) in the lower range of
 $U^{\star }$
. In the higher range of
 $U^{\star }$
, it often deviates from the Strouhal frequency and presents much lower values, especially for
 $\unicode[STIX]{x1D6FC}=3$
. For
 $\unicode[STIX]{x1D6FC}\in \{0,1\}$
, the vibration frequency crosses the natural frequency as
 $U^{\star }$
is increased. In contrast, it remains lower than
 $f_{n}$
for
 $\unicode[STIX]{x1D6FC}=3$
(
 $f^{\star }<1$
), regardless the VIV- or galloping-like nature of the response. This observation is connected to the force-displacement phasing, as discussed in § 4.
The three-dimensional simulation results reported for
 $\unicode[STIX]{x1D6FC}=3$
in figure 4(c,f) (circled blue symbols) illustrate the limited impact of the flow three-dimensional transition on the oscillatory responses.
To summarise, when the vibration angle is increased from
 $0^{\circ }$
to
 $90^{\circ }$
(or decreased from
 $180^{\circ }$
to
 $90^{\circ }$
), the bell-shaped curve of the non-rotating cylinder oscillation amplitude as a function of
 $U^{\star }$
, typical of VIV, tends to monotonically increase in width and magnitude. The behaviour of the system remains globally the same when the cylinder is subjected to a forced rotation at the low rate of 1. The main effects of the slow rotation are a slight amplification of the VIV-like responses and widening of the vibration windows, as well as a limited asymmetry of the responses about
 $\unicode[STIX]{x1D703}=90^{\circ }$
. When the rotation rate is increased to 3, as suggested by prior results concerning in-line and cross-flow vibrations, the system undergoes a transition in the nature of its responses as
 $\unicode[STIX]{x1D703}$
is varied: both VIV-like and galloping-like oscillations are encountered. The response asymmetry about
 $\unicode[STIX]{x1D703}=90^{\circ }$
is much more pronounced than for
 $\unicode[STIX]{x1D6FC}=1$
. Very large vibration amplitudes and low frequencies are reached. A considerable variability is noted in the response growth rate and shape within the region of galloping-like oscillations. This description of the structural responses raises a number of questions regarding fluid forcing and flow physics, among others concerning the coupling with wake unsteadiness and the possible quasi-steady nature of the excitation mechanism in some areas of the parameter space; these aspects are examined in the next sections.
Time-averaged (a–c) in-line and (d–f) cross-flow force coefficients as functions of the reduced velocity, over a range of vibration angles, for (a,d)
 $\unicode[STIX]{x1D6FC}=0$
, (b,e)
 $\unicode[STIX]{x1D6FC}=1$
, (c,f)
 $\unicode[STIX]{x1D6FC}=3$
. In each plot, the time-averaged value of the force coefficient in the rigidly mounted cylinder case is indicated by a dashed line. In (c,f), the three-dimensional simulation results are denoted by circled blue symbols.

4 Fluid forcing
Some elements of statistical and spectral analyses of the fluid forces are reported in § 4.1; the objective is not to provide a thorough description of the forces, but to highlight their possible alteration once the body oscillates. The prediction of the structural dynamics based on a quasi-steady modelling of fluid forcing is explored in § 4.2.
4.1 Force statistics and frequency content
The time-averaged values of the in-line and cross-flow force coefficients are plotted in figure 5, as functions of
 $U^{\star }$
, for each value of
 $\unicode[STIX]{x1D6FC}$
and the same vibration angles as in figure 4. As previously mentioned, two-dimensional simulations are employed to cover the parameter space and some three-dimensional simulation results (indicated by circled blue symbols in figure 4
c,f) are reported to visualise the influence of the three-dimensional transition.
The occurrence of structural oscillations is associated with a deviation of
 $\overline{C}_{x}$
and
 $\overline{C}_{y}$
from the values observed in the rigidly mounted cylinder case (dashed lines in figure 5). This deviation results in a shift of the cylinder time-averaged position, compared to the position predicted by considering the time-averaged form of the structure dynamics (2.2) and the values of the force coefficients in the rigidly mounted body case. As also reported in previous works concerning non-rotating cylinders (e.g. Khalak & Williamson Reference Khalak and Williamson1999), the time-averaged in-line force is generally amplified once the body vibrates, regardless of the vibration angle. In the absence of vibration,
 $\overline{C}_{x}$
substantially decreases when
 $\unicode[STIX]{x1D6FC}$
is increased from
 $0$
to
 $3$
. It can be noted that the reduction of
 $\overline{C}_{x}$
due to the rotation may be counterbalanced by the appearance of structural vibrations: in some vibrating body cases, the mean in-line force is larger for
 $\unicode[STIX]{x1D6FC}=3$
than for
 $\unicode[STIX]{x1D6FC}=0$
. The global decrease of
 $\overline{C}_{y}$
as a function of
 $\unicode[STIX]{x1D6FC}$
relates to the Magnus effect (Prandtl Reference Prandtl1925); both positive and negative deviations from the rigidly mounted body case values are observed. The asymmetry about
 $\unicode[STIX]{x1D703}=90^{\circ }$
, induced by the rotation, is illustrated for
 $\unicode[STIX]{x1D6FC}=1$
in figure 5(b,e) by the comparison of the time-averaged force coefficients obtained for
 $\unicode[STIX]{x1D703}=45^{\circ }$
and
 $\unicode[STIX]{x1D703}=135^{\circ }$
.
The three-dimensional simulation results reported for
 $\unicode[STIX]{x1D6FC}=3$
are close to the two-dimensional ones, which confirms the limited effect of the flow three-dimensional transition, already noted in § 3 for the structural responses.
Power spectral density (PSD) of the force coefficient aligned with the vibration direction (2.1) as a function of the reduced velocity, for (a)
 $(\unicode[STIX]{x1D6FC},\unicode[STIX]{x1D703})=(0,45^{\circ })$
, (b)
 $(\unicode[STIX]{x1D6FC},\unicode[STIX]{x1D703})=(1,135^{\circ })$
, (c)
 $(\unicode[STIX]{x1D6FC},\unicode[STIX]{x1D703})=(3,45^{\circ })$
, (d)
 $(\unicode[STIX]{x1D6FC},\unicode[STIX]{x1D703})=(3,110^{\circ })$
, (e)
 $(\unicode[STIX]{x1D6FC},\unicode[STIX]{x1D703})=(3,135^{\circ })$
, (f)
 $(\unicode[STIX]{x1D6FC},\unicode[STIX]{x1D703})=(3,150^{\circ })$
. In each plot, the reduced velocity range is restricted to the unsteady flow cases. For each reduced velocity, the PSD is normalised by the magnitude of the largest peak. The colour levels range from 0 (white) to 1 (black). When the vibration amplitude is larger than 0.025, the dominant vibration frequency (
 $f$
) is indicated by a blue triangle.

The fluid forces are periodic in all studied cases. The frequency content of the fluid force acting on the body in the vibration direction is quantified in figure 6, where the power spectral density (PSD) of
 $C$
(2.1) time series is plotted as a function of the reduced velocity, for selected points in the rotation rate-vibration angle domain. These points are considered as examples covering the typical responses of the system. The observations reported in the following can be generalised to the entire parameter space, and are also corroborated by the three-dimensional simulation results. Each PSD is normalised by the magnitude of the largest peak. The dominant vibration frequency is indicated by a blue triangle in each case located within the large-amplitude vibration region (amplitudes larger than 0.025; figure 3). The PSD show that the fundamental frequency of fluid forcing, which generally dominates the spectrum, coincides with the vibration frequency. Higher harmonic components, appearing at integer multiples of the fundamental frequency, may exhibit significant contributions to the force spectrum, especially in the region of galloping-like responses (for example in figure 6
d). The presence and relative magnitude of higher harmonics in the fluid forces exerted on an oscillating body have been addressed in prior studies (e.g. Wang, So & Chan Reference Wang, So and Chan2003; Dahl et al.
Reference Dahl, Hover, Triantafyllou and Oakley2010; Wu, Ge & Hong Reference Wu, Ge and Hong2012; Bourguet & Lo Jacono Reference Bourguet and Lo Jacono2014; Gsell et al.
Reference Gsell, Bourguet and Braza2016). Apart from these harmonics of displacement, no other component emerges in the force spectrum. This suggests that there is no other component in flow unsteadiness, i.e. the wake is synchronised with body motion; this feature will be confirmed in § 5.
In the absence of structural damping and for periodic responses as those observed here, the phase difference (
 $\unicode[STIX]{x1D719}$
) between the force component at the vibration frequency and the body motion is equal to
 $0^{\circ }$
when the vibration frequency is lower than the natural frequency, and
 $180^{\circ }$
when the vibration frequency is larger than the natural frequency (e.g. Bourguet & Lo Jacono Reference Bourguet and Lo Jacono2015). The location of the phase difference jump occurring for
 $\unicode[STIX]{x1D6FC}\in \{0,1\}$
, when the vibration frequency passes through the value of the natural frequency (
 $f^{\star }=1$
), is indicated by a blue dashed line in the maps of figure 3(d,e). For
 $\unicode[STIX]{x1D6FC}=3$
, the vibration frequency remains lower than the natural frequency in all cases and the force and displacement are always in phase (
 $\unicode[STIX]{x1D719}=0^{\circ }$
). As also explained in the above-mentioned paper, the force-displacement phase difference jump is accompanied by a change in the sign of the effective added mass induced by the fluid force in phase with the cylinder acceleration. For
 $\unicode[STIX]{x1D6FC}\in \{0,1\}$
, the effective added mass switches from positive to negative values as
 $U^{\star }$
is increased while it remains positive for
 $\unicode[STIX]{x1D6FC}=3$
.
The apparent synchronization between body motion and flow unsteadiness, which will be further examined in § 5, may indicate that the system behaviour is driven by the lock-in mechanism over the entire parameter space. However, the emergence of galloping-like oscillations characterised by large amplitudes and very low frequencies, compared to the Strouhal frequency, suggests that a quasi-steady modelling of fluid forcing could be relevant in some cases. Such a modelling approach is studied in the following.
4.2 Quasi-steady analysis
In a previous work concerning the in-line vibrations of a rotating cylinder (Bourguet & Lo Jacono Reference Bourguet and Lo Jacono2015), a preliminary study showed that the galloping-like oscillations observed at high rotation rates were not expected based on a quasi-steady modelling of fluid forcing. The object of this section is to further explore the quasi-steady vision of the problem over the entire range of vibration angles. The quasi-steady approach consists of deducing the oscillatory responses from the fluid forces measured when the body moves at a constant velocity. For more clarity, the approach involving the coupled, unsteady flow–structure system, which is described in § 2 and employed in the rest of the paper, is referred to as the unsteady simulation approach in the following. As a first step, focus is placed on the validity of the quasi-steady approach for the prediction of the system stability around its equilibrium position. Then, as a second step, the possibility of using this approach to estimate the response amplitude is analysed.
Sketch of the physical configuration considered in the quasi-steady analysis.

Additional simulations where the cylinder is forced to translate at a constant velocity, at an angle
 $\unicode[STIX]{x1D703}$
, were performed in order to quantify the evolution of the time-averaged forces in this case. A sketch of the configuration is presented in figure 7. To avoid confusion with the results concerning the elastically mounted body case, the superscript
 $^{c}$
is added to the physical variables, indicating that the cylinder moves at a constant velocity; the velocity is thus denoted by
 $\dot{\unicode[STIX]{x1D701}}^{c}=\overline{\dot{\unicode[STIX]{x1D701}}^{c}}$
and the force coefficient in the direction of motion by
 $C^{c}$
.
The gradient of
 $\overline{C^{c}}$
with respect to
 $\dot{\unicode[STIX]{x1D701}}^{c}$
for
 $\dot{\unicode[STIX]{x1D701}}^{c}=0$
is plotted as a function of
 $\unicode[STIX]{x1D703}$
and for each rotation rate in figure 8. The sign of this gradient is used as stability criterion. A comparable criterion, often employed to study the transverse galloping oscillations of rectangular cylinders, is based on the gradient of the mean force with respect to the angle of attack of the body (e.g. Mannini et al.
Reference Mannini, Marra and Bartoli2014); in the present case, such a criterion could also be applied, for
 $\unicode[STIX]{x1D703}\in ]\!0^{\circ },180^{\circ }\ $\unicode[STIX]{x1D6FC}\in \{0,1\}$
(figure 8
a), the gradient remains negative: the time-averaged force tends to oppose any variation of
 $\dot{\unicode[STIX]{x1D701}}^{c}$
. From a quasi-steady perspective, the system is thus expected to be stable and no vibration should occur. In contrast, for
 $\unicode[STIX]{x1D6FC}=3$
(figure 8
b) the gradient of
 $\overline{C^{c}}$
becomes positive over a wide range of
 $\unicode[STIX]{x1D703}$
, i.e. the mean force tends to promote body motion, suggesting that the system is unstable in this region of the parameter space. This range roughly coincides with the region of galloping-like oscillations identified via the unsteady simulation approach in § 3 and delimited by dashed lines in figure 8(b). However, it can be noted that the boundaries of the galloping-like response region are not accurately captured by the quasi-steady approach. In particular for
 $\unicode[STIX]{x1D703}=0^{\circ }$
, as also reported in a prior study (Bourguet & Lo Jacono Reference Bourguet and Lo Jacono2015), the occurrence of galloping-like oscillations is not predicted by the quasi-steady approach. The variability of the mean force gradient as a function of the vibration angle suggests a variability of the response amplitude growth rate, which is actually observed in the unsteady simulation results (figures 3
c, 4
c). In addition, the stability criterion based on the sign of the gradient of
 $\overline{C^{c}}$
is independent from the value of the mass ratio; therefore, figure 8 may provide some insights concerning the system behaviour for other values of
 $m$
.
Quasi-steady analysis: gradient of the time-averaged value of the force coefficient aligned with the direction of motion for
 $\dot{\unicode[STIX]{x1D701}}^{c}=0$
, as a function of the translation direction angle, for (a)
 $\unicode[STIX]{x1D6FC}\in \{0,1\}$
and (b)
 $\unicode[STIX]{x1D6FC}=3$
. In (b), dashed lines delimitate the regions of VIV-like and galloping-like responses determined via the unsteady simulation approach in § 3.

In order to shed some light on its evolution, the mean force gradient can be decomposed as follows, for
 $\dot{\unicode[STIX]{x1D701}}^{c}=0$
:
 $$\begin{eqnarray}{\displaystyle \frac{\text{d}\overline{C^{c}}}{\text{d}\dot{\unicode[STIX]{x1D701}}^{c}}}(\dot{\unicode[STIX]{x1D701}}^{c}=0)=-\overline{C_{x}^{r}}(1+\cos ^{2}(\unicode[STIX]{x1D703}))-\overline{C_{y}^{r}}\cos (\unicode[STIX]{x1D703})\sin (\unicode[STIX]{x1D703})+{\displaystyle \frac{\text{d}\overline{C_{x}^{r}}}{\text{d}\dot{\unicode[STIX]{x1D701}}^{c}}}\cos (\unicode[STIX]{x1D703})+{\displaystyle \frac{\text{d}\overline{C_{y}^{r}}}{\text{d}\dot{\unicode[STIX]{x1D701}}^{c}}}\sin (\unicode[STIX]{x1D703}),\end{eqnarray}$$
where
 $C_{x}^{r}$
and
 $C_{y}^{r}$
denote the force coefficients parallel and normal to the relative flow velocity seen by the moving body, and scaled by the magnitude of this relative velocity; in non-dimensional form, the relative velocity can be expressed as
 $\boldsymbol{V}^{r}=\{1-\dot{\unicode[STIX]{x1D701}}^{c}\cos (\unicode[STIX]{x1D703}),-\dot{\unicode[STIX]{x1D701}}^{c}\sin (\unicode[STIX]{x1D703}),0\}^{\text{T}}$
(figure 7). For a non-rotating circular cylinder, the time-averaged force perpendicular to the relative velocity vanishes (
 $\overline{C_{y}^{r}}=0$
). The gradient of
 $\overline{C_{x}^{r}}$
around
 $\dot{\unicode[STIX]{x1D701}}^{c}=0$
remains small in the present range of
 $Re$
. The evolution of
 $\overline{C^{c}}$
gradient is thus essentially determined by the first term on the right-hand side in (4.1); this explains its negative sign and its bell shape as a function of
 $\unicode[STIX]{x1D703}$
. For
 $\unicode[STIX]{x1D6FC}=1$
, a monitoring of the contribution of each term in (4.1) indicates that the global shape of
 $\overline{C^{c}}$
gradient is still driven by the force component aligned with the relative velocity. The appearance of a mean normal component (
 $\overline{C_{y}^{r}}$
), due to the rotation (Magnus effect), is responsible for a slight asymmetry of the bell-shaped curve about
 $\unicode[STIX]{x1D703}=90^{\circ }$
. The influence of the mean normal component becomes predominant for
 $\unicode[STIX]{x1D6FC}=3$
and the curve shape is radically modified.
The quasi-steady approach predicts that the system becomes unstable over a range of
 $\unicode[STIX]{x1D703}$
for
 $\unicode[STIX]{x1D6FC}=3$
. The question arises whether this approach can be used to estimate the evolution of the vibration amplitude as a function of the reduced velocity. To examine this aspect, four typical cases of galloping-like responses identified via the unsteady simulation approach are considered,
 $\unicode[STIX]{x1D703}\in \{10^{\circ },110^{\circ },150^{\circ },170^{\circ }\}$
. For each case, the time-averaged force coefficient measured when the cylinder moves at a constant velocity (configuration depicted in figure 7) is plotted as a function of the velocity value in figure 9(a–d). In a series of additional simulations of the structural response, these curves are used to approximate the fluid force coefficient on the right-hand side of the dynamics equation (2.2). For each value of
 $\unicode[STIX]{x1D703}$
and each value of
 $U^{\star }$
, the dynamics equation (2.2) is integrated in time as in the unsteady approach, but here the force coefficient
 $C$
is not issued from the unsteady flow simulation; instead, the value of
 $C$
is replaced, at each time step, by the value of
 $\overline{C^{c}}$
issued from the curves plotted in figure 9(a–d), at the corresponding velocity (
 $\dot{\unicode[STIX]{x1D701}}^{c}=\dot{\unicode[STIX]{x1D701}}$
). The maximum amplitudes of oscillation obtained by the quasi-steady approach, after convergence is reached, are compared to the unsteady simulation results in figure 9(e–h).
Detailed quasi-steady analysis for
 $\unicode[STIX]{x1D6FC}=3$
: (a–d) time-averaged value of the force coefficient aligned with the direction of motion as a function of the body (constant) velocity and (e–h) maximum amplitudes of vibration, obtained from the quasi-steady and unsteady simulation approaches, as functions of the reduced velocity, for (a,e)
 $\unicode[STIX]{x1D703}=10^{\circ }$
, (b,f)
 $\unicode[STIX]{x1D703}=110^{\circ }$
, (c,g)
 $\unicode[STIX]{x1D703}=150^{\circ }$
, (d,h)
 $\unicode[STIX]{x1D703}=170^{\circ }$
.

As expected given the negative force gradient for
 $\dot{\unicode[STIX]{x1D701}}^{c}=0$
, no vibration is predicted by the quasi-steady model for
 $\unicode[STIX]{x1D703}=10^{\circ }$
. In the three other cases, where the force gradient is positive for
 $\dot{\unicode[STIX]{x1D701}}^{c}=0$
, the increasing trends of the vibration amplitude are relatively well predicted. A monitoring of the instantaneous energy transfer between the flow and the moving body, via
 $C\dot{\unicode[STIX]{x1D701}}$
, shows that its evolution is globally captured by the quasi-steady approach in these three cases. The proximity between the results issued from the quasi-steady and unsteady simulation approaches suggests that the galloping-like responses could be essentially driven by the evolution of the mean flow (and thus mean fluid forcing) at each step of the oscillation cycle. Two important limitations should, however, be mentioned on the basis of these results. First, in the absence of structural damping, the quasi-steady approach indicates that the body vibrates for any (positive) value of the reduced velocity, i.e. the existence of a critical value of
 $U^{\star }$
for the onset of free vibrations is not captured. Second, the evolutions of the vibration amplitude issued from the quasi-steady approach are close to linear and the undulations appearing in some cases are not predicted (e.g. for
 $\unicode[STIX]{x1D703}=150^{\circ }$
; figure 9
g). Other limitations of the quasi-steady approach, not depicted here, include a general overestimation of the vibration frequency and an inaccurate prediction of the alteration of some statistics of the fluid forces, once the body oscillates. In addition, it is recalled that the VIV-like oscillations, even in cases of large-amplitude, low-frequency responses, are not predicted by the quasi-steady approach.
The above analysis shows that a quasi-steady modelling of fluid forcing predicts the occurrence of galloping-like responses at high rotation rates. Some features are reasonably captured by this approach: it provides rough estimates of the range of
 $\unicode[STIX]{x1D703}$
where galloping-like oscillations can be expected and of the evolution of the response amplitude as a function of
 $U^{\star }$
. This approach assumes a decoupling between the structure and the flow dynamics, which implies that the interaction with flow unsteadiness is neglected; some limitations of such decoupling have been highlighted in this section. The unsteadiness of the flow and its alteration once the cylinder vibrates are addressed in the next section.
5 Flow physics
The spatio-temporal structure of the flow is studied in this section. The frequency content of the flow and its synchronization with body motion are examined in § 5.1. The wake patterns emerging in the plane perpendicular to the axis of the vibrating cylinder are investigated in § 5.2. Finally, some properties of flow three-dimensional transition are presented in § 5.3.
5.1 Flow frequency content
In the absence of rotation and for
 $\unicode[STIX]{x1D6FC}=1$
, the flow is unsteady over the entire
 $(\unicode[STIX]{x1D703},U^{\star })$
parameter space. For
 $\unicode[STIX]{x1D6FC}=3$
, i.e. beyond the critical value of 2 associated with the cancellation of the von Kármán street when the body is rigidly mounted (e.g. Stojković et al.
Reference Stojković, Breuer and Durst2002), it is unsteady within the vibration region identified in figure 3(f) and remains steady outside. The systematic spectral analysis is based on time series of the cross-flow component of the flow velocity (
 $y$
-axis component,
 $v$
), collected at
 $(x,y)=(10,0)$
for the two-dimensional simulations and
 $(x,y,z)=(10,0,5)$
for the three-dimensional simulations, i.e. 10 diameters downstream of the cylinder position in quiescent fluid. The time series of
 $v$
is periodic in all cases. The PSD of
 $v$
is plotted as a function of the reduced velocity in figure 10, for the same cases as those selected in figure 6. As previously mentioned, these cases are representative of the general behaviour of the system over the entire parameter space, which is also confirmed by the three-dimensional simulation results. At each reduced velocity, the PSD is normalised by the magnitude of the largest peak and the dominant frequency of the structural oscillation is indicated by a blue triangle when its amplitude is larger than 0.025 (large-amplitude vibration regions in figure 3). As suggested in § 4.1 by the PSD of the fluid force, it appears that flow unsteadiness and body motion are always synchronised. More precisely, the fundamental frequency of the wake coincides with the vibration frequency as long as the flow remains two-dimensional; in the three-dimensional case, lower frequency components may occur in the flow velocity spectrum, but these components are always subharmonics of the displacement, e.g. at half the vibration frequency. Therefore, both VIV-like and galloping-like responses develop under the lock-in condition.
PSD of the cross-flow component of the flow velocity at
 $(x,y)=(10,0)$
(two-dimensional simulations) as a function of the reduced velocity, for (a)
 $(\unicode[STIX]{x1D6FC},\unicode[STIX]{x1D703})=(0,45^{\circ })$
, (b)
 $(\unicode[STIX]{x1D6FC},\unicode[STIX]{x1D703})=(1,135^{\circ })$
, (c)
 $(\unicode[STIX]{x1D6FC},\unicode[STIX]{x1D703})=(3,45^{\circ })$
, (d)
 $(\unicode[STIX]{x1D6FC},\unicode[STIX]{x1D703})=(3,110^{\circ })$
, (e)
 $(\unicode[STIX]{x1D6FC},\unicode[STIX]{x1D703})=(3,135^{\circ })$
, (f)
 $(\unicode[STIX]{x1D6FC},\unicode[STIX]{x1D703})=(3,150^{\circ })$
. In each plot, the reduced velocity range is restricted to the unsteady flow cases. For each reduced velocity, the PSD is normalised by the magnitude of the largest peak. The colour levels range from 0 (white) to 1 (black). When the vibration amplitude is larger than 0.025, the dominant vibration frequency (
 $f$
) is indicated by a blue triangle.

Prior works concerning non-rotating cylinders have shown that wake-body synchronization is the mechanism that drives VIV (e.g. Williamson & Govardhan Reference Williamson and Govardhan2004); it seems natural that the present VIV-like oscillations involve such synchronization. The lock-in condition persists for the galloping-like responses while such responses do not generally require it (Païidoussis et al. Reference Païdoussis, Price and de Langre2010).
The quasi-steady analysis reported in § 4.2 indicates that the galloping-like oscillations could be mainly driven by the mean flow and its evolution as the body moves. The unsteadiness of the flow could thus only be a consequence of body oscillation, which may explain why it remains synchronised, and it may not be involved in the excitation of the structure. The limitations of the quasi-steady approach, especially regarding the range of
 $\unicode[STIX]{x1D703}$
where galloping-like responses occur and the shape of the response curves, however, show that flow (synchronised) unsteadiness and its influence on the structural responses cannot be neglected, even if it is not the driving mechanism. Moreover, the undulations appearing in the evolution of the vibration amplitude versus
 $U^{\star }$
, not captured by the quasi-steady approach, can be connected to changes in the unsteady wake structure, as discussed in the following.
As also observed in a previous study concerning streamwise vibrations (Bourguet & Lo Jacono Reference Bourguet and Lo Jacono2015), the emergence of large higher harmonic contributions in the flow velocity spectrum, as
 $U^{\star }$
is increased within the region of galloping-like responses (figure 10
d–f), suggests that an increasing number of vortices form per oscillation cycle; the flow patterns developing downstream of the vibrating cylinder are explored in § 5.2.
5.2 Flow patterns
A nomenclature based on the number of spanwise vortices shed per period of body oscillation is adopted to designate the unsteady patterns appearing in the plane normal to the cylinder axis (
 $(x,y)$
plane). For example, the VI pattern is associated with the formation of six vortices per oscillation cycle. The lock-in condition is always established and the oscillation period generally coincides with the fundamental period of the flow unsteadiness (inverse of the fundamental frequency of
 $v$
), except in some three-dimensional flow cases where subharmonics of the displacement appear in the flow velocity spectrum. Due to the large number of vortices involved in some wake patterns and their distorted shapes, this nomenclature, also employed in a prior work (Bourguet & Lo Jacono Reference Bourguet and Lo Jacono2015), may appear more systematic than the approach based on the identification of single vortices (S) and pairs (P) of vortices (Williamson Reference Williamson1988).
For
 $\unicode[STIX]{x1D6FC}\in \{0,1\}$
, the wake is characterised by the formation of two counter-rotating spanwise vortices per cycle (II pattern). The rotation and the inclination of the vibration direction perturb the antisymmetric shape of the pattern generally observed downstream of a rigidly mounted, non-rotating cylinder (e.g. asymmetry in the strength of the positive and negative vortices), but flow structure remains close to the typical 2S pattern in all cases. A number of patterns develop for
 $\unicode[STIX]{x1D6FC}=3$
. Outside the vibration region, where the flow is steady, the wake is composed of two elongated layers of spanwise vorticity of opposite signs and deflected upwards; this pattern was called
 $D^{+}$
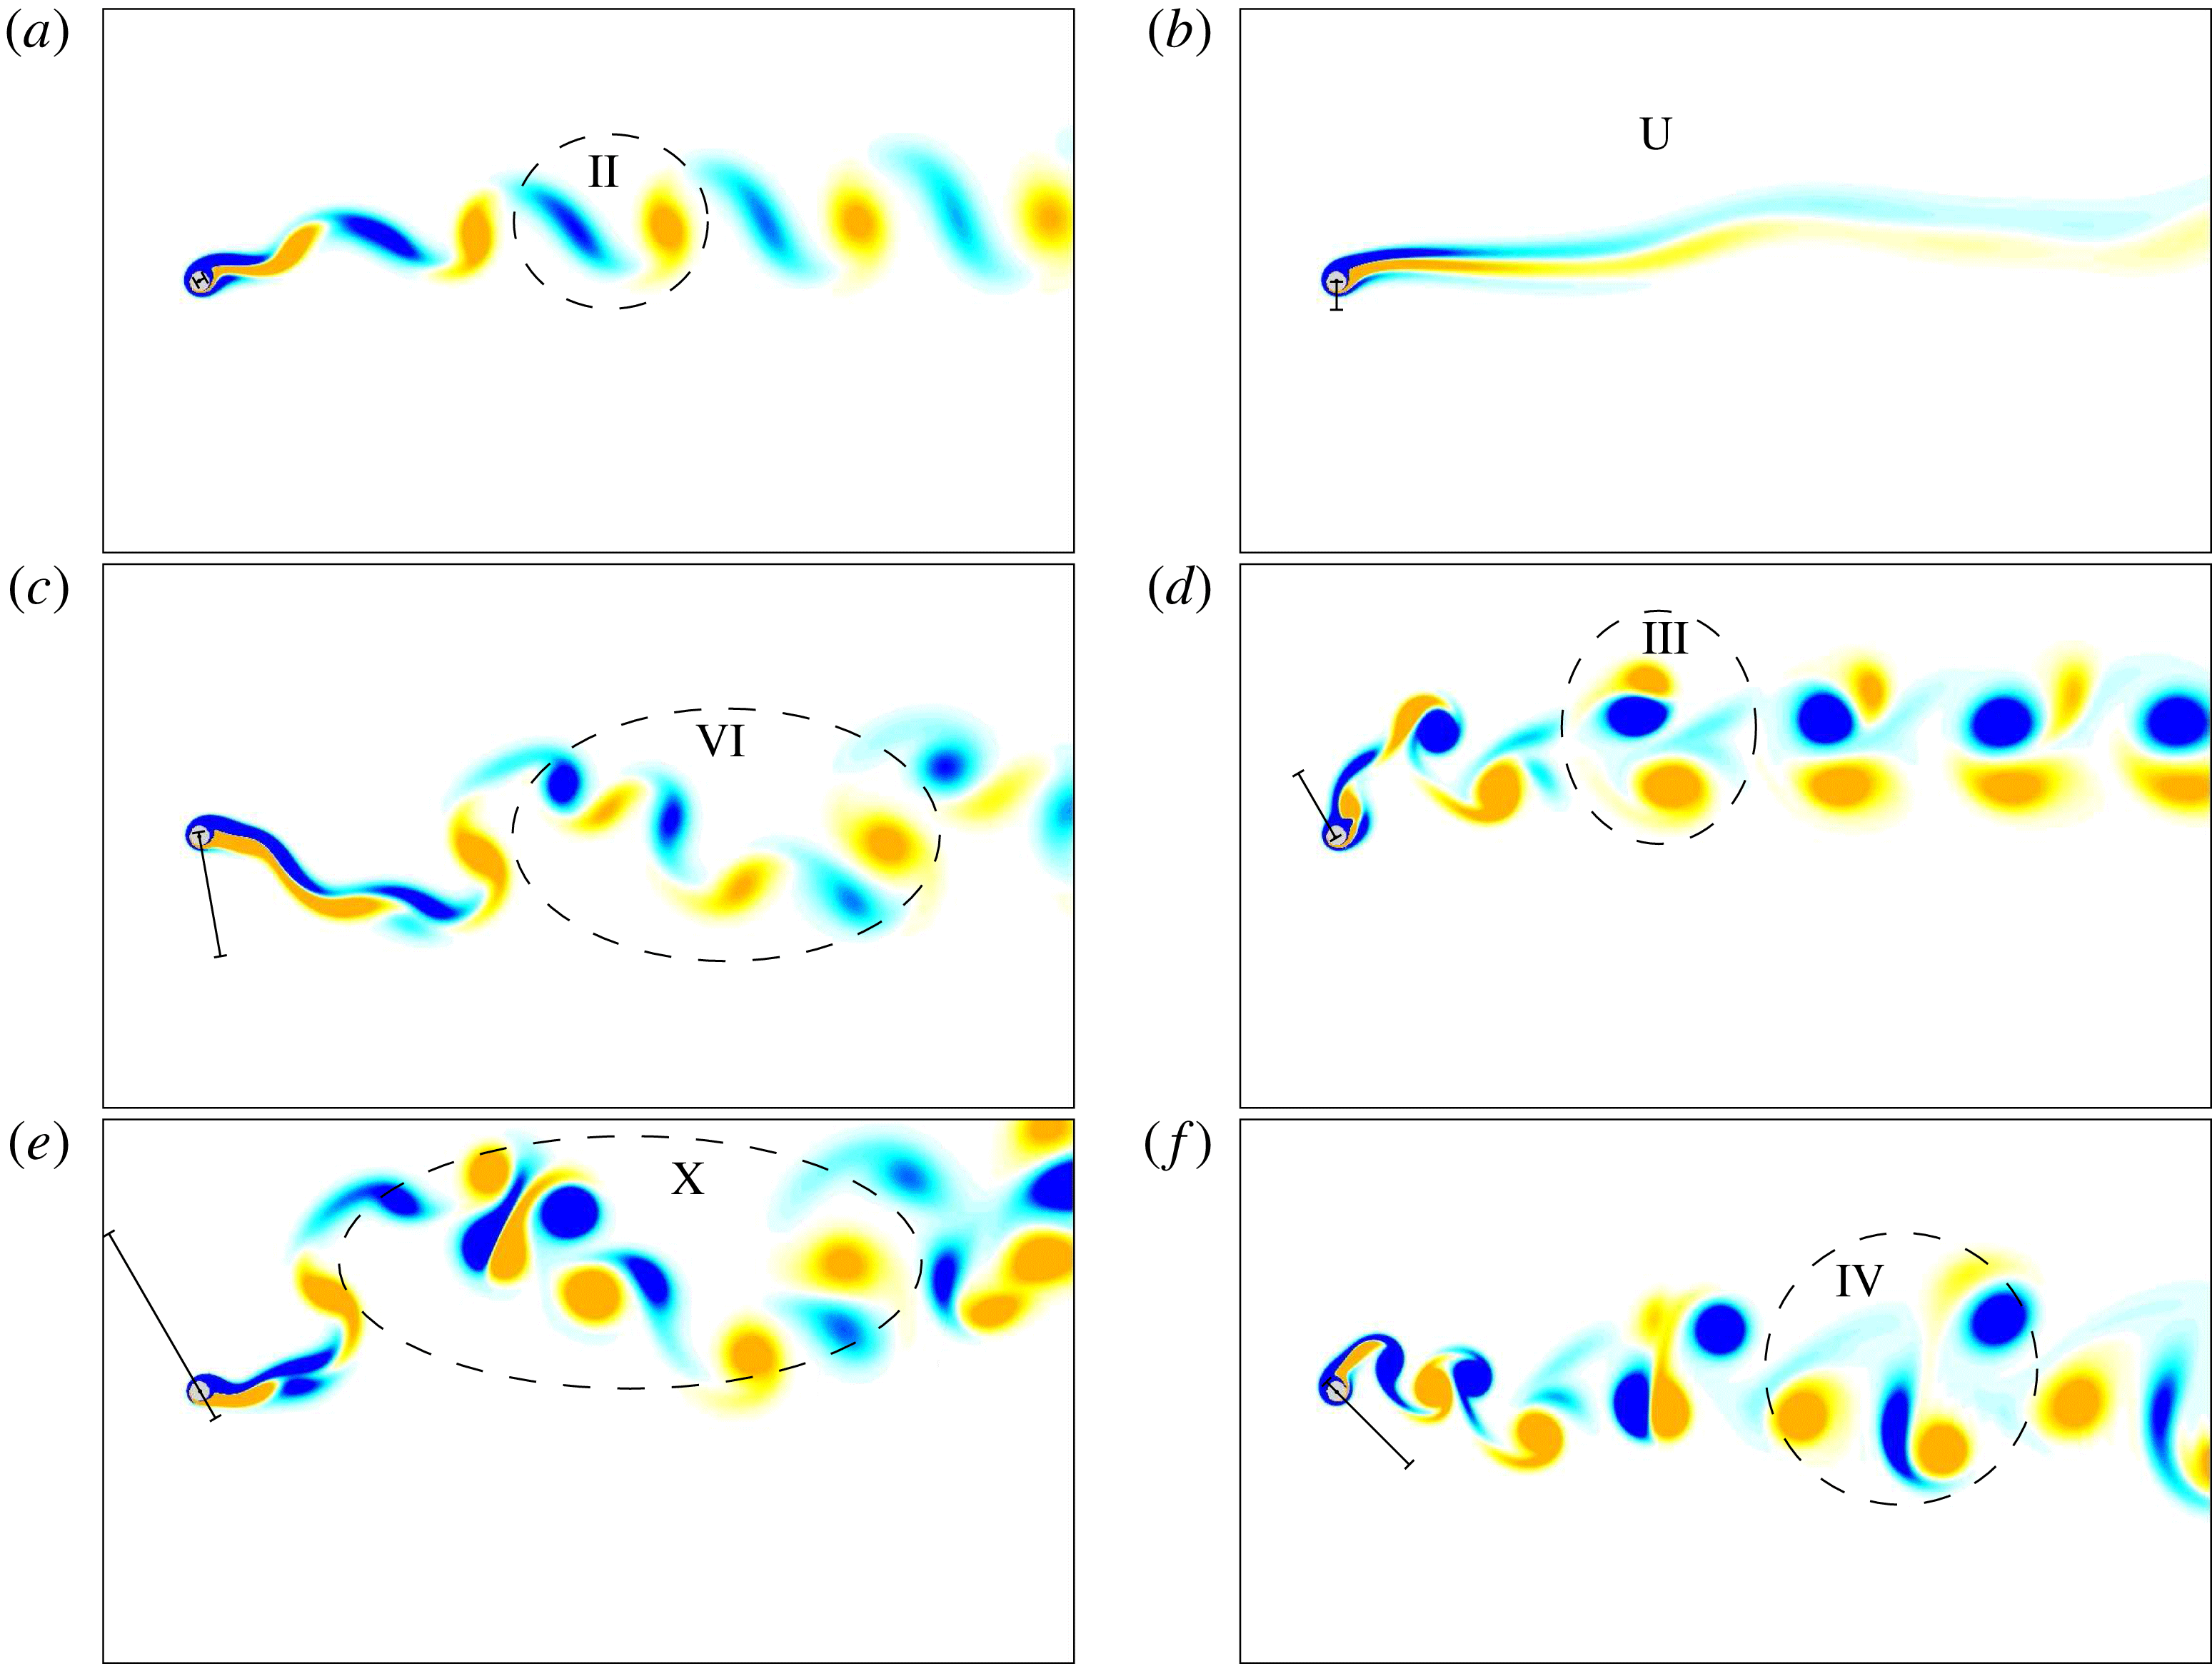
in a previous study (Bourguet & Lo Jacono Reference Bourguet and Lo Jacono2014), in reference to the positive value of the streamwise force (drag), which becomes negative at higher rotation rates. Some of the unsteady patterns emerging within the vibration region are visualised in figure 11 by instantaneous iso-contours of spanwise vorticity. In these plots, a dashed line regroups the vortices formed over one oscillation cycle, the corresponding pattern is mentioned and the trajectory of the cylinder is indicated by a segment. In addition to the patterns characterised by the distinct shedding of individual vortices, the wake of the vibrating, rotating cylinder may also exhibit a transverse undulation of the spanwise vorticity layers, without vortex detachment. This pattern, referred to as the U pattern in the above-mentioned study, is illustrated in figure 11(b).
Instantaneous iso-contours of spanwise vorticity, for
 $\unicode[STIX]{x1D6FC}=3$
: (a) II pattern,
 $(\unicode[STIX]{x1D703},U^{\star })=(30^{\circ },9.5)$
,
 $\unicode[STIX]{x1D714}_{z}\in [-0.2,0.2]$
; (b) U pattern,
 $(\unicode[STIX]{x1D703},U^{\star })=(90^{\circ },25)$
,
 $\unicode[STIX]{x1D714}_{z}\in [-0.15,0.15]$
; (c) VI pattern,
 $(\unicode[STIX]{x1D703},U^{\star })=(100^{\circ },20)$
,
 $\unicode[STIX]{x1D714}_{z}\in [-0.2,0.2]$
; (d) III pattern,
 $(\unicode[STIX]{x1D703},U^{\star })=(120^{\circ },10)$
,
 $\unicode[STIX]{x1D714}_{z}\in [-0.25,0.25]$
; (e) X pattern,
 $(\unicode[STIX]{x1D703},U^{\star })=(120^{\circ },26)$
,
 $\unicode[STIX]{x1D714}_{z}\in [-0.2,0.2]$
; (f) IV pattern,
 $(\unicode[STIX]{x1D703},U^{\star })=(135^{\circ },14)$
,
 $\unicode[STIX]{x1D714}_{z}\in [-0.3,0.3]$
. Positive/negative vorticity values are plotted in yellow/blue. A dashed line denotes the vortices formed over one oscillation cycle. The trajectory of the cylinder is indicated by a segment. Part of the computational domain is shown.
Wake pattern as a function of the vibration angle and reduced velocity, for
 $\unicode[STIX]{x1D6FC}=3$
. The limits of the unsteady flow region, which coincides with the vibration region, are indicated by plain black lines. Black dashed lines delimitate the regions of VIV-like and galloping-like responses. Blue striped areas denote the regions of steep variation of the vibration amplitude as a function of the reduced velocity. Green dashed-dotted lines indicate the regions of two- and three-dimensional unsteady flows; outside the vibration region, the steady flow is two-dimensional. Black dots denote the cases considered in figure 11 while blue circles designate the cases presented in figure 13.

Instantaneous iso-surfaces of spanwise vorticity, for
 $\unicode[STIX]{x1D6FC}=3$
(
 $\unicode[STIX]{x1D714}_{z}=\pm 0.07$
): (a) II pattern,
 $(\unicode[STIX]{x1D703},U^{\star })=(20^{\circ },10)$
; (b) IV pattern,
 $(\unicode[STIX]{x1D703},U^{\star })=(150^{\circ },12)$
; (c) VIII pattern,
 $(\unicode[STIX]{x1D703},U^{\star })=(170^{\circ },28)$
. Positive/negative vorticity values are plotted in yellow/blue. Dashed arrows indicate the vortices shed over one oscillation cycle. The trajectory of the cylinder is indicated by a segment. Part of the computational domain is shown.

A map of the flow patterns occurring for
 $\unicode[STIX]{x1D6FC}=3$
in the
 $(\unicode[STIX]{x1D703},U^{\star })$
domain is presented in figure 12. It should be mentioned that the limits between the different areas of the map are approximate since they have been determined on the basis of two-dimensional simulation results; they may also be subjected to hysteresis phenomena (e.g. Khalak & Williamson Reference Khalak and Williamson1999). In the map, the regions of VIV-like and galloping-like responses are delimited by black dashed lines and the cases visualised in figure 11 are indicated by black dots. In the region of VIV-like responses, the wake exhibits four distinct patterns with a maximum of four vortices shed per cycle (IV pattern). In the galloping-like response region, ten patterns are encountered and up to eleven vortices may form per cycle (XI pattern), over the range of
 $U^{\star }$
investigated. As a general trend, also noted in prior studies (e.g. Williamson & Roshko Reference Williamson and Roshko1988; Bourguet & Lo Jacono Reference Bourguet and Lo Jacono2015), the number of vortices shed per cycle tends to increase as the vibration amplitude increases and the frequency decreases; the X and XI patterns indeed appear around
 $\unicode[STIX]{x1D703}=120^{\circ }$
in the higher range of
 $U^{\star }$
, i.e. in the region of very large (low) amplitudes (frequencies).
For
 $\unicode[STIX]{x1D6FC}=3$
, from
 $\unicode[STIX]{x1D703}=120^{\circ }$
to
 $\unicode[STIX]{x1D703}=170^{\circ }$
approximately, the evolution of the vibration amplitude as a function of
 $U^{\star }$
is characterised by successive steps or undulations (figures 3
c, 4
c). In previous works concerning MIV, this behaviour was connected to the synchronisation between the wake and the moving body, over short windows of
 $U^{\star }$
(e.g. Zhao et al.
Reference Zhao, Leontini, Lo Jacono and Sheridan2014a
). Here, wake-body synchronisation persists over the entire range of
 $U^{\star }$
and these steps cannot be linked to the passage from unsynchronised to synchronised states. In order to locate the regions of transition between each step and try to connect them to flow structures, the gradient of the oscillation amplitude with respect to
 $U^{\star }$
is computed for each vibration angle. The regions where this gradient exceeds an arbitrary threshold are identified by blue striped areas in figure 12 (the regions located at the edge of the vibration region are not indicated). It appears that the regions of large gradient, i.e. steep increase between amplitude plateaus, often coincide with flow pattern transitions. As an example, for
 $\unicode[STIX]{x1D703}=150^{\circ }$
, the vibration amplitude jumps from 2.8 to 4 close to
 $U^{\star }=21$
and then from 4 to 5.2 close to
 $U^{\star }=27$
: these jumps are associated with transitions from patterns VI to VII and from patterns VIII to IX, respectively. The case
 $\unicode[STIX]{x1D703}=0^{\circ }$
, which was studied in Bourguet & Lo Jacono (Reference Bourguet and Lo Jacono2015), falls at the edge of the interval of
 $\unicode[STIX]{x1D703}$
where pronounced undulations of the response curve are encountered; the connection with flow pattern transition could not be clearly established in this prior study. An aspect that would need to be clarified is the reason why the amplitude jumps coincide with transitions from even to odd patterns. The quasi-steady model presented in § 4.2 does not take into account such a connection between flow unsteadiness and body motion, which may explain why the undulations of the galloping-like responses are not captured by this approach (e.g. figure 9
g).
The observations reported in this section highlight the variety of flow patterns that can emerge in the plane perpendicular to the cylinder axis, and also establish some connections between these patterns and the structural responses. The spanwise structure of the flow is addressed in the next section.
5.3 Three-dimensional transition
The forced rotation applied to the cylinder has a direct influence on the flow three-dimensional transition scenario. As shown in previous studies concerning rigidly mounted cylinders, the rotation may substantially reduce the value of the Reynolds number at which the transition occurs (Pralits et al.
Reference Pralits, Giannetti and Brandt2013; Rao et al.
Reference Rao, Leontini, Thompson and Hourigan2013); in this case, the flow becomes three-dimensional at
 $Re=100$
above a rotation rate close to 3.7. Adding an oscillation to the imposed rotation of the body may further modify the transition scenario: while a cross-flow vibration tends to delay the transition, an in-line oscillation enhances it (Bourguet & Lo Jacono Reference Bourguet and Lo Jacono2014, Reference Bourguet and Lo Jacono2015). Specifically, at
 $Re=100$
and for
 $\unicode[STIX]{x1D6FC}=3$
, prior results have shown that the flow past a cylinder subjected to transverse oscillations (
 $\unicode[STIX]{x1D703}=90^{\circ }$
) is two-dimensional, but becomes three-dimensional in the case of streamwise responses (
 $\unicode[STIX]{x1D703}=0^{\circ }$
). Therefore, at this rotation rate, the transition is expected to occur as the vibration angle is varied. The differences reported in the structural responses (figure 4
c,f) and fluid forces (figure 5
c,f) issued from the two- and three-dimensional simulations confirm this point. It is, however, recalled that these differences remain small and that the three-dimensional transition has only a limited influence on the system behaviour. From the flow–structure interaction point of view, the occurrence of the three-dimensional transition is not a central phenomenon in the present configuration; that is why it is only briefly addressed here.
Three-dimensional simulations show that the flow is two-dimensional for
 $\unicode[STIX]{x1D6FC}\in \{0,1\}$
. For
 $\unicode[STIX]{x1D6FC}=3$
, the flow past the vibrating body is found to be two-dimensional between critical values of
 $\unicode[STIX]{x1D703}$
close to
 $25^{\circ }$
and slightly larger than
 $140^{\circ }$
, and three-dimensional outside this interval. The boundaries between two- and three-dimensional flows are indicated by green dashed-dotted lines in the map of figure 12; the flow is two-dimensional out of the vibration region. These boundaries are based on a limited number of three-dimensional simulations and are thus approximate.
The flow three-dimensional transition is visualized in figure 13, for three points of the parameter space indicated by blue circles in figure 12. The instantaneous iso-surfaces of spanwise vorticity reveal regular spanwise undulations around the cylinder and in the near region. These undulations tend to vanish further in the wake where the spanwise vortex rows are mainly two-dimensional. As also noted in a previous study concerning in-line vibrations (Bourguet & Lo Jacono Reference Bourguet and Lo Jacono2015), different spanwise wavelengths can spontaneously emerge at the onset of three-dimensionality. They range from 1 to 1.7 body diameters approximately, but no monotonic variation has been identified in the parameter space or as a function of the vibration amplitude or frequency. From a linear stability perspective, such phenomenon suggests a possible competition between different unstable modes; this aspect could be the object of a dedicated analysis. For comparison, in the rigidly mounted body case, the spanwise wavelength observed when the flow past the rotating cylinder becomes three-dimensional at
 $Re=100$
(
 $\unicode[STIX]{x1D6FC}\approx 3.7$
) is 1.7 diameters approximately (Bourguet & Lo Jacono Reference Bourguet and Lo Jacono2014) while in the absence of rotation, the transition occurs at
 $Re\approx 190$
with a critical wavelength close to 4 diameters (Williamson Reference Williamson1996).
The three-dimensional transition induces a slight spanwise modulation of the flow structures described in the
 $(x,y)$
plane in § 5.2. In figure 13 where the spanwise vortices shed over one oscillation cycle are numbered, the II, IV and VIII patterns can still be clearly recognized. The
 $(x,y)$
patterns of the three-dimensional flows match those reported in the map presented in figure 12 on the basis of two-dimensional simulation results.
6 Conclusion
The flow-induced vibrations of an elastically mounted circular cylinder, free to oscillate in an arbitrary direction and forced to rotate about its axis, have been explored at a Reynolds number equal to 100, on the basis of two- and three-dimensional simulation results. To bridge the gap between the contrasted trends reported in previous works where the rotating body was allowed to move either in the in-line or in the cross-flow direction, the behaviour of the flow–structure system has been examined over the entire range of vibration angles and a wide range of reduced velocities. Three values of the rotation rate were considered in order to cover the reference non-rotating cylinder case (
 $\unicode[STIX]{x1D6FC}=0$
), a slow rotation case (
 $\unicode[STIX]{x1D6FC}=1$
) for which only VIV-like responses had been observed in prior studies and a fast rotation case (
 $\unicode[STIX]{x1D6FC}=3$
), for which both VIV- and galloping-like regimes had been identified. The principal findings of this work can be summarised as follows.
No rotation. In the absence of rotation, regardless of the vibration angle, the structural responses develop under wake-body synchronization, or lock-in, and their amplitude exhibits a bell-shaped evolution, typical of VIV, as a function of
 $U^{\star }$
. When the vibration angle is increased from
 $0^{\circ }$
to
 $90^{\circ }$
(or decreased from
 $180^{\circ }$
to
 $90^{\circ }$
), the bell-shaped curve tends to monotonically increase in width and magnitude. For all vibration angles, the flow past the non-rotating cylinder is two-dimensional and characterised by the shedding of two counter-rotating spanwise vortices per cycle (II pattern).
Slow rotation. The slow rotation applied to the cylinder (
 $\unicode[STIX]{x1D6FC}=1$
) results in a limited augmentation of the structural response amplitudes and widening of the vibration windows. It also causes a subtle asymmetry of the responses and forces about
 $\unicode[STIX]{x1D703}=90^{\circ }$
, i.e. the case of vibration angle
 $\unicode[STIX]{x1D703}\in [90^{\circ },180^{\circ }]$
may slightly depart from the case
 $180^{\circ }-\unicode[STIX]{x1D703}$
. However, the behaviour of the system remains globally the same as for
 $\unicode[STIX]{x1D6FC}=0$
: the vibrations present similar VIV-like shapes, the lock-in condition is established and the principal flow features (two-dimensional flow, II pattern) are comparable.
Fast rotation. The impact of the forced rotation is much more dramatic for the higher value of the rotation rate (
 $\unicode[STIX]{x1D6FC}=3$
), since the system undergoes a transition of its vibration regime as
 $\unicode[STIX]{x1D703}$
is varied; a continuous vision of this transition has been presented. VIV-like responses occurring under the lock-in condition persist over a range of vibration angles, between critical angles located close to
 $10^{\circ }{-}20^{\circ }$
and
 $90^{\circ }{-}100^{\circ }$
. Outside this interval, the cylinder is subjected to galloping-like oscillations which are characterised by amplitudes growing unboundedly with
 $U^{\star }$
. Within the region of galloping-like responses, a considerable variability is observed in the shape of the vibration amplitude curve (quasi-linear versus undulating evolutions) and in the amplitude growth rate. Amplitudes approximately twice larger than those reported in a prior study concerning in-line responses (
 $\unicode[STIX]{x1D703}=0^{\circ }$
) are reached. The associated enhancement of the mean in-line force may counterbalance the reduction induced by the imposed rotation.
A quasi-steady modelling of fluid forcing is found to predict the emergence of galloping-like responses. It provides a rough estimate of the range of
 $\unicode[STIX]{x1D703}$
where this vibration regime may appear and reasonably captures the growth of the oscillation amplitude as a function of
 $U^{\star }$
. These observations suggest that the galloping-like responses could be mainly driven by the mean flow and its evolution as the body moves. Flow unsteadiness and body motion remain synchronised in the galloping-like response region. The present results indicate that, even if it is not the driving mechanism, the interaction with flow unsteadiness cannot be neglected. Assuming such decoupling may lead to an erroneous prediction of regime transition as a function of
 $\unicode[STIX]{x1D703}$
; for example, the galloping-like oscillations occurring for
 $\unicode[STIX]{x1D703}=0^{\circ }$
are not predicted by the quasi-steady approach.
A variety of wake patterns are encountered at this higher rotation rate, with up to eleven spanwise vortices shed per oscillation cycle in the galloping-like response region, over the range of
 $U^{\star }$
investigated. The successive steps appearing in the evolution of the galloping-like vibration amplitude versus
 $U^{\star }$
seem connected to wake pattern switch; such a connection is not captured by the quasi-steady approach and the undulations of the response curve are not predicted. The flow past the vibrating cylinder is found to become three-dimensional over an interval of
 $\unicode[STIX]{x1D703}$
including the in-line oscillation case (
 $\unicode[STIX]{x1D703}=0^{\circ }$
). It is, however, shown that, in the present context, the three-dimensional transition has only a limited influence on the system behaviour.
Acknowledgements
This work was performed using HPC resources from CALMIP (Grants 2017-P1248 and 2018-P1248).



