Introduction
The use of fertilizer is necessary to improve the yield and the quality of the crops in areas where soil nutrients are limiting. In Spain over 2.5×10⁶ t of nitrogen fertilizers are used on agricultural land (ANFFE, Reference Anffe ANF de2015). The use of fertilizers must be optimized, to meet not only the requirements of the crop, but avoid any unnecessary financial expense for the farmer, high production costs and any harmful effect on the environment through misuse. The appropriate management of fertilizers, as with all agricultural inputs, requires optimization of the doses applied without reduction in crop productivity. A good first step towards the optimization of fertilization is through obtaining adequate knowledge of the actual crop uptake across different areas of agricultural fields.
Determining the nitrogen uptake in different crops has been the objective of numerous studies (Lemaire, Reference Lemaire2012). In these studies it was shown that the concentration of nitrogen in the plant (%N) is diluted as it grows. Thus, there is a direct relationship between %N and biomass. The critical N concentration (Nc) is the %N which facilitates optimal crop growth. Below his critical N concentration, crop growth is limited and above this concentration there is no further affect on crop growth with increasing %N concentration. Knowledge of the Nc-biomass ratio for each crop determination of the ideal nitrogen uptake (Nuptake) by the crop during its growth. In wheat, this relationship has been proposed based on studies done in the north of France (Justes et al., Reference Justes, Mary, Meynard, Machet and Thelier-Huches1994). However, it is unknown if this relationship is applicable in other parts of the world with different conditions (climate, soil, varieties or agronomic management). If this relationship is validated it could be used to determine the optimum Nuptake by the crop in any point in its cycle. For the use of this relationship it is key the knowledge of the crop biomass. Traditionally this is obtained by manual collection of samples that are subsequently dried and finally weighed. All these processes make this methodology expensive and not applicable in operational scenarios. For this reason, the optimum nitrogen uptake of a crop is often predicted as a function of the phenological phase of the crop.
Remote sensing (RS) is a unique tool to monitor the growth and development of crops in the different parts of the field. This information is provided for large extensions of land, in real time and at a reduced cost. The use of this technology increases the efficiency of agronomic management, enabling inputs and timing of application to be optimized. An example of this is the use of RS for the determination of water requirements of different crops (Calera et al., Reference Calera, González-Piqueras and Melia2004; Campos et al., Reference Campos, Neale, Calera, Balbontin and González-Piqueras2010; Glenn et al., Reference Glenn, Neale, Hunsaker and Nagler2011; González-Dugo et al., Reference González-Dugo, Escuin, Cano, Cifuentes, Padilla and Tirado2013). RS has also been used as a measurement of biomass through crop growth models, based on the efficiency of water or light use (Campos et al., Reference Campos, Gonzalez, Villodre, Calera, Campoy and Jiménez2017). If the Nc-biomass relations are correct they could be used to determine Nuptake maps throughout crop development. These maps are necessary for the application of fertilizer using variable rate technology (VRT). VRT varies fertilizer application rates according to the needs of the crop at the time of application at designated GPS locations.
A part of RS, yield monitors, electrical conductivity maps and aerial images from drones have all been used to map the spatial variability within field. But RS offers a number of advantages over these methods: RS technology is regularly maintained, monitored and evaluated by expert personnel; the technology can be used anywhere in the world; the spatial resolution is suitable for fields larger than 1 hectare; the images can be obtained at a temporal frequency of less than a week if different satellites are used. This frequency facilitates crop monitoring throughout the entire crop growth cycle; the images can be obtained shortly after satellite overpass, thus providing close to real-time information; the cost of the images is reduced; historical temporal patterns in crop growth can indicate relationships between soil fertility, agronomic management and crop productivity.
The objectives of this work were to evaluate the use of classical Nc-biomass relationship for the assessment of wheat Nuptake and the derivation of Nuptake maps throughout the cropping cycle. These maps were also used as a guide for VRT applications, providing nitrogen fertilizer prescription maps for designated GPS points and application times.
Material
This work was developed in 8 commercial fields used for trials located in Albacete, Southeast of Spain, where the climate is Mediterranean. The mean annual precipitation for the last thirty years was 340 mm and the mean annual temperature was 13.6°C for the same period. The rain periods coincide with the Autumn and the beginning of the Spring.
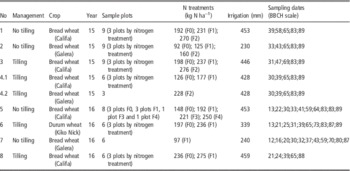
The mean size of the fields was 40 ha and were planted with spring wheat during the growing seasons of 2015 and 2016, from January to June. Most of the fields were planted with bread wheat (var. Califa and Galera) and only one field was planted with durum wheat (var. Kiko nick), see Table 1. All fields were irrigated using central pivot systems. The irrigation frequency varied from weekly to daily application during May and June and the irrigation dose was 10 l/m2. The total irrigation applied varied from 230 to 460 mm, see Table 1. The fertilizer was applied in 4 to 5 split portions. Application dates coincided with the time of seeding, solid NPK composite application dates, from three leaves to the beginning of tillering, when solid urea was applied, during stem elongation, or fertigation. The 4th and 5th applications corresponded to the flowering and heading phases, to increase the protein content in the grain.
Characteristics of the fields monitored: Management, crop and variety, season monitored, sample plots, fertilizer applied per treatment, irrigation applied and sampling dates.

During the analyzed growing seasons, three treatments of variable nitrogen fertilization were implemented in each monitored field. The treatment F1 application consisted of the dose rate commonly applied by the farmer (see table 1). The treatment F2 was applied during the 2015 growing season, and consisted of applying about 40 units extra of nitrogen in a band with 100 m in width crossing the field. The treatment F0 was applied during the 2015 and 2016 growing seasons, this treatment consists in applying about 40 units less of nitrogen in a band with 100 m in width crossing the field. In addition, another 2 treatments were applied in field 5 during the 2016 growing season, two areas of about 10×10 m were fertilized with about 30 and 60 extra units of nitrogen, these treatments are named F3 and F4 respectively.
Samples of total aboveground biomass were collected at 3 measurement locations in each zone with different nitrogen dose (9-6 locations per field and year). The samples were collected on 5 to 10 dates during the growing cycle (see Table 1). Each sample consisted of 3 sub-samples collected manually from the aboveground biomass, taken from 2 rows along 1.5 m and dried in an oven for 48 hours at 60°C. The same samples were used for the determination of the N content by the dumas method. The biomass of the grain (yield) was measured on the last measurement date. Each of the sample locations were situated in homogeneous zones with a minimum area of 1 ha. The homogeneous areas were delimited based on the maps of potential productiviy maps (Gonzalez et al., Reference Gonzalez, Calera, Villodre, Bodas, Campos and Calera2015).
Methods
An estimation of the optimum N uptake was based on the Nc-Biomass curves described in the introduction (Justes et al., 1997, Reference Justes, Mary, Meynard, Machet and Thelier-Huches1994). These curves relate to nitrogen concentration and total aboveground biomass for optimum management (Ec. 1). The Nuptake for any given period can be estimated if the evolution the biomass is known (Ec. 2). For the determination of the temporal evolution of crop biomass we propose the use of a diagnostic model based on RS data as presented in the next section. In addition, the Nc-Biomass relationships were developed in different environments for particular varieties, so the application of these relationship in the study area must be analyzed and discussed.
 $$Nc\,{\equals}\,5.35\,{\rm {\asterisk}}\,W^{{{\minus}0.442}} $$
 $$N_{{uptake}} \,{\equals}\,N_{C} \,{\asterisk}\,W$$
Biomass production model based on remote sensing data
The methodology used in this work for the assessment of biomass production is the incorporation of the reflectance based basal crop coefficient into the AQUACROP module for biomass production. In this approach, biomass is estimated as the product of a normalized water productivity (WP*, in g·m−2) (Steduto et al., Reference Steduto, Hsiao and Fereres2007) times the sum of the ratio between adjusted crop transpiration (Tc,adj) over ETo. The ratio of Tc,adj over ETo is equivalent to the adjusted transpiration coefficient (Kt,adj). The term Kt,adj can be estimated as the product of water stress (Ksw) times the crop transpiration coefficient (Kt). The coefficient Kt is the ratio of crop transpiration to atmospheric demand under non-limiting moisture conditions. In absence of stresses or limitations, biomass production is proportional to the numerical integration of Kt over the time. The approach proposed in AQUACROP considers that the efficiency in producing biomass is dynamic and could change during the growing cycle because of factors related with the meteorological conditions and crop physiology and management. These factors can be represented by a variety of stress coefficients. Explicitly, the AQUACROP methodology considers the water stress and the temperature stress coefficients, Ksw, Kst. These stresses were calculated in this work for the adequate assessment of biomass production.
The temporal evolution of Kt used in this study was based on satellite derived vegetation indices (VI). The time series of satellite images offers a unique way for the continuous estimation across space and time of Kt. The temporal evolution of the VI used in the study (normalized difference vegetation index, NDVI) was based on the platforms Deimos-1, Landsat 7, Sentinel 2A and Landsat 8. The image processing included the normalization of the NDVI values (Chen et al., Reference Chen, Vierling and Deering2005) in order to ensure the compatibility between the different sensors (Martínez‐Beltrán et al., Reference MartínezBeltrán, Jochum, Calera and Meliá2009). For additional information about the biomass production model the reader is referred to Campos et al. (Reference Campos, Gonzalez, Villodre, Calera, Campoy and Jiménez2017).
Selection of the homogeneous zones for biomass sampling
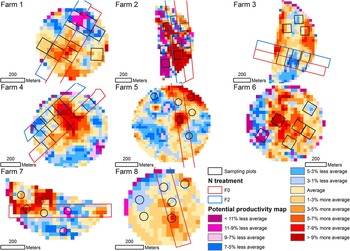
The selection of homogeneous areas was based on the estimation of biomass production for precedent crops (Gonzalez et al., Reference Gonzalez, Calera, Villodre, Bodas, Campos and Calera2015). The hypothesis behind this approach was that the continuous difference in canopy development in some areas responds to differences in the soil fertility (structural deficiencies, mineral nutrition and water retention properties), considering that the management (irrigation and fertilization) has been traditionally homogeneous. This map delimiting the areas is defined as potential productivity map (PPM). The value of each pixel in the PPM for each field represents the ratio between the corresponding value over the average at plot scale, allowing us to compare maps for different crops during and between seasons, Figure 1. Similar crops, with similar growth and development are the best candidates for the calculation of the PPM in each field.
Sampling plots (black polygon) and PPM from the different commercial fields used for trials. The red band is N treatment F0 and the blue band is N treatment F2. Treatment in the rest of commercial field is F1.

Results
Evaluation of the relationship between N concentration and biomass
The proposed methodology is strongly based on the determination of the optimum Nc-Biomass relationship already proposed in the literature. Nevertheless, these curves are usually defined and validated for specific cultivars and environments, quite different from the Mediterranean conditions analyzed in this work. Thus, in a first step we evaluate the agreement of the experimental data obtained in our study area with the noted relationships.
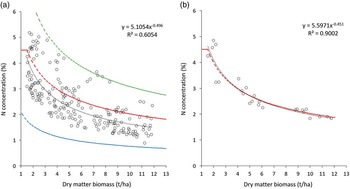
The relationship between N concentration (%) and crop biomass (t/ha) for every field, measurement zone and treatment is shown in the Figure 2a. The growing period was limited from 1.5 to 12 t/ha or flowering. According with these results, the N concentration for most of the measurement locations were within the ranges proposed by Justes et al. (Reference Justes, Mary, Meynard, Machet and Thelier-Huches1994) for wheat. However, the mean relationship obtained for the whole dataset was lower than the relationship proposed by these authors, see Figure 2a and Equation 1. There are two possible reasons explaining the dispersion around the mean line: most of the treatments in bread wheat had deficiencies in the nitrogen content, and the dataset also include durum wheat, with higher nitrogen absorption and higher fertilization rates. The Figure 2b shows a selection of the fields planted with bread wheat and with high production (over 8000 kg/ha) and fertilization rates (200 a 260 kg N ha−1). For these fields, the dispersion around the mean line was very low and the mean relationships between Nc and Biomass was close to the values proposed by Justes et al. (Reference Justes, Mary, Meynard, Machet and Thelier-Huches1994). According with the results, this Nc-Biomass relationship can be considered valid for the assessment of the optimum (critical) N concentration in the study area and this relationship was used for the estimation of optimum N absorption along the growing cycle.
a) Correlation between nitrogen (N) concentration and biomass along the growing cycle for the fields analyzed in this work. The dotted lines represent the maximum (upper line), critical (middle line) and minimum (lower line) values of N concentration for wheat according with Justes et al. (Reference Justes, Mary, Meynard, Machet and Thelier-Huches1994). The solid line represent the relationship obtained for the experimental data. b) selection of the experimental data for the plots with optimum management and productions.

Maps of N uptake during the growing cycle
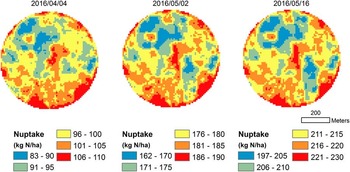
The maps of N uptake along the growing season were estimated using the dilution curves already discussed and the maps of biomass production. The maps were computed for each application of fertilizer and were the key for the determination of the optimum dose at each date. The doses were determined at each point in the field using a balance of N in the soil. The inputs of the balance were the maps N uptake and ancillary information about the soil properties. The result was the temporal evolution of fertilizer requirements, adapted to the format required by the VRT machinery. The Figure 3 represents an example of the Nuptake calculated at three dates during 2016 in filed 5.
Temporal evolution of the optimum nitrogen absorption (Nuptake) in the field number 5 in three selected dates during 2016.

Further analysis will be necessary for the assessment of the accuracy of the proposed methodology in representing the actual crop Nuptake. In addition, it is fair to say that the proposed approach is limited to a concrete period of the crop growth. The relationships between N concentration and crop biomass was considered valid for a range between 1.5 to 12 t/ha. Beyond this range the critical N concentration could vary with respect to the predicted values. In general terms, some of the N applications previously were below the noted lower limit. From seeding and before the wheat reach the limit of 1.5 t/ha of biomass, the total N application could be up to 50% of the total N applied. During this period, the total biomass is lower than the 10% of the final values and the preciseness of the estimates of biomass based on the proposed model was low. These period occurs for NDVI values lower than 0.7 for irrigated wheat in the study area. During this period, the estimation of Nuptake can be based on the maps of potential productivity obtained for precedent crops. After this phase, and for biomass values lower than 12 t/ha, the proposed methodology can be applied for the optimization of the fertilization and to correct possible deficiencies. The precision of the biomass model increases with the accumulation of images and biomass and the Nuptake can be anticipated because the evolution of the NDVI describe smooth and continuous functions that can be extrapolated.
In addition, the proposed methodology can be complementary to diagnosis approaches to the actual Nc. The actual value of Nc can be used to estimate the actual Nuptake using the biomass production model and the estimates based on the model actualized. An interesting approach to the actual Nc is the use of hyperspectral indices such as those based on the Red-edge bands available for some satellites such as Sentinel 2A. This approach will enable production maps provide maps of the actual Nc, providing an unique method for the optimization of nitrogen fertilization in precision agriculture. For additional information about the use of indices to determine the actual crop nitrogen uptake the reader is referred to González-Piqueras et al., (Reference González-Piqueras, López, Sánchez, Villodre, Bodas and Campos2017).
Conclusions
The decision support systems based on Remote Sensing data and agronomic and management information can be used to define optimum fertilization amounts, increasing the efficiency in use of N. The maps obtained provide valuable information for the implementation of variable rate strategies, adapting the fertilizers to the actual crop requirements and increasing management efficiency.
The methodology based on RS data can be used to determine the optimum N uptake, spatially distributed and for several phenological stages or time periods. This approach is based on the accumulation of biomass and critical dilution curves. In addition, diagnostic approaches such as nitrogen related indices derived from red-edge images will provide a valuable tool for the validation and cross-calibration of the proposed methodology.
Acknowledgements
This research was developed in the framework of the projects FATIMA (FArming Tools for external nutrient Inputs and water MAnagement), funded by the European Union’s Horizon 2020 research and innovation programme (Grant Agreement N° 633945).
This work was not possible without the effort of the people who took and processed the samples in the field. Maria Calera, Nuria Jimenez, Jaime Campoy, Carmen Plaza, Elena Pareja, Francisco Miguel Jara, Pablo Avilés, Iñaki Narro, Fernando Alonso, Belén Quirós and Hermógenes Alcaraz. Many thanks to all for your fantastic work.