I. INTRODUCTION
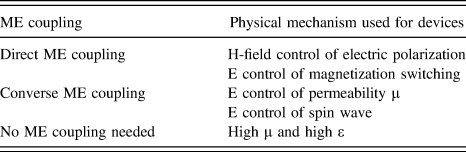
Both single-phase multiferroic materials and composites, which have two or more of the ferroic properties (ferroelectricity, ferromagnetism, and ferroelasticity), provide great interest and numbers of multiferroic devicesReference Eerenstein, Mathur and Scott1–Reference Ma, Hu, Li and Nan8 using different magnetoelectric (ME) couplings. Multiferroic composites have ME coupling coefficients several orders of magnitude higher than those of single phase multiferroics, which provide effective energy conversion between electric and magnetic fields.Reference Lou, Liu, Reed, Ren and Sun9–Reference Liu, Zhou, Nan, Howe, Brown and Sun14 Table I shows the categorized multiferroic devices based on the control mechanisms.Reference Lin, Gao, Wang, Nan, Liu, Lou, Yang, Zhou, Yang, Wu, Li, Hu and Sun15 Direct ME coupling (magnetic field control of electrical polarization) can be used in energy harvesters, magnetometers, etc.Reference Dong, Li and Viehland16–Reference Onuta, Wang, Long and Takeuchi20 Converse ME coupling (E-field control of magnetization switching) has been used in spintronics, ME random access memory, and othersReference Chu, Martin, Holcomb, Gajek, Han, He, Balke, Yang, Lee, Hu and Zhan21–Reference Nan, Zhou, Lou, Liu, Yang, Gao, Rand and Sun26 Converse ME coupling (E-field control of the magnetic permeability and spin waves) can be used in voltage tunable inductors, tunable bandpass filters, tunable phase shifters, etc.,Reference Lou, Reed, Liu and Sun27–Reference Liu, Obi, Lou, Stoute, Cai, Ziemer and Sun50 High permittivity and high permeability multiferroic materials with high permeability and high permittivity provide great opportunities for miniature antennas or other RF/microwave devices.Reference Yang, Obi and Sun51–Reference Yang, Daigle, Liu, Obi, Stoute, Naishadham and Sun56 Finally, the combination of direct and converse ME coupling are required to realize ME antennas used for both receiving and transmitting behaviors.Reference Nan, Lin, Gao, Matyushov, Yu, Chen, Sun, Wei, Wang, Li, Wang, Belkessam, Guo, Chen, Zhou, Qian, Hui, Rinaldi, McConney, Howe, Hu, Jones, Brown and Sun57
Classification of magnetoelctric coupling.

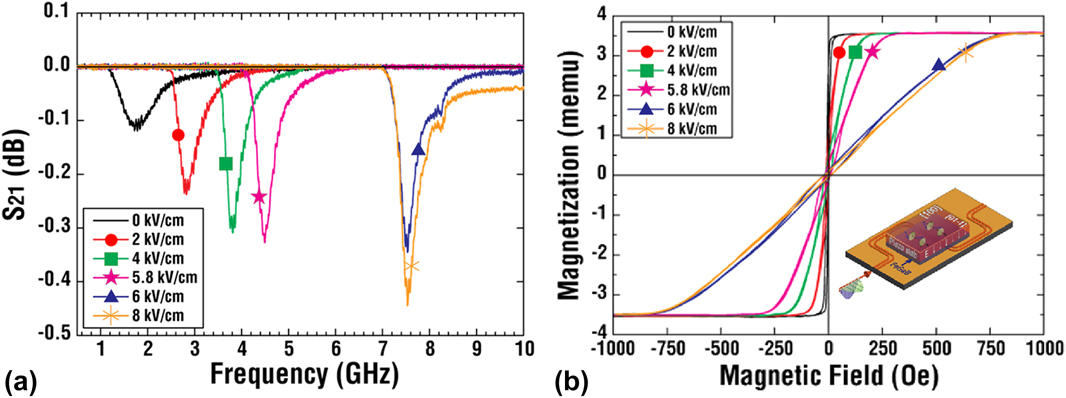
Achieving strong ME coupling in multiferroic heterostructures becomes more important to achieve large tunability in multiferroic devices in which the performance is mainly dependent on the multiferroic materials.Reference Lim, Rajan and Jin58 Significant progress has been made in multiferroic heterostructures to support the ME coupling concept such as a huge ferromagnetic resonance frequency voltage tunability from 1.75 to 7.57 GHz in a FeGaB/PZN-PT (Pb(Zn1/3Nb2/3)O3–PbTiO3) heterostructure.
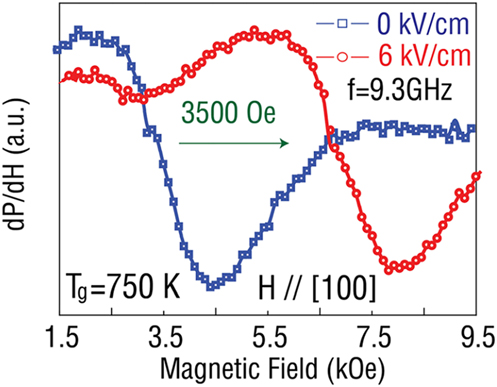
Figure 1(a) shows electrical tuning of transmission coefficients S 21 in the FeGaB/PZN-PT heterostructure by sweeping the frequency with a network analyzer. The peak of the curve shows the absorption when increasing the voltage, representing the electric field dependence of FMR frequency with 5.82 GHz tunable FMR frequency range. Notice that in the PZN-PT single crystal, the rhombohedral phase transition to the tetragonal phase causes the huge jump of the resonant frequency change between 5.8 and 6 kV/cm electric field. The minimal frequency change above 6 kV/cm electric fields was consistent with the strain-electric field relation of the PZN-PT single crystal.Reference Lou, Liu, Reed, Ren and Sun9 A positive H eff along the in-plane  $\left[ {0\bar{1}1} \right]$ direction was produced from the induced tensile strain in PZN-PT (011) and the positive magnetostriction of FeGaB. With the applied magnetic field along the [100] direction, the E-field dependence of magnetic hysteresis loops is shown in Fig. 1(b).Reference Lou, Liu, Reed, Ren and Sun9 A huge change in saturation magnetization from up to 700 Oe with the applied electric field is due to the E-field induced compressive strain along [100] direction and the huge positive magnetostriction, resulting in a negative H eff along this direction. In Fig. 2, the largest E-field-induced H eff of 3500 Oe was achieved in the Terfenol-D/PZN-PT (011) structure due to the enormous magnetostriction constant in the magnetic phase.Reference Liu, Li, Zhou, Beguhn, Lou, Xu, Lu and Sun59 The giant tunable magnetic anisotropy of multiferroic heterostructures provides great opportunities for reconfigurable microwave multiferroic devices with ultra-low power.
(a) Electric field dependence of the transmission coefficient (S 21) spectra of the FeGaB/PZN-PT multiferroic heterostructure measured by using the network analyzer and (b) magnetic hysteresis loops of the FeGaB/PZN-PT multiferroic heterostructure under different external electric fields measured by VSM.

FMR spectra of polycrystalline Terfenol-D/PZN-PT at E = 0 kV/cm (blue) and E = 6 kV/cm (red).

II. INTEGRATED VOLTAGE AND MAGNETIC TUNABLE RF/MICROWAVE MAGNETIC DEVICES
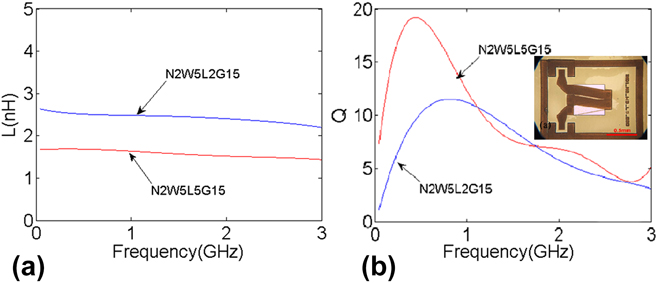
GaoReference Gao, Zardareh, Yang, Nan, Zhou, Onabajo, Liu, Aronow, Mahalingam, Howe and Brown60 demonstrated the integrated magnetic inductors based on a solenoid multilayer FeGaB/Al2O3 film structure with a high-quality factor (Q). Comparing with a single FeGaB layer, multilayer FeGaB/Al2O3 film with the same total thickness provides less eddy-current loss, lower out of plane anisotropy, and higher permeability. The inductors show nearly constant and flat inductance with a high-quality factor at 0.5–2.5 GHz, which provides key performance for RFIC applications. Figures 3(a) and 3(b) show the inductance and quality factor frequency dependence with two different magnetic film lengths (200 and 500 μm). While increasing the length, with the same turns and the same gap between the two neighboring windings, the inductance decreases from 2.5 to 1.7 nH; however, the quality factor’s trend is opposite. The increased length results in wider windings, providing lower resistance loss and higher-quality factor (Fig. 4).
Comparison between different lengths of the FeGaB/Al2O3 film (200 μm and 500 μm): (a) Inductance and (b) quality Factor.

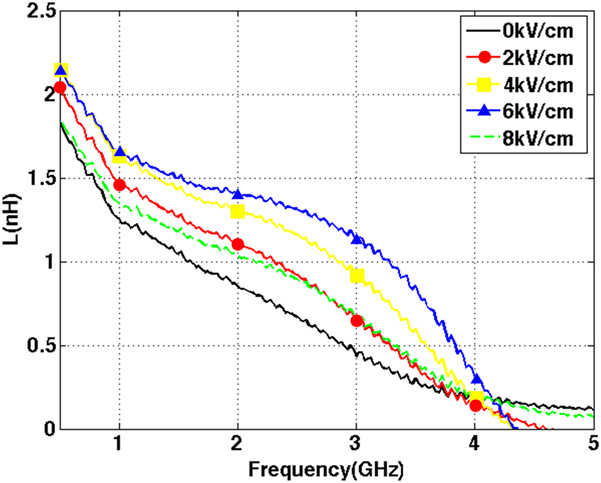
High tunability of inductance which reaches up to 150% in about 2–3.5 GHz.

To remove the Si substrate on the back side, deep reactive-ion etching (DRIE) was applied. The etched inductors were bonded to a 0.5 mm-thick PMN-PT piezoelectric slab with the ethyl cyanoacrylate glue.Reference Gao, Zare, Onabajo, Li, Zhou, Nan, Yang, Liu, Mahalingam, Howe and Jones61 Up to 150% large inductance tunability from 2 to 4 GHz was achieved with the applied E-field from 0 to 8 kV/cm across the PMN-PT slab as shown in Fig. 6. The E-field induced H eff is perpendicular to anisotropy field causing induced changes of the permeability of the FeGaB/Al2O3 film.
The first integrated RF devices that combine the performance of a dual H- and E-field tunable bandpass filters and an ultra-wide bandwidth isolator are presented.Reference Lin, Wu, Yang, Hu, Nan, Emori, Gao, Guo, Wang and Sun62 A thickness of ∼2 micrometers NiZn ferrite film is deposited via the spin sprayed process which is a low-temperature, low cost, and fast deposition method. Assuming the bias applied magnetic field is in-plane and perpendicular to the magnetostatic surface wave, the NiZn ferrite film was rotated by a certain angle and the reflection will propagate parallel to the bias field, which is operating in the stopband of magnetostatic back volume wave to diminish the splitting modes and the standing-wave resonances. The nonreciprocity characteristic is achieved from the limited surface wave on the bottom surface due to the nonreflection edges.
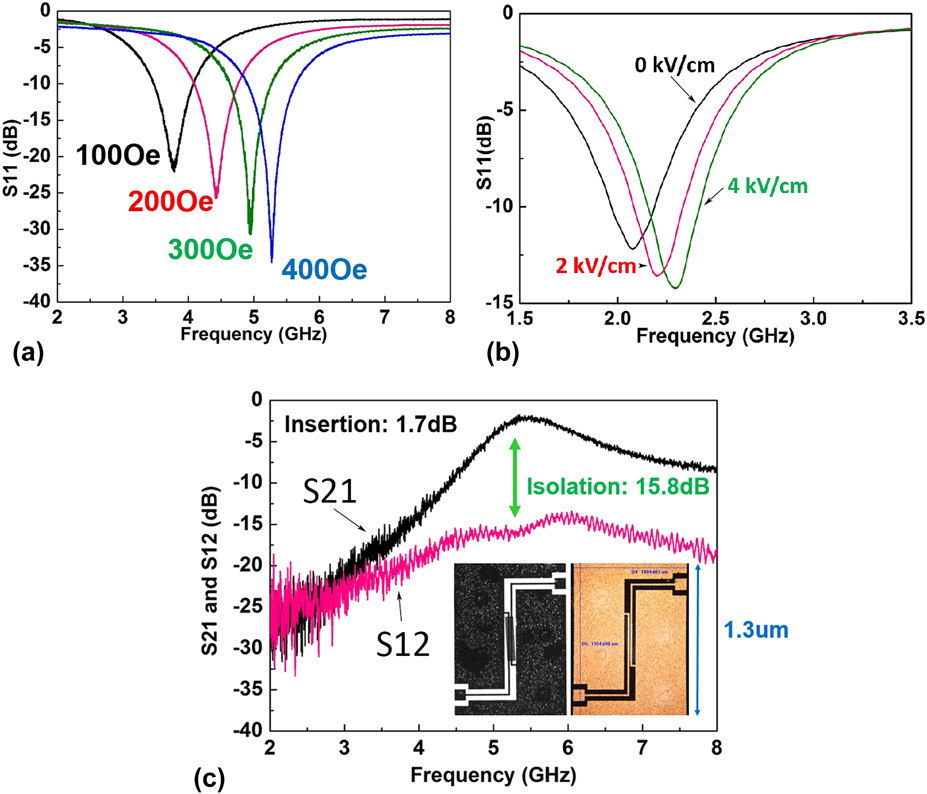
Figure 5 shows the S-parameter measurements of the rotating NiZn ferrite resonator bandpass filter under DC magnetic field (i) and DC electric field (ii). DC magnetic field tunability of the resonant frequency can be achieved following the Kittel’s equation. Isolation over 13 dB isolation was achieved between two transmission directions showing nonreciprocal performance (iii) with the tunable range from 3.78 to 5.27 GHz. Frequency tunability of 500 MHz/100 Oe is achieved under external in-plane magnetic fields from 100 to 400 Oe, with an insertion loss of 1.73–3.42 dB. The reflection coefficients S 11 and S 22 are similar, which are less than 20 dB, which indicates that the energy is mostly dissipated in the NiZn ferrite film, instead of reflecting back from the ports. To remove the Si substrate on the back side, DRIE was applied. The etched bandpass filters were bonded to a 0.5 mm-thick PMN-PT piezoelectric slab with the ethyl cyanoacrylate glue. By applying the electric field on the PMN-PT, the central frequency can be tuned from 2.075 to 2.295 GHz. Voltage tunability of 55 MHz/1 (kV/cm) is achieved.
Measured S-parameters of bandpass filter: (a) S 11 with H-field tuning, (b) S 11 with E-field tuning, and (c) S 12 and S 22 under 400 DC magnetic field showing 15.8 dB isolation. The inset shows the optical images.

Miniaturized RF tunable bandpass filters based on ME NEMS coupled thin-film bulk acoustic resonators with contour mode transmission are presented with very high-quality factor and dual E- and H-field tunability.Reference Lin, Nan, Qian, Gao, Hui, Wang, Guo, Belkessam, Shi, Rinaldi and Sun63 The acoustic wave is coupled with the electromagnetic (EM) wave due to the strong ME effect between the piezomagnetic multilayer FeGaB/Al2O3 films and piezoelectric AlN thin film on the resonant body. Excited in fundamental, thickness mode, the resonance frequency of coupled resonators and the transmission are contributed from the in-plane mode determined by the width of the resonator. The NEMS ME bandpass filter was fabricated using a five-mask microfabrication process. The piezomagnetic multilayer FeGaB/Al2O3 films were deposited for lower eddy-current loss, lower out of plane anisotropy, and higher permeability.
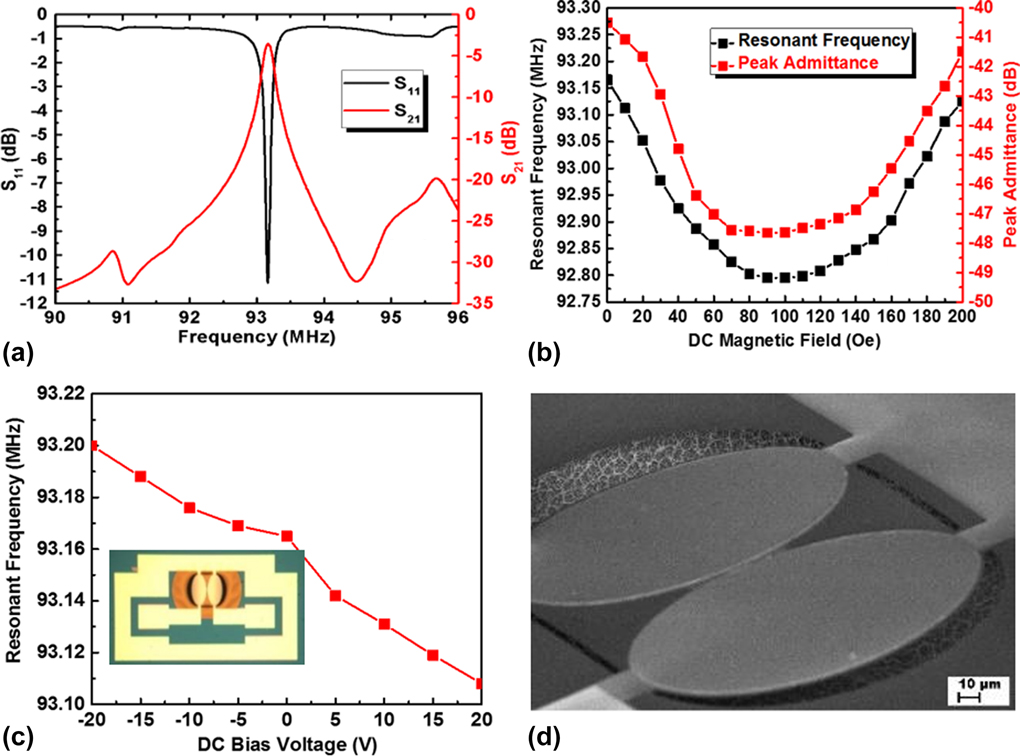
At zero bias field, −11.15 dB reflection coefficient and 3.57 dB insertion loss with high quality factor of 252 can be achieved at 93.165 MHz, as shown in Fig. 6(a). The bandpass filters can perform ∼0.5% magnetic field tunability of the operation frequency. Frequency tunability of ∼50 kHz/10 Oe is achieved in Fig. 6(b). The resonance frequency change was due to the bias magnetic field induced Young’s modulus change (delta-E effect) in FeGaB. The delta-E effect is determined by the total anisotropy including the shape anisotropy, the induced anisotropy, and the magnetoelastic anisotropy, which determine the change of Young’s modulus reached the maximum value with ∼95 Oe applied magnetic field. Figure 6(c) shows the voltage tunability of 2.3 kHz/1 V. The small change of the frequency due to ME coupling is relatively small compared with the delta-E effect. The 70 ppm magnetostriction coefficient of FeGaB is much smaller than the delta-E effect changes up to 20–30% in Young’s modulus of magnetostrictive soft magnetic films. Figure 6(d) is the scanning electron microscopy (SEM) image with the silicon substrate released by XeF2 isotropic etching to maximum resonance.
(a) Measured return loss S 11 and insertion loss S 21 at zero bias field, (b) resonance frequency as a function of DC magnetic fields, (c) resonance frequency as a function of DC electric fields. The inset is the optical image and (d) SEM image of the coupled resonators with silicon substrate released.

III. INTEGRATED NANOMECHANICAL ME SENSORS AND ANTENNAS
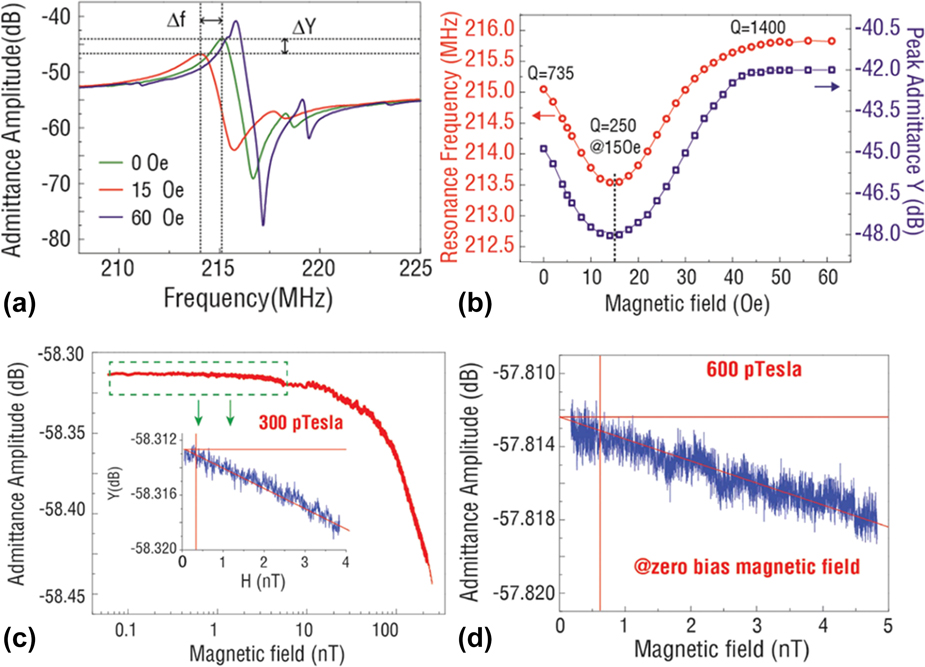
Magnetic control of electrical polarization in magnetic/piezoelectric ME heterostructures have been recently demonstrated in ME magnetometers.Reference Dong, Cheng, Li and Viehland64–Reference Nguyen, Bouillault, Daniel and Mininger86 When the AC excitation magnetic field frequency is the same as electromechanical resonance, the ME sensors present enhanced ME coefficients (one to two orders of magnitude) and sensitivity. However, an AC magnetic field results in additional sources of noise, larger size, and increased power consumption, and a small DC bias magnetic field is required to maximize the ME coupling coefficient. NanReference Nan, Hui, Rinaldi and Sun87 demonstrated an ME sensor based on the (FeGaB/Al2O3) multilayers nanoplate resonator (NPR) at 215 MHz with self-biased performance due to the exchange bias which has been introduced in IrMn/FeCoSiB/AlN heterostructures recently. The resonance frequency change was due to the bias magnetic field induced Young’s modulus change (delta-E effect) in FeGaB. The sensitivity of the Young’s modulus change could be observed from the admittance curve versus the frequency at different DC bias magnetic fields applied along the anchor direction of the resonator showing an electromechanical resonance frequency of 215 MHz at zero bias in Fig. 7(a). Both resonance frequency and peak admittance amplitude exhibited a similar trend with DC bias magnetic field shown in Fig. 7(b), reaching minimum values at 15 Oe bias field, and then increasing until the FeGaB/Al2O3 multilayer saturated at 50–60 Oe. Q is enhanced with high magnetic field, due to the elimination of magnetic domain walls and decrease of magnetic losses. The quality factor following the same trend as the Young’s modulus indicates that it is strongly related to the magnetic anisotropy and magnetic domain wall.
(a) Admittance curve of the NEMS sensor at various bias DC magnetic fields, (b) resonance frequency and admittance amplitude at the resonance frequency as a function of DC magnetic field, and (c) sensitivity and linearity of the DC magnetic field sensor with DC bias magnetic field of 5 Oe. The inset shows the zoomed-in part ranging from 50 pT to 4 nT in a magnetically unshielded environment and (d) sensitivity and linearity of the DC magnetic field sensor at zero bias magnetic field in a magnetically unshielded environment.

A small 5 Oe DC magnetic field was superimposed to get the best sensitivity. This was used to set to reach the maximum slope from the curve of electromechanical resonance frequency versus magnetic field. A small DC magnetic field from 50 pT to 4 nT is shown in the inset of Fig. 7(c). The admittance amplitude starts to scatter at 300 pT, indicating that the detection starts from ∼300 pT. Furthermore, 600 pT of the limit of detection is measured under self-bias condition shown in Fig. 7(d) which is comparable to 300 pT. This self-biased RF NEMS ME sensor is compact, power efficient, and provides the integration to CMOS technology. This represents a novel ultra-sensitive magnetometer for DC or low-frequency AC magnetic fields.
Antennas using electric currents for EM wave radiation are important components in smart phones, tablets, radio frequency identification systems, radars, and more. A key challenge of conventional antennas is the size miniaturizationReference Kramer, Chen, Lee and Volakis88–Reference Mosallaei and Sarabandi93 which relies on the EM wavelength. The challenge of antenna miniaturization results limitation on achieving compact antennas and antenna arrays at the very-high frequency (VHF, 30–300 MHz) and ultra-high frequency (UHF, 0.3–3 GHz). New antenna concepts need to be investigated with new mechanisms to further reduce antenna size. Multiferroics research society has been studied in ME antenna for more than 5 years.Reference Yao and Wang94–Reference Domann and Carman98
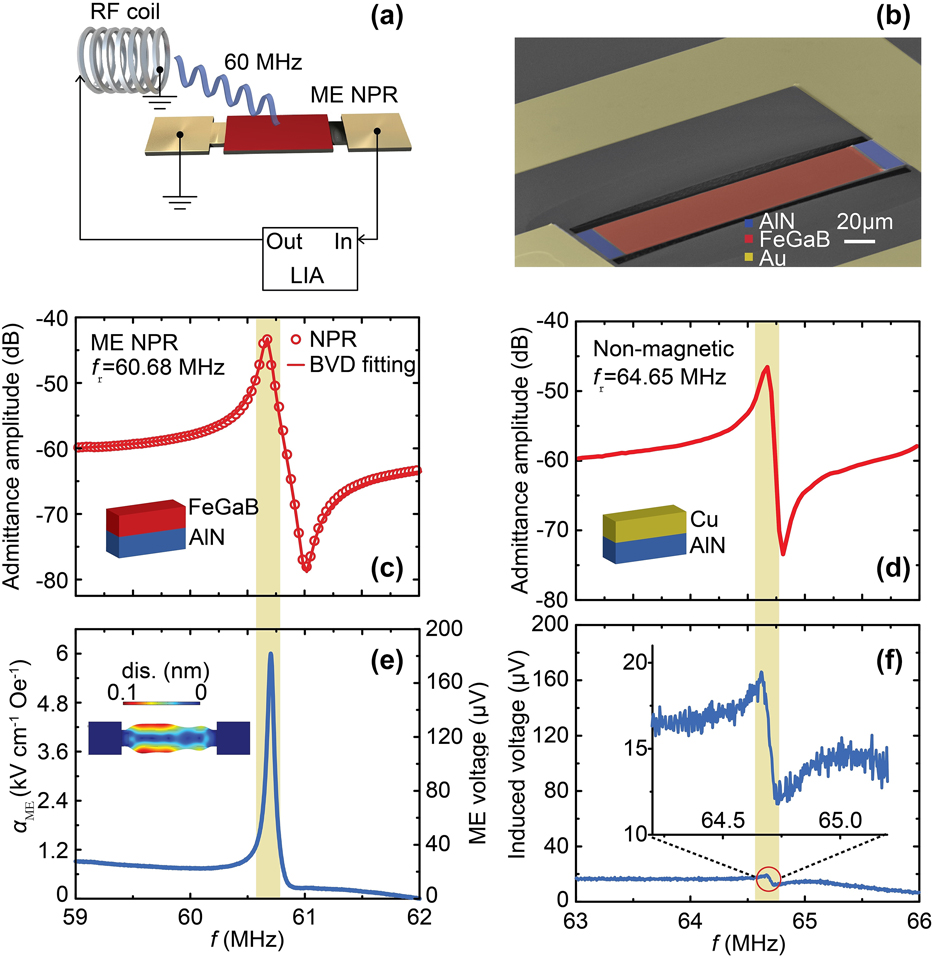
An acoustically actuated NEMS ME antennas with new receiving and transmitting mechanism is presented here.Reference Nan, Lin, Gao, Matyushov, Yu, Chen, Sun, Wei, Wang, Li, Wang, Belkessam, Guo, Chen, Zhou, Qian, Hui, Rinaldi, McConney, Howe, Hu, Jones, Brown and Sun57 The dynamic strong ME coupling in ME heterostructures could induce the RF magnetic currents for EM wave radiation. The ME antennas can provide a wide frequency range from tens of MHz to tens of GHz by the geometric design of resonators which exhibit in-plane and out-of-plane vibration modes. A ME NPR with an in-plane contour mode, where the resonant frequency is defined by the width of the resonator, demonstrates the strong ME coupling at VH frequencies. Figure 8(a) shows the measurement schematic and the structure of ME NPR with a FeGaB/AlN heterostructure. Figure 8(b) shows the SEM image of the NPR ME resonator. The ME NPR is fully released from the Si substrate to minimize the substrate clamping effect. In Fig. 8(c), the admittance can be fitted into the Butterworth–van Dyke model and shows the electromechanical coupling coefficient (kt 2) of 1.35% and a high-quality factor of 930. As a comparison, a nonmagnetic NPR using Cu was tested as a control sample for comparison to confirm that the voltage output was contributed from the strain-mediated ME coupling under the H RF excitation. The nonmagnetic NPR has a similar admittance trend behavior as the ME NPR, as shown in Fig. 8(d). By using a lock-in amplifier, the induced voltage output was measured under the RF coil excitation of 60 nT H RF, as shown in Fig. 8(e). A large voltage peak of 180 μV is induced at 60.7 MHz which is sensitive to the excitation frequency. Figure 8(f) shows the two orders of magnitude smaller induced voltage of the Cu/AlN NPR under the same H RF excitation comparing to the induced voltage in ME NPR. The weak inductive coupling between the ground loop with the EM wave, which also exists in the ME NPR device, contributed the antisymmetric line shape.
(a) Schematic illustration of the ME NPR and the induced ME voltage measurement setup, (b) SEM image of the fabricated ME NPR, and (c) admittance curve and Butterworth–van Dyke model fitting of the ME NPR. The inset shows the simulated in-plane displacement of the nanoplate at resonance peak position excited by H RF, (d) admittance curve of the nonmagnetic Cu/AlN control NPR, (e) ME coupling coefficient (left axis) and the induced ME voltage (right axis) versus the frequency of H RF excitation, and (f) induced voltage versus the frequency of H RF excitation for the nonmagnetic device. The inset illustrates the zoomed-in view of the resonance peak area (red circle).

We further fabricated ME antennas operating at the GHz range based on the thin-film bulk acoustic wave resonators (FBAR), where the resonant frequency is defined by the resonator thickness (out-of-plane resonant mode) rather than the width. The transmission performance of the ME antennas was tested in an anechoic chamber under a far-field configuration. The mechanical resonance can induce a dynamic strain acoustic wave that can be directly transferred to the upper ferromagnetic thin film by applying an RF electric field. The acoustic wave would then induce a dynamic change of the magnetization due to the strong piezomagnetic constant and generate magnetic currents for radiation. Reciprocally, the RF magnetic field component of the EM wave can be detected by the ferromagnetic layer and induce an acoustic wave on that layer. When this acoustic wave transfers to the piezoelectric thin-film, the dynamic voltage/charge would be generated due to the direct piezoelectric coupling. The acoustic wavelength is about 5 orders shorter than the EM wavelength at the same frequency. Therefore, since the ME antennas are operating at the acoustic resonant frequency instead of EM wave resonant frequency, the antennas can become hundreds to thousands of times smaller. Furthermore, while this new mechanism involves the coupling between EM wave and acoustic wave, the additional mechanical resonance can resolve the impedance mismatching from conventional small antennas at low frequency.
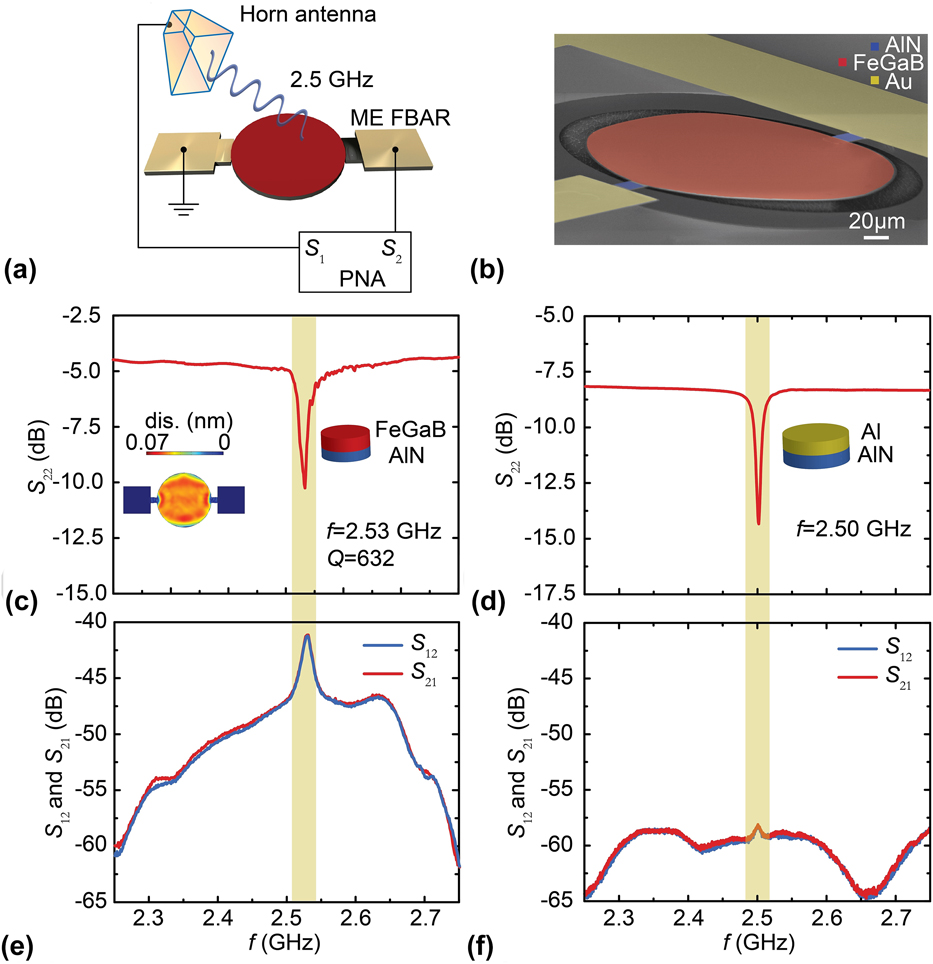
Figure 9(a) shows the schematic of the antenna gain measurements, including a calibrated linear polarization standard horn antenna and an ME antenna connected to the network analyzer. Figure 9(b) shows the SEM image of the FBAR ME resonator. The ME resonator is also fully released from the Si substrate to maximize the resonance. The resonance frequency is measured to be 2.53 GHz by the reflection coefficient (S 22), as shown in Fig. 9(c) with a peak return loss of 10.26 dB. In Fig. 9(d), a nonmagnetic control device using Al was also measured under the same configuration and the same resonance frequency near 2.5 GHz. The control device exhibits a similar S 22 as ME antenna, which indicates that the similar power is transferred into both antennas; In Fig. 9(e), the transmitting and receiving behaviors of the ME antennas correspond to S 12 and S 21, respectively. The antenna gain is measured and calculated through the gain comparison method to be −18 dBi at resonance. However, in Fig. 9(f), no clear resonance peak can be observed in the control antenna measurements which is ∼20 dB lower than the performance of ME antenna. Similar to the Cu/AlN NPR control device shown in Fig. 8(f), we can suggest that the ME coupling effect dominates the performance of the antenna transmission. Both NPR and FBAR are using the same five-mask microfabrication process on the same chip, which can be connected to a CMOS oscillator circuit and provide the realization of reconfigurable ME antenna array covered from tens of MHz to tens of GHz.
(a) Schematic illustration of the ME thin-film bulk acoustic wave resonators (FBAR) and the antenna measurement setup, (b) SEM image of the fabricated ME FBAR, (c) return loss (S 22) of ME FBAR. The inset shows the simulated out-of-plane displacement of the circular disk at resonance peak position, (d) Return loss (S 22) curve of the nonmagnetic Al/AlN control FBAR, (e) transmitting and receiving behavior (S 12 and S 21) of ME FBAR, and (f) transmitting and receiving behavior (S 12 and S 21) of the nonmagnetic Al/AlN control FBAR.

IV. CONCLUSION
Multiferroic composite materials and devices with two or more of the ferroic properties have attracted interest due to the demonstrated unique functionalities and ME coupling performance which is several orders of magnitude higher than single phase multiferroics. Progress has been made to demonstrate giant voltage control of the ferromagnetic resonance frequency in the composite structures. Different integrated multiferroic devices have been introduced including novel integrated magnetic tunable inductors, integrated nonreciprocal bandpass filter with dual H- and E-field tunability, dual H- and E-field tunable RF bandpass filters with nanomechanical ME resonators, and novel RF nanomechanical ME resonators with pico-Tesla sensitivity for DC magnetic fields. Additionally, ME magnetometers based on control of electrical polarization with magnetic fields have demonstrated enhanced ME coefficients that have improved sensitivity with a matching AC excitation magnetic field and electromechanical resonance. These integrated RF/microwave devices are compact, lightweight, power efficient, and provide great opportunities for new reconfigurable RF/microwave applications for spintronics, and magnetic field sensing. Advancements in multiferroic composite materials will depend on achieving strong ME coupling for devices in which the performance is dependent on the material.
The future in antenna miniaturization has also been demonstrated by ME antennas, which has been a key obstacle for conventional antennas due to the EM wavelength. The strong ME coupling induces RF magnetic currents to radiate EM waves at a wide range of frequencies allowing for acoustically actuated ME antennas with receiving and transmitting capabilities on the nanoscale. The operating frequencies span from several MHz to tens of GHz, which are controlled by the calculated geometric design of the resonators with in-plane or out-of-plane vibrational modes. VH frequencies have been demonstrated with a ME NPR design with an in-plane contour mode of vibration where the resonator width controls the resonance frequency. Future designs will focus on impedance matching and geometry optimization of ME antenna arrays to achieve higher gain for increased communication reliability. With the advantages of high magnetic field sensitivity in near field and the highest antenna gain within all nanoscale antennas, the ME antenna with one to two orders reduced size and ground plane immunity from metallic surfaces or the human body has a promising future for bio-implantable, wearable antennas, internet of things, and other numerous applications.
ACKNOWLEDGMENTS
This work was supported by DARPA through award D15PC00009, the W.M. Keck Foundation, the NSF TANMS ERC Award 1160504, and in part by the AFRL through contract FA8650-14-C-5706. Microfabrication was performed in the George J. Kostas Nanoscale Technology and Manufacturing Research Center.