1. Introduction
The southern Aegean is characterized by two orogenic domains which formed during progressive nappe stacking during Eocene to Miocene time following the closure of the Pindos Ocean (e.g. Altherr et al. Reference Altherr, Kreuzer, Wendt, Lenz, Wagner, Keller, Harre and Höhndorf1982; Seidel, Kreuzer & Harre, Reference Seidel, Kreuzer and Harre1982): (1) the Cretan nappe pile, where rocks of the External Hellenides prevail; and (2) the Attico-Cycladic Complex, where rocks of the Internal Hellenides are exposed. Many studies focusing on the tectonometamorphic evolution of the southern Aegean region suggest that the structurally highest rocks of the Cretan nappe pile and the Attico-Cycladic Complex belong to the same unit, referred to as the Uppermost Unit (e.g. Bonneau, Reference Bonneau1972; Seidel et al. Reference Seidel, Okrusch, Kreuzer, Raschka and Harre1976; Dürr et al. Reference Dürr, Seidel, Kreuzer and Harre1978). This unit is considered as part of the upper plate of the post-Eocene subduction system, which caused the main pulse of the Alpine orogenesis in the Hellenides (Bonneau, Reference Bonneau, Dixon and Robertson1984). Although it is broadly accepted that the Uppermost Unit escaped post-Eocene high-pressure metamorphism (e.g. Altherr et al. Reference Altherr, Kreuzer, Lenz, Wendt, Harre and Dürr1994; Thomson, Stöckhert & Brix, Reference Thomson, Stöckhert, Brix, Ring, Brandon, Lister and Willett1999), its pre-Eocene tectonometamorphic evolution is not fully understood. In the Cyclades this is mainly due to the limited exposures of the unit, which occur as klippen on top of the Cycladic Blueschist Unit. On the other hand, extensive outcrops of the Uppermost Unit are present in central and eastern Crete. Crete is therefore a key area for understanding the tectonometamorphic evolution of the Uppermost Unit and the evolution of the upper plate at the early stages of the Alpine subduction system.
On Crete, the Uppermost Unit has been subdivided into several subunits differing in their lithology and in the grade and timing of metamorphism (e.g. Bonneau, Reference Bonneau1972; Krahl, Herbart & Katzenberger, Reference Krahl, Herbart and Katzenberger1982; Tortorici et al. Reference Tortorici, Catalano, Cirrincione and Tortorici2012). Amphibolite facies metamorphic rocks, intruded by Late Cretaceous granitoids (Kneuker et al. Reference Kneuker, Dörr, Petschick and Zulauf2015; Martha et al. Reference Martha, Dörr, Gerdes, Petschick, Schastok, Xypolias and Zulauf2016, Reference Martha, Dörr, Gerdes, Krahl, Linckens and Zulauf2017), are referred to as the Asterousia Crystalline Complex (ACC; Bonneau, Reference Bonneau1972), which is usually correlated with the southern margin of the Pelagonian domain and therefore with the Internal Hellenides (e.g. Aubouin & Dercourt, Reference Aubouin and Dercourt1965; Bonneau, Reference Bonneau1972; Martha et al. Reference Martha, Dörr, Gerdes, Krahl, Linckens and Zulauf2017). Other tectonometamorphic nappes ascribed to the Uppermost Unit include the prehnite-pumpellyite facies Arvi Unit, which is interpreted as a Maastrichtian seamount at the northern margin of the Pindos realm (Palamakumbura, Robertson & Dixon, Reference Palamakumbura, Robertson and Dixon2013), and the Greenschist Unit, consisting of fine-grained epidote-amphibole schist with a mid-ocean ridge basalt (MORB) -type signature (Reinecke et al. Reference Reinecke, Altherr, Hartung, Hatzipanagiotou, Kreuzer, Harre, Klein, Keller, Geenen and Böger1982; Martha et al. Reference Martha, Dörr, Gerdes, Krahl, Linckens and Zulauf2017). The provenance, tectonostratigraphy and metamorphic evolution of the Uppermost Unit and its subunits are only poorly understood and far from consensus, however. Moreover, recent studies have shown that the Uppermost Unit has faced polyphase metamorphism and deformation during Late Cretaceous and Paleocene time (Tortorici et al. Reference Tortorici, Catalano, Cirrincione and Tortorici2012; Martha et al. Reference Martha, Dörr, Gerdes, Krahl, Linckens and Zulauf2017). Understanding the tectonometamorphic evolution of the Uppermost Unit is therefore confronted with unravelling its polymetamorphic history.
In the present study, we have investigated rocks of the Uppermost Unit south of the Dikti Mountains in the area of Pefkos, Kalami and Sykologos (Viannos Municipality, eastern Crete). We present: (1) a new geological map of the study area; (2) kinematic and microfabric data from the different subunits of the Uppermost Unit; (3) pressure–temperature (P–T) constraints for the formation of greenschist and chiastolite hornfels; and (4) U–Pb zircon age data, which reflect the age of contact metamorphism of a non-exposed pluton. The new results, combined with published radiometric ages, give insights into the Late Cretaceous to Paleocene tectonometamorphic evolution of the Uppermost Unit. The new data will be compared with those obtained from Anafi and from other localities of Crete.
2. Geological setting
2.a. The Uppermost Unit of the Cretan nappe pile
In the study area south of the Dikti Mountains (Fig. 1), the Tripolitsa, Pindos and Uppermost units of the Cretan nappe pile are exposed (Creutzburg & Papastamatiou, Reference Creutzburg and Papastamatiou1969; Creutzburg et al. Reference Creutzburg, Drooger, Meulenkamp, Papastamiatou, Seidel and Tataris1977; Vidakis, Reference Vidakis1993; Bonneau & Vidakis, Reference Bonneau and Vidakis2002). The Triassic to Oligocene shallow-water carbonates and flysch sediments of the Tripolitsa Unit are ascribed to the lower nappe system of the Cretan nappe pile that was affected by late Oligocene to early Miocene subduction-related metamorphism (Seidel, Kreuzer & Harre, Reference Seidel, Kreuzer and Harre1982; Feldhoff, Lücke & Richter, Reference Feldhoff, Lücke and Richter1991; Rahl et al. Reference Rahl, Anderson, Brandon and Fassoulas2005; Klein, Craddock & Zulauf, Reference Klein, Craddock and Zulauf2013). The non-metamorphic Jurassic to Eocene deep-water sediments of the Pindos Unit and the low- to high-grade metamorphic rocks of the variegated Uppermost Unit belong to the upper Cretan nappe system. Fission-track data revealed that the upper Cretan nappe system should have been situated at brittle crustal levels since at least latest Eocene or earliest Oligocene time (Thomson, Stöckhert & Brix, Reference Thomson, Stöckhert, Brix, Ring, Brandon, Lister and Willett1999), thus escaping Oligocene to Miocene tectonometamorphic ductile events that have affected the lower nappe system.
Geological map of Crete (modified after Creutzburg & Seidel, Reference Creutzburg and Seidel1975; Martha et al. Reference Martha, Dörr, Gerdes, Krahl, Linckens and Zulauf2017). Exposures of the Asterousia Crystalline Complex on Crete: a, west of Melambes; b, between Kamares and Magarikari; c, western Asterousia Mountains between Kali Limenes and Lendas; d, between Petrokefali and Kouses; e, north of Anogia and Gonies; f, south of the Dikti Mountains (study area); g, Kritsa; and h, between Kalo Chorio and Pachia Ammos and near Stavros (northern Ierapetra Graben). A detailed geological map of the study area is shown in Figure 2.

The Uppermost Unit consists of several subunits that correspond to different tectonometamorphic nappes. These are listed in ascending order of metamorphic overprint in the following.
(a) Anchimetamorphic (prehnite-pumpellyite facies) pillow lavas with ocean-island basalt signature, dolerite, pelagic carbonates and terrigeneous sandstone turbidites (Arvi Unit) correlated with the northern margin of the Pindos Ocean (e.g. Robert & Bonneau, Reference Robert and Bonneau1982; Palamakumbura, Robertson & Dixon, Reference Palamakumbura, Robertson and Dixon2013).
(b) Low-grade metamorphic rocks of sedimentary and volcanic origin associated with serpentinite comprising locally gabbroic dykes (Miamou, Spili and Vatos units), the affinity and origin of this units being unclear and controversially discussed in the literature (see also Martha et al. Reference Martha, Dörr, Gerdes, Krahl, Linckens and Zulauf2017).
(c) Blueschist to greenschist facies rocks (Kalypso, Preveli and Greenschist units) that have been correlated with the northern margin of the Pindos Ocean (e.g. Bonneau, Angelier & Epting, Reference Bonneau, Angelier and Epting1977; Krahl, Herbart & Katzenberger, Reference Krahl, Herbart and Katzenberger1982; Bonneau, Reference Bonneau, Dixon and Robertson1984; Tortorici et al. Reference Tortorici, Catalano, Cirrincione and Tortorici2012; Martha et al. Reference Martha, Dörr, Gerdes, Krahl, Linckens and Zulauf2017).
(d) The presence of a low-grade metamorphic Nappe des serpentines on top of all other subunits of the Uppermost Unit is controversially discussed. While most authors accept this unit (e.g. Bonneau, Reference Bonneau1972; Seidel et al. Reference Seidel, Okrusch, Kreuzer, Raschka and Harre1981), Krahl, Herbart & Katzenberger (Reference Krahl, Herbart and Katzenberger1982) and Tortorici et al. (Reference Tortorici, Catalano, Cirrincione and Tortorici2012) included the serpentinites within the low-grade metamorphic units. One zircon grain from a hornblendite SW of Kerames in central Crete yielded a SHRIMP 206Pb/238U weighted mean age of 162.7±2.8 Ma (Liati, Gebauer & Fanning, Reference Liati, Gebauer and Fanning2004), while K–Ar hornblende ages from gabbroic dykes cutting serpentinite yielded mostly Late Jurassic cooling ages (Delaloye, Economou & Skounakis, Reference Delaloye, Economou, Skounakis and Kallergis1977; Koepke, Seidel & Kreuzer, Reference Koepke, Seidel and Kreuzer2002). The radiometric ages from the Nappe des serpentines compare well with radiometric ages from serpentinites of the Vardar-Axios Zone in mainland Greece (Liati, Gebauer & Fanning, Reference Liati, Gebauer and Fanning2004) and suggest formation and cooling of the serpentines as early as during Middle to Late Jurassic time.
(e) High-grade (upper amphibolite facies) metamorphic rocks and (meta)granitoids, that is the Asterousia Crystalline Complex (ACC; Bonneau, Reference Bonneau1972). Rocks of the ACC are exposed in central and eastern Crete, while comparable rocks are also reported from the Cycladic islands of Anafi, Donousa, Gramvonisi, Ikaria, Makra, Nikouria, Syros and Tinos (Dürr et al. Reference Dürr, Seidel, Kreuzer and Harre1978; Altherr et al. Reference Altherr, Seidel, Okrusch, Schliestedt, Reinecke, Kreuzer, Harre, Klein, Dürr and Panayiotou1980, Reference Altherr, Kreuzer, Lenz, Wendt, Harre and Dürr1994; Bonneau et al. Reference Bonneau, Blake, Geyssant, Kienast, Lepvrier, Maluski and Papanikolaou1980; Reinecke et al. Reference Reinecke, Altherr, Hartung, Hatzipanagiotou, Kreuzer, Harre, Klein, Keller, Geenen and Böger1982; Dürr, Reference Dürr1985; Thorbecke, Reference Thorbecke1987; Patzak, Okrusch & Kreuzer, Reference Patzak, Okrusch and Kreuzer1994).
Conditions of the metamorphic overprint of the ACC, that is orthoamphibolite and metasedimentary rocks (calcsilicate rock, paraamphibolite, paragneiss, quartzite and micaschist), have been constrained at P = 400–500 MPa and T max = 700°C (Seidel et al. Reference Seidel, Okrusch, Kreuzer, Raschka and Harre1981). Slices of serpentinite have been incorporated into the metasedimentary rocks prior to amphibolite facies metamorphism (Bonneau, Reference Bonneau1973; Reinecke et al. Reference Reinecke, Altherr, Hartung, Hatzipanagiotou, Kreuzer, Harre, Klein, Keller, Geenen and Böger1982; Thorbecke, Reference Thorbecke1987; Be'eri-Shlevin, Avigad & Matthews, Reference Be'eri-Shlevin, Avigad and Matthews2009) and have a different geochemical signature from serpentinite from the Nappe des serpentines (Thorbecke, Reference Thorbecke1987). Granitoids intruded the metasedimentary succession of the ACC during middle to late Campanian time at c. 80–71 Ma (isotope dilution themal ionization mass spectrometry (ID-TIMS) and laser ablation inductively coupled plasma mass spectrometry (LA-ICP-MS) 206Pb/238U ages on zircon; Kneuker et al. Reference Kneuker, Dörr, Petschick and Zulauf2015; Martha et al. Reference Martha, Dörr, Gerdes, Petschick, Schastok, Xypolias and Zulauf2016, Reference Martha, Dörr, Gerdes, Krahl, Linckens and Zulauf2017). Amphibolite facies metamorphism is associated with pre-intrusive SE-directed shearing and stacking at the southern margin of the Pelagonian–Lycian domain during collision and subduction of the Pindos realm (Tortorici et al. Reference Tortorici, Catalano, Cirrincione and Tortorici2012; Martha et al. Reference Martha, Dörr, Gerdes, Krahl, Linckens and Zulauf2017). Ongoing subduction caused mantle melting and was followed by continuous intrusion of granitoids in a magmatic arc setting along the southern margin of the Pelagonian–Lycian domain. However, others have suggested a correlation of the Asterousia Crystalline Complex with the Apuseni–Banat–Timok–Srednogorie and Pontide belts based on the similar intrusion ages of granitoids (Be'eri-Shlevin, Avigad & Matthews, Reference Be'eri-Shlevin, Avigad and Matthews2009; Martha et al. Reference Martha, Dörr, Gerdes, Petschick, Schastok, Xypolias and Zulauf2016). K–Ar biotite and hornblende ages of Cretan Asterousia-type (meta)granitoids and metamorphic rocks range over 76–66 Ma (Seidel et al. Reference Seidel, Okrusch, Kreuzer, Raschka and Harre1976, Reference Seidel, Okrusch, Kreuzer, Raschka and Harre1981; Reinecke et al. Reference Reinecke, Altherr, Hartung, Hatzipanagiotou, Kreuzer, Harre, Klein, Keller, Geenen and Böger1982; Langosch et al. Reference Langosch, Seidel, Stosch and Okrusch2000) and indicate mutual cooling during Maastrichtian time. Pervasive top-to-the SE ductile shearing locally affected the ACC during the initial cooling phase (Martha et al. Reference Martha, Dörr, Gerdes, Krahl, Linckens and Zulauf2017). Subduction-related metamorphism affected the northern margin of the Pindos realm during Paleocene time. K–Ar actinolite ages (Reinecke et al. Reference Reinecke, Altherr, Hartung, Hatzipanagiotou, Kreuzer, Harre, Klein, Keller, Geenen and Böger1982) reveal thrusting of the ACC on top of greenschist facies rocks of the northern Pindos margin during middle to late Paleocene time. Continuous shortening and steady uplift resulted in brittle thrusting of both the ACC-type rocks and the greenschists on top of the non-metamorphic flysch of the Pindos Unit until late Eocene time (Martha et al. Reference Martha, Dörr, Gerdes, Krahl, Linckens and Zulauf2017).
2.b. The Uppermost Unit south of the Dikti Mountains
The first geological map of the study area was published by Creutzburg & Papastamatiou (Reference Creutzburg and Papastamatiou1969). These authors erroneously ascribed the metamorphic rocks of the Uppermost Unit to the late Eocene Tripolitsa flysch (assigned by subsequent authors to the Pindos Unit). Serpentinite bodies in the area were regarded as components of the Ethia Series of the Pindos Unit. Further geological maps of the study area have been produced at a scale of 1:50,000 by Vidakis (Reference Vidakis1993) and Bonneau & Vidakis (Reference Bonneau and Vidakis2002). Concerning the Uppermost Unit, however, these maps are less detailed than the general geological map of Crete at a scale of 1:200,000 published by Creutzburg et al. (Reference Creutzburg, Drooger, Meulenkamp, Papastamiatou, Seidel and Tataris1977). Previous works in the study area (Creutzburg & Seidel, Reference Creutzburg and Seidel1975; Seidel et al. Reference Seidel, Okrusch, Kreuzer, Raschka and Harre1981; Koepke & Seidel, Reference Koepke and Seidel1984) have reported amphibolite facies calcsilicate rock, marble, andalusite-bearing metapelite, micaschist and orthoamphibolite. Orthoamphibolite has chemical affinities to olivine tholeiites (Seidel et al. Reference Seidel, Okrusch, Kreuzer, Raschka and Harre1981) and compares well with Asterousia-type orthoamphibolite from other exposures on Crete and on Anafi (Seidel et al. Reference Seidel, Okrusch, Kreuzer, Raschka and Harre1981; Reinecke et al. Reference Reinecke, Altherr, Hartung, Hatzipanagiotou, Kreuzer, Harre, Klein, Keller, Geenen and Böger1982). Furthermore, K–Ar hornblende ages from orthoamphibolite (66.3±2.9 Ma and 68.6±1.9 Ma) and K–Ar biotite ages from sillimanite-bearing micaschist (68.3±0.9 Ma and 68.8±0.9 Ma) confirm a correlation with the ACC (Seidel et al. Reference Seidel, Okrusch, Kreuzer, Raschka and Harre1976, Reference Seidel, Okrusch, Kreuzer, Raschka and Harre1981).
In the study area, the amphibolite facies rocks are associated with serpentinite cut by gabbroic dykes and belonging to the Nappe des serpentines (Bonneau, Reference Bonneau1972; Koepke, Seidel & Kreuzer, Reference Koepke, Seidel and Kreuzer2002). Serpentinite from the Pefkos area consists of antigorite and relics of spinel lherzolite (Koepke, Seidel & Kreuzer, Reference Koepke, Seidel and Kreuzer2002). K–Ar hornblende cooling ages from metagabbro dykes cutting the lherzolites range from 91.9±3.5 Ma to 97.1±4.1 Ma (Cenomanian to Turonian) (Delaloye, Economou & Skounakis, Reference Delaloye, Economou, Skounakis and Kallergis1977; Koepke, Seidel & Kreuzer, Reference Koepke, Seidel and Kreuzer2002), while K–Ar hornblende ages from gabbroic dykes cutting serpentinite at other places of the Uppermost Unit on Crete yielded mostly Late Jurassic cooling ages (see above).
Mineral parageneses from pillow basalts of the Arvi Unit of the study area point to prehnite-pumpellyite facies overprint (Robert & Bonneau, Reference Robert and Bonneau1982). Based on findings of planktonic foraminifera in the reddish pelagic Arvi limestone (Tataris, Reference Tataris1964), the deposition age has been constrained as Maastrichtian while basaltic volcanism is probably of the same age (Robert & Bonneau, Reference Robert and Bonneau1982). Geochemical data (X-ray fluorescence analyses) from the pillow basalts NE of Kato Symi revealed ocean-island basalt (OIB) spectra (Palamakumbura, Robertson & Dixon, Reference Palamakumbura, Robertson and Dixon2013). Terrigenous detritus within sandstone includes fragments of quartzite and serpentinite, possibly derived from the ACC (Palamakumbura, Robertson & Dixon, Reference Palamakumbura, Robertson and Dixon2013).
3. Methods
3.a. Sampling and petrographic analyses
For the purposes of this study, we carried out detailed geological mapping using topographic maps at a scale of 1:5000 obtained from the Hellenic Military Geographical Service in Athens as well as the older maps from (parts of) the study area (Creutzburg & Papastamatiou, Reference Creutzburg and Papastamatiou1969; Creutzburg et al. Reference Creutzburg, Drooger, Meulenkamp, Papastamiatou, Seidel and Tataris1977; Robert & Bonneau, Reference Robert and Bonneau1982; Vidakis, Reference Vidakis1993; Bonneau & Vidakis, Reference Bonneau and Vidakis2002). Mapping included the collection of structural data. Statistical analyses of structural data were carried out using the open source software Stereonet 9.2.0 applying the algorithms described in Allmendinger, Cardozo & Fisher (Reference Allmendinger, Cardozo and Fisher2012) and Cardozo & Allmendinger (Reference Cardozo and Allmendinger2013).
Thin-sections of oriented samples were analysed using a petrographic microscope focusing on mineral content and deformation microfabrics. Thin-sections of oriented samples were cut parallel to the stretching lineation and normal to the foliation. Selected samples were additionally investigated using X-ray powder diffraction analysis (XRD). The samples were powdered using a disc mill and c. 1 g per sample was measured using a PANalytical X'Pert Pro diffractometer. Data evaluation was performed using the software X'pert HighScore Plus. Approximate mineral contents in rocks were determined in thin-sections (modal volume percentages) and from semiquantitative XRD analyses.
3.b. Electron microprobe analysis
In order to constrain the metamorphic P–T conditions, two samples of greenschist (samples PKS11 and PKS12), two samples of chiastolite hornfels (samples PKS23 and PKS24) and one sample of garnet-micaschist (sample Pf002) were selected for quantitative mineral analysis using the electron microprobe (EMP) analyser JEOL JXA-8900 at the Goethe-University Frankfurt. Greenschist samples were used for edenite-tremolite geothermometry (Holland & Blundy, Reference Holland and Blundy1994), while chiastolite hornfels samples were used for phengite geobarometry (Massonne & Schreyer, Reference Massonne and Schreyer1987). Sample preparation followed the same procedures as described in Martha et al. (Reference Martha, Dörr, Gerdes, Krahl, Linckens and Zulauf2017). Twelve major elements were measured using a wavelength-dispersive spectrometer and reported as oxides (SiO2, TiO2, Al2O3, Cr2O3, FeO, MnO, MgO, CaO, NiO, Na2O, K2O, P2O5). Analysis parameters were 15 kV and 20 nA for greenschist samples and 15 kV but 12 nA for chiastolite hornfels samples. The spot size was 3 µm. Most amphibole grains were measured one-by-one and with a spot size of 1 µm and a reduced current of 12 nA due to their small grain size. Peak integration times were 20 s (Na), 30 s (K, Mn, Ca, P and Ni), 40 s (Al, Ti, Si, Mg and Cr) and 60 s (Fe), while the background was measured at integration times of 15–40 s. Several standards (CaSiO3, Al2O3, Mg2SiO4, Fe2SiO4, KTiOPO4, MnTiO3) were analysed at the beginning and at the end of the analytical session under the same conditions to verify the accuracy of our measurements. Calculation of the structural formulae was conducted using the worksheets of Andy Tindle and the Carleton College, available online at http://www.open.ac.uk/earth-research/tindle/AGTHome.html and http://serc.carleton.edu/research_education/equilibria/mineralformulaerecalculation.html. For feldspars structural formulae are based on 8 oxygens, and iron was not recalculated as the amount of FeO is negligible. Amphibole structural formulae are based on 23 oxygens with Fe2+/Fe3+ estimation assuming 13 cations (Leake, Reference Leake1978). For epidote, 12.5 oxygens were assumed for structural formulae calculations, while all iron was converted to Fe3+. Mica structural formulae were calculated assuming 11 oxygens (white mica) or 22 oxygens (biotite) and treating all iron as Fe2+. Structural formulae of garnet were calculated on the base of 12 oxygens, while Fe2+/Fe3+ was calculated assuming full site occupancy.
3.c. LA-ICP-MS analysis
For U–Pb age dating, zircon from one sample of chiastolite hornfels was analysed with LA-ICP-MS using the same procedures as described in Martha et al. (Reference Martha, Dörr, Gerdes, Petschick, Schastok, Xypolias and Zulauf2016). Cathodoluminescence images of zircon were produced prior to LA-ICP-MS analyses, but after polishing, using a JEOL JSM 6490 scanning electron microscope equipped with a Gatan MiniCL detector at the Goethe-University Frankfurt. Laser-induced elemental fractionation and instrumental mass discrimination in LA-ICP-MS analyses were corrected for by normalization to standard zircon GJ-1 (Jackson et al. Reference Jackson, Pearson, Griffin and Belousova2004), which was analysed during the analytical session under the same conditions as the samples. U–Pb data were calculated using the program PBDAT (Ludwig, Reference Ludwig1980) and isotope ratios were plotted using Isoplot (Ludwig, Reference Ludwig2012), with error ellipses reflecting 2σ uncertainties.
4. Results
4.a. Structural data, petrography and microstructures
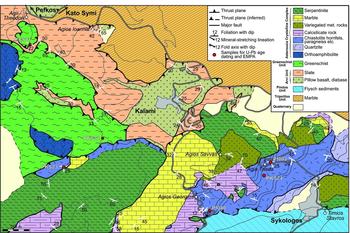
A new geological map of the eastern part of the Uppermost Unit south of the Dikti Mountains is presented in Figure 2. Based on lithology and degree of metamorphic overprint, we distinguished three subunits of the Uppermost Unit in the study area: the Arvi Unit, the newly described Theodorii Greenschist and Asterousia-type rocks, which are described in the following sections.
Geological map of the Uppermost Unit exposed south of the Dikti Mountains in the area of Pefkos, Kalami and Sykologos (Viannos Municipality). Structural data and location of samples for U–Pb age dating are shown.

4.a.1. Arvi Unit
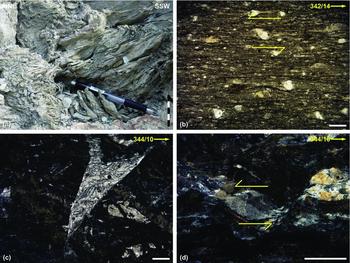
The lowest structural unit in the study area consists of meta-pillow basalt, green and red slates and metadolerite. These rocks were assigned to the prehnite-pumpellyite facies Arvi Unit (Robert & Bonneau, Reference Robert and Bonneau1982). Red, pelagic Globotruncana limestone reported from the Arvi Unit at Ano Symi, just 1 km north of Kalami (Palamakumbura, Robertson & Dixon, Reference Palamakumbura, Robertson and Dixon2013, fig. 6b), are lacking in the study area. The metabasalt pillows are strongly deformed, while the metadolerite is present as massive rock without significant strain. The cleavage of the slates dips shallowly mainly to the NW or to the SE and rarely to the NE or to the SW (Fig. 3a), while the mineral/stretching lineation, defined by the alignment of feldspar and quartz, is trending NW–SE (Fig. 3b). Kink bands, which are perpendicular to the cleavage and to the mineral/stretching lineation, are widespread (Fig. 4a).
Equal-area lower-hemisphere stereoplots of structural data (dominant foliation and mineral/stretching lineation) from the (a, b) Arvi Unit, (c, d) Theodorii Greenschist and (e, f) Asterousia Crystalline Complex in the area of Pefkos, Kalami and Sykologos. Statistical analyses using the 1% area contouring method are indicated.

(a) Photograph and (b–d) microphotographs from rocks of the Arvi Unit and the Theodorii Greenschist of the study area. (a) SSW-vergent kinking in greenish Arvi slate. Road-cut 100 m south of the Kalami Cemetery (35°01′39.64″N; 25°30′00.73″E). Scale bar: 5 cm. (b) Asymmetric pressure shadows of phyllosilicates behind K-feldspar in Arvi slate indicate a top-to-the SE sense of shear. Plane-polarized light. Sample: Pf048. Road-cut 1.5 km SW of Ano Viannos (35°02′36.60″N; 25°24′08.17″E) (locality not shown in Fig. 2). Scale bar: 150 µm. (c) Calcite-filled crack in greenschist. Plane-polarized light. Sample: PKS11. Road cut 225 m SSE of Agii Theodorii (35°02′02″N; 25°29′01″E). Scale bar: 300 µm. (d) Asymmetric pressure shadow of actinolite and chlorite behind K-feldspar in greenschist. The shear sense indicated is top-to-the SE. Cross-polarized light. Same sample as in (c). Scale bar: 300 µm.

Petrographic data of the Arvi rocks are reported by Robert & Bonneau (Reference Robert and Bonneau1982) and Palamakumbura, Robertson & Dixon (Reference Palamakumbura, Robertson and Dixon2013). For this reason we focused on the microstructures, which are pronounced in slates. Slates consist of chlorite (<10%), white mica (up to 50%), K-feldspar (c. 10−30%), plagioclase (<5%), quartz (c. 20−40%) and opaque phases (<5%). Calcite occurs in veins, fibrous calcite being oriented parallel to the main foliation and at high angles to the vein walls. Feldspar and quartz are largely intact and show no evidence for recrystallization or significant deformation. Asymmetric pressure shadows of phyllosilicates behind K-feldspar and plagioclase indicate a top-to-the SE sense of shear (Fig. 4b).
4.a.2. Theodorii Greenschist
South of Agii Theodorii, greenschist facies rocks are tectonically emplaced on top of the Arvi Unit along a brittle thrust. Slickenside striations on the main and second-order thrust planes reveal NW–SE-oriented tectonic transport (Fig. 5a). The Theodorii Greenschist is very homogeneous in composition and consists of albite (up to 50%), amphibole (actinolite and hornblende; c. 10%), biotite, chlorite (c. 10%), epidote (c. 15%) and quartz (5−10%). Calcite, K-feldspar and white mica may occur as accessories. The foliation dips at low angles to the NW while the mineral/stretching lineation, defined by the alignment of feldspar, plunges at low angles to the SE (Fig. 3c, d).
Equal-area lower-hemisphere stereoplot summarizing (a) slickenside striation on thrust planes between the Arvi Unit and the Theodorii Greenschist and (b) the orientation of fold axes from the Uppermost Unit of the study area.

A spaced foliation is defined by actinolite- and chlorite-rich domains (AC domains). Actinolite occurs as very thin acicular needles with an average width <5 µm (Fig. 6a), while hornblende may form typical hexagons with a length of up to 25 µm (Fig. 6b). The matrix consists of albite, epidote and few quartz grains. Quartz and albite usually form lens-shaped domains (QF domains) aligned parallel to the AC domains and albite and epidote may occur as single grains within the AC domains. Quartz of the QF domains is very fine-grained (<0.5 mm). Calcite always forms large clusters or is filling cracks (Fig. 4c). It often co-exists with white mica. Calcite twins are straight, rational and thin. They can be classified as type I or II according to the classification of Burkhard (Reference Burkhard1993). Shear sense indicators are sparse. One grain, presumably K-feldspar, which exhibits an asymmetric pressure shadow of actinolite and chlorite, suggests top-to-the SE transport (Fig. 4d).
Backscattered electron images of (a–b) greenschist from the Theodorii Greenschist and (c–d) chiastolite hornfels from the Asterousia Crystalline Complex. Mineral abbreviations: act – actinolite; alb – albite; bio – biotite; chl – chlorite; epd – epidote; grt – garnet; hbl – hornblende; qtz – quartz; wmc – white mica. (a) Acicular actinolite needles in matrix of albite and epidote. Sample: PKS11. Road-cut 225 m SSE of Agii Theodorii (35°02′02″N; 25°29′01″E). Scale bar: 25 µm. (b) Fine-grained groundmass consisting of actinolite, albite, chlorite, epidote and hornblende. Sample: PKS12. Road-cut 500 m SW of Kalami (35°01′32.53″N; 25°29′26.22″E). Scale bar: 25 µm. (c) Garnet porphyroblasts in garnet-micaschist. Sample: Pf002. Road-cut 25 m east of Agia Triada (35°01′25.04″N; 25°30′29.66″E). White mica (cross-mica) growing perpendicular to the main foliation defined by the alignment of biotite. Scale bar: 250 µm. (d) Same locality as in (c). Scale bar: 100 µm. (e) White mica showing pronounced cleavage. Sample: PKS23. Road-cut 1 km SW of Kalami (35°01′24.20″N; 25°29′12.49″E). Scale bar: 100 µm. (f) Pseudomorphic white mica crystal. Sample: PKS24. Road cut 125 m south of Agia Triada (35°01′21.26″N; 25°30′28.53″E). Scale bar: 100 µm.

4.a.3. Asterousia-type rocks
The Theodorii Greenschist is overlain by amphibolite facies metamorphic rocks, which have been attributed to the ACC (Bonneau, Reference Bonneau1972). In the study area, the ACC-type rocks include orthoamphibolite, metasedimentary rocks and serpentinite. Both the orthoamphibolite and the metasedimentary rocks display a foliation that commonly dips shallowly either to the SW or to the SE (Fig. 3e). A NW–SE-trending mineral/stretching lineation is pronounced in orthoamphibolite and micaschist, but it is only weakly developed in other rock types (Fig. 3d). A top-to-the SE sense of shear is indicated by few asymmetric boudins of calcsilicate rock, serpentinite or quartzite, which are embedded in metapelitic rocks. Isoclinal to open SE- and SW-vergent folds with NE–SW- and NW–SE-trending axes, respectively, were also observed (Fig. 7b). Symmetric calcsilicate boudins inside quartzite have been affected by subsequent folding (Fig. 7a).
(a–c) Photographs and (d) microphotograph from the Asterousia Crystalline Complex of the study area. (a) Lens of calcsilicate rock and quartzite inside marble (dark grey, at the margins). Calcsilicate rock forms symmetric boudins that have been affected by subsequent folding. Road-cut 300 m NNW of Agios Georgios (35°01′21.68″N; 25°29′55.38″E). Scale bar: 1 m. (b) Thrust plane between orthoamphibolite (hanging wall) and Theodorii Greenschist (footwall). Road-cut 700 m south of Agii Theodorii (35°01′46.76″N; 25°28′54.63″E). Scale bar: 1 m. (c) Plagioclase σ-clasts in orthoamphibolite indicating a top-to-the SE sense of shear. Road-cut 475 m south of Agii Theodorii (35°01′54.47″N; 25°28′55.08″E). Scale bar: 1 cm. (d) Orthoamphibolite showing asymmetric pressure shadows of quartz and hornblende behind plagioclase that indicate a top-to-the SE sense of shear. Cross-polarized light. Sample: Pf021y. Road-cut 550 m SSW of Agii Theodorii (35°01′52.08″N; 25°28′53.11″E). Scale bar: 1 mm.

4.a.3.a. Orthoamphibolite
Orthoamphibolite was found south of Pefkos and SW of Kalami. Large orthoamphibolite exposures occur west of the mapped area between Agios Vasilios and Pefkos. Orthoamphibolite has been emplaced on top of the Theodorii Greenschist via a thrust that dips moderately towards the NW (Fig. 7b). Both orthoamphibolite and greenschist are strongly disintegrated and fractured near the contact, and calcite veins are common. Slices of serpentinite inside the orthoamphibolite are frequent near the contact. Orthoamphibolite is massive and consists of hornblende and plagioclase as the main constituents (both phases with varying amounts of 40–60%), while chlorite, quartz and opaque phases occur as accessories. Both hornblende and plagioclase show shape-preferred orientation, resulting in a NW–SE-trending mineral/stretching lineation. Plagioclase shows deformation twins according to the albite law, kinking and microfractures. In sections cut perpendicular to the mylonitic foliation and parallel to the stretching/mineral lineation, kinematic indicators such as plagioclase σ-clasts and asymmetric pressure shadows of quartz and hornblende behind plagioclase indicate top-to-the SE shearing (Fig. 7c, d).
4.a.3.b. Metasedimentary rocks and serpentinite
Metasedimentary rocks include calcsilicate rock, chiastolite hornfels, marble, micaschist, quartzite and minor occurrences of paragneiss and other rock types. They are exposed in the southern and eastern parts of the study area. Metasedimentary rocks are found on top of the Arvi Unit south and east of Kalami. A contact between the metasedimentary succession and underlying units was not observed in the field. (Meta)granitoids, which are common in other metasedimentary sequences of the ACC on Crete and the Cyclades, have not been found. Serpentinite has been found both as slices incorporated into the metasedimentary rocks and on top of the metasedimentary succession separated from the latter by normal faults (Fig. 8a). From our observations, it is not evident whether serpentinite on top of the amphibolite facies rocks constitutes a separate nappe (the Nappe des serpentines as proposed by Bonneau, Reference Bonneau1972) or whether it is of the same type as slices inside the metasedimentary succession.
(a, e) Photographs and (b–d, f) microphotographs from the Asterousia Crystalline Complex in the study area. (a) Normal fault between serpentinite (hanging wall) and Asterousia-type micaschist (footwall). Road-cut 40 m NW of Agia Triada (35°01′25.38″N; 25°30′26.56″E). Scale bar: 25 cm. (b) Quartz layer inside calcsilicate rock. Quartz shows evidence for high-temperature grain boundary migration recrystallization (lobate grain boundaries), subgrains, healed fractures (decorated with fluid inclusions) and undulatory extinction. Cross-polarized light. Sample: PKS20. Road-cut 600 m north of Sykologos (35°01′34.90″N; 25°30′50.95″E). Scale bar: 300 µm. (c) Serpentinite composed of lizardite, magnetite and chlorite. Cross-polarized light. Sample: PKS14. Road-cut 250 m ESE of Agios Savvas (35°01′26″N; 25°30′18″E). Scale bar: 300 µm. (d) Marble showing tabular and thick type II twins according to the classification of Burkhard (Reference Burkhard1993). Quartz and white mica occur as accessories. Cross-polarized light. Sample: PKS07. Road-cut 250 m SW of Agios Savvas (35°01′22″N; 25°30′03″E). Scale bar: 300 µm. (e) NE–SW-trending discrete shear band in quartzite. The shear band dips 266/24°. Road-cut in southeastern Sykologos (35°01′08.90″N; 25°30′46.94″E). Scale bar: 50 cm. (f) Quartzite showing an equilibrium fabric of polygonal and small grains. Larger grains occur in clusters (upper right) and thin layers. Grain boundaries are straight or slightly curved and contacts are triple junctions. Sample: PKS08. On a hill 250 m NE of Sykologos (35°01′21″N; 25°30′53″E). Scale bar: 300 µm.

Calcsilicate rock is present in the area of Agios Georgios and in thin layers between chiastolite hornfels exposed north and west of Sykologos. It consists of diopside (20−45%), plagioclase (20−40%), green amphibole (hornblende and pargasite; 20−30%), quartz (<10%), K-feldspar (<5%), calcite (<5%), phyllosilicates (<5%) and opaque phases (<2%). Xenomorphic garnet may occur in layers within the matrix in some samples but was never found as porphyroblasts. Diopside is strongly fractured. Calcite occurs both in the matrix and in almost pure layers subparallel to the main foliation. A shape-preferred orientation is weakly developed and almost faint in diopside-rich samples. Quartz occasionally forms thin lens-shaped layers and exhibits undulatory extinction and lobate grain boundaries (Fig. 8b). A NW–SE-trending mineral/stretching lineation is defined by the alignment of amphibole, quartz and/or K-feldspar.
Serpentinite forms massive exposures north of Agios Savvas and in the southwestern part of the mapped area. In both occasions, serpentinite lies on top of the metasedimentary succession and was frequently intruded by mafic dykes (see also Koepke, Seidel & Kreuzer, Reference Koepke, Seidel and Kreuzer2002). Furthermore, it is cut by NW–SE- to N–S-striking normal faults. Microscopic and XRD analyses reveal lizardite as the main serpentine phase (>75%), as well as magnetite and chlorite as accessories (Fig. 8c). Talc is found along shear planes. Relics of possibly clinopyroxene and/or olivine were observed only occasionally in thin-section. Differences in the composition between serpentinite from slices within the metasedimentary succession and from serpentinite on top of the metasedimentary rocks were not observed.
Marble is often found in close association with serpentinite and in thin layers between other rock types. It is granoblastic, fine-grained (<500 µm), impure and consists of c. 85% calcite. Quartz, plagioclase, K-feldspar, biotite and white mica occur as accessories. Calcite twins are tabular, thick and rarely slightly curved (Fig. 8d). They are classified as type II using the classification of Burkhard (Reference Burkhard1993). Other constituents are very fine-grained and irregularly interspersed among calcite. Quartz may form NW–SE-oriented symmetric boudins with a diameter of up to 15 cm. In these cases, quartz is polycrystalline and shows evidence for dynamic recrystallization. Grain boundaries are straight, and undulatory extinction is weakly pronounced. The quartz boudins are cut by veins, which are mineralized with coarse-grained calcite (grain size, 0.75–3.8 mm).
Micaschist occurs as minor intercalations among other rock types and is usually associated with chiastolite hornfels in the area of Agia Triada and Agios Georgios. The main constituents are biotite (<40–60%), quartz (30–50%), K-feldspar (<5%) and plagioclase (<5%), while epidote and chlorite were observed as accessories in some samples. The shape-preferred orientation of biotite defines a pronounced foliation that is separated by planar QF domains. K-feldspar and plagioclase may form rare sigmoidal inclusions. The appearance and deformation microstructures of quartz compare well with those described from quartz of quartzite (see following section). Garnet (almandine) was observed only in micaschist intercalations within chiastolite hornfels from Agia Triada. It occurs as small, euhedral, octagonal to roundish porphyroblasts with internal fractures (Fig. 6d). Cordierite was found as small, subhedral porphyroblasts. White mica is present in the form of cross-mica growing oblique to the main foliation, while K-feldspar occurs only as accessory and plagioclase lacks in these assemblages.
Quartzite is found in the Sykologos area and is full of discrete brittle shear zones, dipping at low to medium angles to the NW or to the SE (Fig. 8e). Striations on the shear zones plunge to the SW or to the NE (Fig. 3d). Quartzite consists of >75% quartz, while diopside, biotite, white mica, clay minerals and opaque phases are found as accessories. Quartz shows an equilibrium fabric of polygonal and small grains with few larger grains building clusters or thin layers. Grain boundaries are straight or slightly curved and contacts are triple junctions with interfacial angles of c. 120° (Fig. 8f). Undulatory extinction is weakly pronounced. Other constituents are very fine-grained and frequently interspersed between quartz. Grain size of quartz is correlated with the amount of impurities, quartz grains being larger in almost pure layers. The shape-preferred orientation in quartzite is defined by the alignment of biotite and clay minerals. A NW–SE-trending mineral/stretching lineation is vaguely defined.
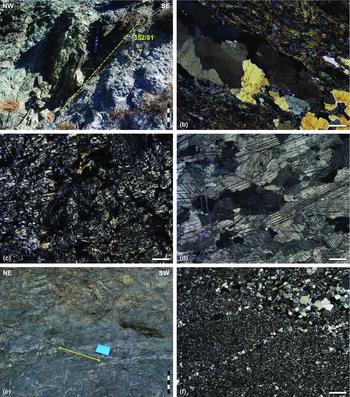
Chiastolite hornfels is present in the area between the Agios Georgios chapel and Sykologos. It is largely massive and at some places weakly foliated (Fig. 9a). Andalusite is present in the form of bright ledges (length <2.5 cm; width <1.2 cm). Apart from andalusite (5–15%), other main constituents are quartz (30–50%), biotite (20–35%), plagioclase (<15%) and K-feldspar (<10%), while white mica (<5%), clay minerals (<2%) and graphite (<1%) occur as accessories. Garnet and chlorite were observed in some samples only. A shape-preferred orientation of biotite results in the weak foliation, which is dipping to the SW or to the NE. A mineral/stretching lineation on the foliation planes is poorly developed. Biotite is sometimes kinked. Quartz, plagioclase and K-feldspar co-occur with biotite in the matrix. Quartz may be fine-grained and recrystallized, but also forms aggregates of large recrystallized grains. Quartz from aggregates shows undulatory extinction and weakly developed chessboard patterns based on prism- and basal-parallel subgrains (Fig. 9b). Recrystallized grains are large and slightly polygonal with contacts tending to form triple junctions. Biotite inclusions and pinning of quartz grain boundaries by biotite are common. K-feldspar shows undulatory extinction, while Karlsbad twinning is rare. Garnet may occur as idiomorphic porphyroblasts or xenomorphic in layers. Garnet porphyroblasts are strongly disintegrated and were partly replaced by white mica, chlorite and clay minerals. Zoning is sometimes weakly recognizable. There are two types of garnet porphyroblasts: (1) garnet porphyroblasts with aligned, elongate inclusions as internal foliation (Si = S1) perpendicular to the external foliation (Se = S2) (Fig. 9c) and (2) syn-D2 garnet porphyroblasts with inclusions of feldspar, quartz and white mica, which were observed in one sample and indicate rotation during deformation (Fig. 9d). In one sample, garnet is xenomorphic and intergrown with biotite. Andalusite is present in the form of euhedral porphyroblasts and may form cross-shaped twins (Fig. 9e). Andalusite was growing across a pre-existing foliation (S2) and shows re-entrant zones with feather-edge structures. Inclusions of cryptocrystalline graphite take the shape of a cross in sections along the C-axis. Andalusite is therefore classified as chiastolite. The centres of chiastolite grains consist of graphite. Graphite may also surround chiastolite porphyroblasts. Chiastolite grains show evidence for boudinage, and pressure shadows of biotite and quartz have been developed behind chiastolite along S2 // S3. In cases where the pressure shadows are asymmetrical, a D3 top-to-the SE sense of shear is indicated. Incipient sericitization of chiastolite was observed. White mica shows a pronounced cleavage and may occur within the rock matrix (Fig. 6e) as well as forming large new crystals. It is present as cross-mica that grew post-kinematically across the main foliation (S2 // S3). White mica may replace garnet and may form pseudomorphs, presumably after cordierite (Figs 6f, 9f). Chlorite is present as secondary phase replacing biotite.
(a) Photograph and (b–f) microphotographs of chiastolite hornfels from the Asterousia Crystalline Complex of the study area. (a) Massive, bluish-violet chiastolite hornfels showing columnar, white porphyroblasts of chiastolite. Road-cut 200 m SE of Agios Georgios (35°01′09.40″N; 25°30′07.26″E). Scale bar: 5 cm. (b) Quartz porphyroclast showing poorly developed chessboard-type subgrains. Cross-polarized light. Sample: PKS24. Road-cut 125 m south of Agia Triada (35°01′21.26″N; 25°30′28.53″E). Scale bar: 500 µm. (c) Intertectonic garnet porphyroblast replaced by white mica at the margins. The shape-preferred orientation of elongate tiny inclusions defines an internal foliation (Si = S1) perpendicular to the external foliation (Se = S2). Sample: Pf040y. Same locality as in (a). Scale bar: 500 µm. (d) Syntectonic garnet porphyroblast with inclusions of feldspar, quartz and white mica. The asymmetry of the fabric indicates a dextral rotation (in the microphotograph). Cross-polarized light. Sample: Pf002z. Road-cut 25 m east of Agia Triada (35°01′25.04″N; 25°30′29.66″E). Scale bar: 300 µm. (e) Chiastolite porphyroblast showing a pronounced internal dark cross made of cryptocrystalline graphite and a small lozenge-shaped graphite core. Graphite was also dissolved from the interior during growth and is found at the margins. Pressure shadows of biotite and quartz as well as marginal drag and fracturing of andalusite suggest inter- to syntectonic evolution with respect to D3. Cross-polarized light. Same sample as in (b). Scale bar: 1 mm. (f) Relatively large crystals of white mica probably forming pseudomorphs after cordierite. Cross-polarized light. Same sample as in (b). Scale bar: 300 µm.

4.b. Electron microprobe analysis
4.b.1. Edenite–tremolite geothermometry
Representative chemical analyses of two samples from the Theodorii Greenschist (PKS11 and PKS12) are listed in online supplementary Tables S1 and S2 (available at https://doi.org/10.1017/S0016756818000328). Albite has anorthite contents ranging from 0.54 to 7.73%. As the mineral assemblage of the Theodorii Greenschist consists of amphibole, plagioclase and quartz (Fig. 6a, b), the edenite-tremolite geothermometer of Holland & Blundy (Reference Holland and Blundy1994) was applied for mineral pairs of albite and amphibole. One albite grain is always in contact with several amphibole grains (Fig. 6a, b). This challenges identification of suitable equilibrium pairs and, indeed, a wide range of temperatures was obtained for amphibole grains sharing grain boundaries with the same albite grain. A calculation grid using the Excel-based spreadsheet of Hora et al. (Reference Hora, Kronz, Möller-McNett and Wörner2013) showing the temperatures of valid equilibrium amphibole and plagioclase pairs is shown in online supplementary Table S3. The Al content of hornblende obtained from electron microprobe analyses is low (5.90–8.00%), suggesting low pressure for greenschist facies metamorphism. This is in accordance with the pressures calculated for the amphiboles using the method of Ridolfi & Renzulli (Reference Ridolfi and Renzulli2012), which range over 100–300 MPa. Calculated temperatures for plagioclase and amphibole mineral pairs do not yield accurate values, ranging over 308–526°C. The combination of low-albite plagioclase with low-Si amphibole yields peak temperatures, while high-albite plagioclase with high-Si amphibole yields the lowest temperatures.
4.b.2. Phengite geobarometry
Results of chemical analyses on two samples of chiastolite hornfels (PKS23 and PKS24) and on one sample of garnet-micaschist (Pf002) are presented in online supplementary Tables S4–S6 (available at https://doi.org/10.1017/S0016756818000328). White mica is not zoned and no significant differences between cores to rims were observed. The analyses plot very close to muscovite in a (Mg, Fe)–celadonite–muscovite–pyrophyllite ternary diagram, while the celadonite and pyrophyllite components are very low (Fig. 10a). In a Si–Al diagram, white mica analyses from PKS23 and some analyses from PKS24 plot slightly above the Al–celadonite–muscovite join (Fig. 10b), showing the importance of the Tschermak-type substitution (2Al3+ ↔ (Mg2+, Fe2+) + Si4+) (e.g. Velde, Reference Velde1965). Analyses with high pyrophyllite content, in turn, are typical of low-temperature (retrograde) micas (Dubacq, Vidal & De Andrade, Reference Dubacq, Vidal and De Andrade2010). Si contents of intermediate members of the muscovite–celadonite solid solution series (i.e. phengitic white mica) in the limiting assemblage with K-feldspar, phlogopite (biotite) and quartz are pressure dependent and can be used for geobarometry (Massonne & Schreyer, Reference Massonne and Schreyer1987). Variability of the Si values in phengite from the chiastolite hornfels is very low and illustrates the compositional homogeneity of white mica. The values range from 3.06 to 3.1 p.f.u. (per formula unit) for analyses with the highest celadonite content, and indicate very low pressures of <400 MPa during the static formation of white mica based on the Si isopleths experimentally determined by Massonne & Schreyer (Reference Massonne and Schreyer1987).
(a) (Mg, Fe)–celadonite–muscovite–pyrophyllite ternary diagram of white mica from garnet-micaschist sample Pf002 at Agia Triada and from chiastolite hornfels samples PKS23 SW of Kalami and PKS24 south of Agia Triada and (b) Si–Al diagram of white mica with the Al–celadonite–muscovite join in dark grey. The values are from online supplementary Tables S4–S6 (available at https://doi.org/10.1017/S0016756818000328).

4.b.3. Garnet–biotite geothermometry
Results of chemical analyses on one sample of garnet-micaschist (Pf002) are presented in online supplmentary Table S6 (available at https://doi.org/10.1017/S0016756818000328). Garnet can be classified as almandine and has very low magnesium numbers (XMg = 0.07–0.08). This indicates low-pressure conditions (Aranovich & Podlesskii, Reference Aranovich, Podlesskii and Saxena1983) and we therefore assumed a pressure of 200 MPa for geothermometry calculations. Six geothermometers were employed for five garnet–biotite mineral pairs (Table 1). Furthermore, we distinguished between rims and cores for each garnet porphyroblast. Calculated temperatures range from 529±21 to 605±19°C (the means of all garnet–biotite thermometers were considered). Temperature estimates for garnet cores are 20–60°C higher than for garnet rims, which is due to the lower Fe2+ content but higher Mg content in garnet cores. Although garnet-micaschist contains andalusite and no sillimanite, the results from the garnet–biotite geothermometers for garnet cores are consistent with P–T estimates derived from magnesium numbers of garnet and cordierite (XMg = 0.38–0.39; not included in online supplementary Table S6) and using the geothermobarometer for cordierite–garnet–sillimanite–quartz assemblages of Aranovich & Podlesskii (Reference Aranovich, Podlesskii and Saxena1983). This geothermobarometer yields temperatures slightly below 600°C and a pressure of c. 200 MPa.
Estimates of temperature conditions (°C) for metamorphism of garnet-micaschist (sample Pf002) from the Asterousia Crystalline Complex 25 m east of Agia Triada using the garnet–biotite geothermometers of A, Thompson (Reference Thompson1976); B, Ferry & Spear (Reference Ferry and Spear1978); C, Hodges & Spear (Reference Hodges and Spear1982); D, Perchuk & Lavrent'eva (Reference Perchuk, Lavrent'eva and Saxena1983); and E, Bhattacharya et al. (Reference Bhattacharya, Mohanty, Maji, Sen and Raith1992) and Holdaway (Reference Holdaway2000). Values for calculations are from online supplementary Table S6. For calculations, a pressure of 200 MPa was estimated based on Mg numbers of garnet (Table S6) and application of the geothermobarometer of Aranovich & Podlesskii (Reference Aranovich, Podlesskii and Saxena1983).

4.c. Geochronological analyses
For U–Pb age dating, we collected samples of chiastolite hornfels exposed 200 m SE of Agios Georgios and of garnet-micaschist from Agia Triada. While chiastolite hornfels contained only a few small zircon grains that could be dated with LA-ICP-MS, no zircon was found in garnet-micaschist.
One zircon grain from chiastolite hornfels is pristine, euhedral, subangular and shows growth zoning (Fig. 11). The uranium content ranges over 736–1300 ppm and the amount of common lead (Pbc) should have either no or (for analysis A307) minor influence on the concordance (Table 2). The most concordant analysis (A306) is from the core of the zircon grain and yielded a 206Pb/238U age of 74±2 Ma, while two further analyses on the rim of the zircon grain (A305 and A307) yielded 206Pb/238U ages of 75±2 Ma and 82±3 Ma. The 82 Ma age has the lowest concordance and also the lowest uranium content and the highest amount of Pbc, the accuracy of this analysis therefore being questionable. The two analyses with the younger ages yielded a concordia age at 74±2 Ma with a mean standard weighted deviation (MSWD) of 0.0082 and a probability of concordance of 0.93 (Fig. 11). These two analyses have Th/U ratios <0.001. Analyses on seven more zircon grains from the same sample yielded much older, inherited Devonian, middle Permian and Early Triassic ages and one zircon was dated at c. 990 Ma.
U–Pb concordia diagram of two LA-ICP-MS analyses of one zircon grain from chiastolite hornfels (sample Pf040, SE of Agios Georgios). Numbering and error of the ellipses are given in Table 2. The cathodoluminescence image shows a euhedral, subangular and pristine zircon grain with growth zoning and free from inclusions. Scale bar: 100 µm.

Pb, U and Th LA-ICP-MS results for one zircon grain from chiastolite hornfels sample Pf040 from the Asterousia Crystalline Complex SE of Agios Georgios. Spot size 30 µm, depth of crater c. 15 µm. 206Pb/238U error is the quadratic addition of the within-run precision (2 standard errors) and the external reproducibility (2 standard deviations) of the reference zircon. 207Pb/206Pb error propagation (207Pb signal-dependent) following Gerdes & Zeh (Reference Gerdes and Zeh2009). 207Pb/235U error is the quadratic addition of the 207Pb/206Pb and 206Pb/238U uncertainty. Errors of the mean values are given at 2σ level.

a Within-run background-corrected mean 207Pb signal in cps (counts per second); bU and Pb content and Th/U ratio were calculated relative to standard zircon GJ-1; cPercentage of the common lead on the 206Pb; dCorrected for background, within-run Pb/U fractionation (in case of 206Pb/238U) and common Pb using Stacey & Kramers (Reference Stacey and Kramers1975) model Pb composition, and subsequently normalized to standard zircon GJ-1 (ID-TIMS value/measured value); 207Pb/235U calculated using (207Pb/206Pb)/(238U/206Pb × 1/137.88); eError correlation defined as err(206Pb/238U)/err(207Pb/235U); fDegree of concordance = 100 × (238U/206Pb age)/(207Pb/206Pb age).
5. Discussion
5.a. The Uppermost Unit south of the Dikti Mountains
Geological mapping of the area south of the Dikti Mountains, as well as structural and petrographic analyses, reveal that the Uppermost Unit in the study area can be subdivided into three different tectonometamorphic subunits. From bottom to top these are: (1) the Arvi Unit consisting of prehnite-pumpellyite facies slates, meta-pillow basalts and metadolerite; (2) the Theodorii Greenschist; and (3) the ACC-type rocks consisting of orthoamphibolite, metasedimentary rocks and slices of serpentinite. Previously, only the Arvi Unit and the ACC-type rocks had been recognized in the study area (Robert & Bonneau, Reference Robert and Bonneau1982; Vidakis, Reference Vidakis1993; Bonneau & Vidakis, Reference Bonneau and Vidakis2002), while greenschist facies rocks termed ‘Theodorii Greenschist’ here are reported for the first time. The Theodorii Greenschist compares well with greenschist facies rocks from other sections with exposures of the Uppermost Unit, namely the Anafi Greenschist in the southern Cyclades (Reinecke et al. Reference Reinecke, Altherr, Hartung, Hatzipanagiotou, Kreuzer, Harre, Klein, Keller, Geenen and Böger1982; Martha et al. Reference Martha, Dörr, Gerdes, Petschick, Schastok, Xypolias and Zulauf2016) and the Akoumianos Greenschist in the area west of Melambes (Martha et al. Reference Martha, Dörr, Gerdes, Krahl, Linckens and Zulauf2017). Both the Anafi and Akoumianos Greenschist are likewise found at the base of amphibolite facies ACC-type rocks. The Uppermost Unit in the study area has been thrust on top of non-metamorphic late Eocene Pindos flysch, while the contact between the Uppermost and Tripolitsa units towards the north could not be observed in the field but is a steep normal fault according to Robert & Bonneau (Reference Robert and Bonneau1982).
Amphibolite facies rocks of the study area have been correlated with the ACC by Bonneau (Reference Bonneau1972). The ACC sequence south of the Dikti Mountains compares well with the sequences described from the western Asterousia Mountains (Koepke & Seidel, Reference Koepke and Seidel1984), the area west of Melambes (Martha et al. Reference Martha, Dörr, Gerdes, Krahl, Linckens and Zulauf2017) and Anafi (Reinecke et al. Reference Reinecke, Altherr, Hartung, Hatzipanagiotou, Kreuzer, Harre, Klein, Keller, Geenen and Böger1982; Martha et al. Reference Martha, Dörr, Gerdes, Petschick, Schastok, Xypolias and Zulauf2016) (Fig. 12). A correlation is further confirmed by the composition of the metasedimentary succession, and by orthoamphibolite having a tholeiitic geochemical signature similar to orthoamphibolite from the western Asterousia Mountains and Anafi (Seidel et al. Reference Seidel, Okrusch, Kreuzer, Raschka and Harre1976, Reference Seidel, Okrusch, Kreuzer, Raschka and Harre1981; Reinecke et al. Reference Reinecke, Altherr, Hartung, Hatzipanagiotou, Kreuzer, Harre, Klein, Keller, Geenen and Böger1982; Thorbecke, Reference Thorbecke1987).
Columns showing the tectonostratigaphic sequence of the Uppermost Unit in (a) the western Asterousia Mountains between Lendas and Miamou (after Koepke & Seidel, Reference Koepke and Seidel1984), (b) the area west of Melambes (after Martha et al. Reference Martha, Dörr, Gerdes, Krahl, Linckens and Zulauf2017), (c) Anafi (after Reinecke et al. Reference Reinecke, Altherr, Hartung, Hatzipanagiotou, Kreuzer, Harre, Klein, Keller, Geenen and Böger1982; Martha et al. Reference Martha, Dörr, Gerdes, Petschick, Schastok, Xypolias and Zulauf2016), and (d) the study area between Pefkos, Kalami and Sykologos. The columns are not to scale. Note that the Arvi Unit occurs in the western Asterousia Mountains (e.g. Thorbecke, Reference Thorbecke1987) but has not been considered by Koepke & Seidel (Reference Koepke and Seidel1984).

The Arvi Unit, the Theodorii Greenschist and the ACC-type rocks are separated by thrusts, with higher-grade metamorphic rocks resting on top of lower-grade metamorphic rocks. One additional thrust is present within the ACC between the orthoamphibolite and the metasedimentary rocks. The Arvi Unit and the Theodorii Greenschist are separated by a brittle thrust related to NW–SE-oriented transport, while the thrust contact between the Theodorii Greenschist and the Asterousia-type rocks was active under semi-ductile conditions. On Anafi, however, the Anafi Greenschist is separated from the orthoamphibolite by a mylonitic shear zone (Martha et al. Reference Martha, Dörr, Gerdes, Petschick, Schastok, Xypolias and Zulauf2016). A considerable difference between the Asterousia-type rocks of the study area and those exposed at other places on Crete and in the Cyclades is the lack of granitoid intrusions inside the metasedimentary succession. These intrusions are probably close to the studied rocks because of the strong contact metamorphism recorded by chiastolite hornfels, however (see below).
5.b. Geochronological data and origin of the zircon grain
LA-ICP-MS data from one zircon grain of chiastolite hornfels yielded three 206Pb/238U ages of 74±2 Ma, 74±2 Ma and 82±3 Ma, with the oldest age being discarded (see Section 4). The concordia age calculated from the two most concordant analyses is 74±2 Ma (Fig. 11). This age fits well with LA-ICP-MS and ID-TIMS zircon concordia ages obtained from Asterousia-type (meta)granitoids exposed in the northern Ierapetra Graben of eastern Crete (74.5±0.25 Ma for quartzdiorite; Kneuker et al. Reference Kneuker, Dörr, Petschick and Zulauf2015), west of Melambes in central Crete (71.9±0.6 to 76.9±0.3 Ma for metadiorite and orthogneiss; Martha et al. Reference Martha, Dörr, Gerdes, Krahl, Linckens and Zulauf2017) and on Anafi (74.0±0.1 Ma for the main zircon population from granodiorite; Martha et al. Reference Martha, Dörr, Gerdes, Petschick, Schastok, Xypolias and Zulauf2016). Other similar U–Pb zircon ages (peak at 70–80 Ma) have been reported from detrital zircons of the Cycladic Blueschist Unit on Tinos (Hinsken et al. Reference Hinsken, Bröcker, Berndt and Gärtner2016), where Asterousia-type granitoids might have been a source for these zircons.
There are two possibilities to explain the occurrence of Campanian zircon inside chiastolite hornfels from the study area: (1) the zircon grain is of detrital origin derived from Asterousia-type (meta)granitoids, and was deposited together with the clastic components of the hornfels protolith; or (2) the analysed zircon grain was growing due to contact metamorphism related to the intrusion of an adjacent Campanian pluton. The striking euhedral shape of the zircon rules out a detrital provenance. The cathodoluminescence images, in turn, suggest a magmatic formation. However, this is considered unlikely taking into account that the zircon grain is from a rock type that is indicative of contact-metamorphic origin (chiastolite hornfels). These rocks occur only locally inside the Asterousia-type metasedimentary succession, and we believe that it reflects a contact aureole around a non-exposed intrusive body (see Section 5.c). Formation of the zircon grain during contact metamorphism is further indicated by the Th/U ratios being 0 for the two analyses yielding a concordia age. Based on the pressure constraints (see Section 5.c), the intrusion should have occurred at a depth below 10 km. A comparable shallow level of intrusion was obtained for quartz diorite 25 km further NE in the northern Ierapetra Graben (Pachia Ammos area; Kneuker et al. Reference Kneuker, Dörr, Petschick and Zulauf2015). K–Ar biotite ages from sillimanite-bearing micaschist south of Pefkos (Seidel et al. Reference Seidel, Okrusch, Kreuzer, Raschka and Harre1981) are c. 5–6 Ma younger than the U–Pb zircon age of the chiastolite hornfels. For this reason, the U–Pb age of 74±2 Ma should reflect the time of the peak temperature during contact metamorphism and therefore the time of pluton emplacement.
5.c. Deformation conditions and kinematics
The petrographic data and deformation microstructures presented above can be used to estimate the deformation temperature in the individual subunits of the Uppermost Unit. Mineral assemblages in the Arvi slates (chlorite+albite+quartz+white mica) and the Arvi volcanic rocks (albite+pumpellyite+chlorite+white mica±epidote; Robert & Bonneau, Reference Robert and Bonneau1982) indicate deformation at very low temperatures compatible with the prehnite-pumpellyite facies (T = 250–350°C, P >200 MPa; Liou, Maruyama & Cho, Reference Liou, Maruyama, Cho and Frey1987) for the Arvi Unit. Kinking and asymmetric pressure shadows behind rigid feldspar indicating top-to-the SE shearing are consistent with these deformation conditions.
The mineral assemblage observed in the Theodorii Greenschist indicates greenschist facies conditions and compares well with mineral assemblages reported from the Anafi Greenschist (Reinecke et al. Reference Reinecke, Altherr, Hartung, Hatzipanagiotou, Kreuzer, Harre, Klein, Keller, Geenen and Böger1982; Martha et al. Reference Martha, Dörr, Gerdes, Petschick, Schastok, Xypolias and Zulauf2016) and the Akoumianos Greenschist (Martha et al. Reference Martha, Dörr, Gerdes, Krahl, Linckens and Zulauf2017). Asymmetric pressure shadows of actinolite and chlorite behind K-feldspar suggest a top-to-the SE sense of shear. The deformation temperature for greenschists could not be well constrained by geothermometry. Lower deformation temperatures for greenschist facies deformation in the study area than for the Akoumianos Greenschist from the area west of Melambes (400–560°C; Martha et al. Reference Martha, Dörr, Gerdes, Krahl, Linckens and Zulauf2017) are indicated by the very low anorthite content in plagioclase.
Except for serpentinite, all rock types from the Asterousia-type section show evidence of significant changes in both the degree of deformation and the finite strain. The oldest deformation event recognized is preserved in the form of an internal foliation (Si) in garnet porphyroblasts inside chiastolite hornfels. These garnet porphyroblasts must have grown after development of Si = S1 (Fig. 13). Chessboard-type subgrains in quartz of calcsilicate rock and chiastolite hornfels indicate high-temperature deformation (Kruhl, Reference Kruhl1996). Furthermore, large and slightly polygonal quartz grains with contacts tending to form triple junctions suggest grain boundary area reduction, which is also a characteristic feature at T >620°C (Buntebarth & Voll, Reference Buntebarth, Voll, Voll, Töpel, Pattison and Seifert1991). Undulatory extinction in K-feldspar from chiastolite hornfels, kinking and deformation twinning in plagioclase from orthoamphibolite, and fracturing of diopside inside calcsilicate rock should likewise have developed at T >650°C. Moreover, shape-preferred orientation of biotite in chiastolite hornfels should have been developed during amphibolite facies shearing (D2) in the muscovite-out field. Garnet porphyroblasts imply rotation during syntectonic growth. Seidel et al. (Reference Seidel, Okrusch, Kreuzer, Raschka and Harre1981) constrained metamorphic conditions for D2 using thin-sections of rocks from the area south of the Dikti Mountains (area south and SW of Pefkos) and from other ACC exposures on Crete at P = 400–500 MPa and T max = 700°C (Fig. 14, field A). The P–T estimates of Seidel et al. (Reference Seidel, Okrusch, Kreuzer, Raschka and Harre1981) were later confirmed by Langosch (Reference Langosch1999) applying geothermobarometry on Asterousia-type metamorphic rocks from the Melambes area, the western Asterousia Mountains and the Kritsa area (central and eastern Crete). P–T estimates by Seidel et al. (Reference Seidel, Okrusch, Kreuzer, Raschka and Harre1981) are also consistent with our observations on the Asterousia-type rocks from the study area. Although the P–T conditions are partly in the field of partial melting for the mineral assemblage observed in the metapelitic rocks, Seidel et al. (Reference Seidel, Okrusch, Kreuzer, Raschka and Harre1976, Reference Seidel, Okrusch, Kreuzer, Raschka and Harre1981) and Langosch (Reference Langosch1999) argued that the PH20/Pfl ratio must have been <1, leading to an increase of the melting temperature. This is confirmed by the lack of evidence for anataxis in the rocks and by the high amount of graphite within the metapelitic rocks. An amphibolite facies top-to-the SE sense of shear for D2 in the study area is inferred from plagioclase σ-clasts and asymmetric pressure shadows of plagioclase in orthoamphibolite.
Crystallization–deformation diagram for chiastolite hornfels and garnet-micaschist with respect to deformation (D) and intertectonic (I) stages. Stability of phases not observed but presumed is shown in grey. Orange indicates growth of phases. Plagioclase and quartz are not indicated.

Petrogenetic grid with isopleths of key metamorphic reactions in metapelitic rocks according to the KFMASH system of Spear & Cheney (Reference Spear and Cheney1989) based on thermodynamic data of Berman, Brown & Greenwood (Reference Berman, Brown and Greenwood1985) and Berman (Reference Berman1988). Isopleths for the Si content per formula unit in phengitic white mica (green dashed lines) after Massonne & Schreyer (Reference Massonne and Schreyer1987) and assuming the limiting assemblage K-feldspar–phlogopite (biotite)–quartz–phengite (white mica). Analyses with high pyrophyllite content (see Fig. 10a) were not considered. Isopleths for the Mg number (XMg) of cordierite (brown dotted lines) and of garnet (violet dotted line) after Aranovich & Podlesskii (Reference Aranovich, Podlesskii and Saxena1983) and assuming the limiting assemblage garnet–sillimanite–quartz–cordierite. Hashed lines indicate P–T estimations. A, high-temperature – low-pressure metamorphism of the ACC according to Seidel et al. (Reference Seidel, Okrusch, Kreuzer, Raschka and Harre1981), corresponding to D2; B, growth of chiastolite in chiastolite hornfels during contact metamorphism at the end of I2–3 deduced from XMg in cordierite and garnet of garnet-micaschist (online supplementary Table S6) and results of garnet–biotite gethermometry (Table 1); C, growth of white mica deduced from Si content in phengitic white mica (online supplementary Tables S4–S6). Grey arrows indicate the inferred P–T path. Mineral abbreviations according to Kretz (Reference Kretz1983).

The growth of graphite-bearing andalusite grains (chiastolite) in chiastolite hornfels and of garnet porphyroblasts inside garnet-micaschist intercalated with chiastolite hornfels near Agia Triada post-dates the S2-foliation (Fig. 13). Garnet–biotite geothermometry and application of the geothermobarometer of Aranovich & Podlesskii (Reference Aranovich, Podlesskii and Saxena1983) on garnet-micaschist yielded P–T conditions at T = 550–600°C and P ~ 200 MPa for this event (Fig. 14, field B). The growth of chiastolite and medium temperature at low pressure are characteristic for medium-grade contact metamorphism adjacent to an intrusive body emplaced at upper structural levels (<10 km), while the local occurrence of garnet in micaschist intercalations indicates a closer proximity to the pluton. The presence of a nearby pluton is consistent with the 206Pb/238U ages of one zircon grain from chiastolite hornfels. These granitoids have either been eroded or are present at slightly deeper levels with respect to the recent exposures of the ACC-type rocks. Cordierite, which is typically found along with chiastolite in chiastolite hornfels, was not observed. However, cordierite was found in one sample of garnet-micaschist intercalated with chiastolite hornfels and should likewise have formed during contact metamorphism. We therefore assume a post-D2 static period with no significant strain, but with intrusion of granitoids in its late stages that induced growth of new phases in the contact aureole. Andalusite might have formed at the expense of previously stable sillimanite (Fig. 13).
Pressure shadows of biotite and quartz behind chiastolite as well as boudinage of chiastolite grains and marginal drag observed in some chiastolite grains indicate that subsequent deformation (D3) affected chiastolite hornfels during the waning stage of chiastolite growth. Asymmetric pressure shadows behind chiastolite indicate a top-to-the SE sense of shear during D3. Quartz in chiastolite hornfels did not recrystallize during D3, probably because strain was not high enough. White mica in both chiastolite hornfels and micaschist is present as cross-mica, which shows no relation to any pre-existing fabric. Since white mica was not deformed, it should have grown post-kinematically with respect to the previously described deformation events (D1–3). White mica must have formed during retrograde metamorphism subsequent to D3 under static conditions at the expense of biotite and garnet, and probably cordierite. Chlorite and epidote should likewise have formed during retrograde metamorphism (Fig. 13). Taking into consideration the fact that the Si values of phengitic white mica are very low (3.08±0.01 p.f.u.) and that retrograde metamorphism should have taken place in the stability fields of chlorite and epidote, the growth of white mica should have taken place at T max = 500°C and P max = 220 MPa (Fig. 14, field C).
5.d. Timing of shearing and regional implications
The oldest deformation event in the ACC-type rocks (D1) is preserved in the form of an internal foliation (Si = S1) in garnet porphyroblasts. However, the conditions, age and kinematics of this deformation stage are unknown. Subsequent D2 top-to-the SE shearing must have taken place at deep structural levels and must be older than the middle to late Campanian intrusion of granitoids inside the ACC (Martha et al. Reference Martha, Dörr, Gerdes, Krahl, Linckens and Zulauf2017). Although (meta)granitoids are lacking in the study area, petrographic observations of chiastolite hornfels, garnet-micaschist and contact metamorphic zircon from chiastolite hornfels provide evidence for the development of a contact aureole around granitoid intrusions. This finding compares well with the situation in the Pachia Ammos area, where contact metamorphism related to Asterousia-type intrusions is revealed by an increasing grain size of calcite in the surrounding rock (marble) with decreasing distance from a dioritic intrusion (Kneuker et al. Reference Kneuker, Dörr, Petschick and Zulauf2015). The ACC in eastern Crete (study area and exposures in the northern Ierapetra Graben) should therefore have faced uplift and exhumation to upper crustal levels following peak metamorphic conditions (D2). Furthermore, the rock sequence must have cooled down to the point that contact-metamorphic heating could trigger the growth of new phases under lower-pressure conditions compared to the metamorphic peak.
In the Asterousia-type rocks west of Melambes (central Crete) and on Anafi a contact aureole in the country rocks of granitoids was not observed. In these cases, granitoid intrusion took place at much deeper structural levels, where the country rocks were undergoing amphibolite facies conditions (Martha et al. Reference Martha, Dörr, Gerdes, Petschick, Schastok, Xypolias and Zulauf2016, Reference Martha, Dörr, Gerdes, Krahl, Linckens and Zulauf2017). Geochronological data suggest that the metasedimentary succession of the ACC on Crete and in the Cyclades was intruded by granitoids at 80–72 Ma (Be'eri-Shlevin, Avigad & Matthews, Reference Be'eri-Shlevin, Avigad and Matthews2009; Kneuker et al. Reference Kneuker, Dörr, Petschick and Zulauf2015; Martha et al. Reference Martha, Dörr, Gerdes, Petschick, Schastok, Xypolias and Zulauf2016, Reference Martha, Dörr, Gerdes, Krahl, Linckens and Zulauf2017) (Fig. 15). These U–Pb ages are in line with the concordia age calculated for zircon from chiastolite hornfels in the study area (74±2 Ma). In the area south of the Dikti Mountains, the growth of chiastolite, which post-dates D2 top-to-the SE shearing and pre-dates the main phase of D3 top-to-the SE shearing, should therefore be late Campanian in age. In the Pachia Ammos area, Kneuker et al. (Reference Kneuker, Dörr, Petschick and Zulauf2015) found no evidence for post-intrusive ductile top-to-the SE shearing of the granitoids, while in the Melambes area top-to-the SE shearing is responsible for transforming the granitoids into orthogneiss and metadiorite (Martha et al. Reference Martha, Dörr, Gerdes, Krahl, Linckens and Zulauf2017). The ACC-type rocks south of the Dikti Mountains are therefore considered to occupy an intermediate position between the deep-level exposures in the Melambes area and the shallow-level exposures of the northern Ierapetra Graben.
Scatter chart summarizing radiometric age data from the Uppermost Unit of Crete and Anafi. Data sources: 1, Lippolt & Baranyi (Reference Lippolt and Baranyi1976); 2, Seidel et al. (Reference Seidel, Okrusch, Kreuzer, Raschka and Harre1976); 3, Seidel et al. (Reference Seidel, Okrusch, Kreuzer, Raschka and Harre1981); 4, Reinecke et al. (Reference Reinecke, Altherr, Hartung, Hatzipanagiotou, Kreuzer, Harre, Klein, Keller, Geenen and Böger1982); 5, Langosch et al. (Reference Langosch, Seidel, Stosch and Okrusch2000); 6, Be'eri-Shlevin, Avigad & Matthews (Reference Be'eri-Shlevin, Avigad and Matthews2009); 7, Kneuker et al. (Reference Kneuker, Dörr, Petschick and Zulauf2015); 8, Martha et al. (Reference Martha, Dörr, Gerdes, Petschick, Schastok, Xypolias and Zulauf2016); 9, Martha et al. (Reference Martha, Dörr, Gerdes, Krahl, Linckens and Zulauf2017); 10, this study. Data from Lippolt & Baranyi (Reference Lippolt and Baranyi1976) and Seidel et al. (Reference Seidel, Okrusch, Kreuzer, Raschka and Harre1976) were recalculated in Seidel et al. (Reference Seidel, Okrusch, Kreuzer, Raschka and Harre1981). For convenience, no analyses with error margins >3.0 Ma are included, except for one age obtained from the Anafi Greenschist after Reinecke et al. (Reference Reinecke, Altherr, Hartung, Hatzipanagiotou, Kreuzer, Harre, Klein, Keller, Geenen and Böger1982).

The ACC-type rocks south of the Dikti Mountains cooled down below the closure temperatures of hornblende (530±40°C; Harrison, Reference Harrison1981) and biotite (310±30°C; Harrison, Duncan & McDougall, Reference Harrison, Duncan and McDougall1985) during the Maastrichtian. Orthoamphibolite from the Viannos Municipality yielded K–Ar hornblende ages of 66.3±2.9 Ma to 68.6±1.9 Ma (Seidel et al. Reference Seidel, Okrusch, Kreuzer, Raschka and Harre1976, Reference Seidel, Okrusch, Kreuzer, Raschka and Harre1981), while sillimanite-bearing micaschist yielded K–Ar biotite ages of 68.3±0.9 Ma to 68.8±0.9 Ma (Seidel et al. Reference Seidel, Okrusch, Kreuzer, Raschka and Harre1981). These ages compare well with K–Ar biotite and hornblende cooling ages from the Asterousia Crystalline Complex on Crete and Anafi (Fig. 15). Growth of white mica, chlorite and epidote in chiastolite hornfels and micaschist should have occurred during Maastrichtian cooling and retrograde metamorphism of the ACC.
5.e. Geodynamic implications
The origin and geodynamic evolution of the Uppermost Unit as a whole and especially of the ACC is still contentious. 206Pb/238U ages of Asterousia-type granitoids compare well with ID-TIMS, LA-ICP-MS and SIMS ages ranging over 92–78 Ma (e.g. von Quadt et al. Reference von Quadt, Peytcheva, Heinrich, Cvetković, Banjesević and Andrew2007) of granitoids from the Apuseni–Banat–Timok–Srednogorie Belt in southeastern Europe and the Pontides in northern Anatolia (see also Martha et al. Reference Martha, Dörr, Gerdes, Petschick, Schastok, Xypolias and Zulauf2016), suggesting a possible origin of the ACC from north of the Vardar–Izmir–Ankara suture zone. It can therefore be assumed that the ACC-type rocks were transported southwards and emplaced on top of the Cycladic Blueschist Unit and the Cretan nappe pile during late Eocene to Oligocene time following the Late Cretaceous to early Eocene closure of the Neotethys due to the collision of the Sakarya–Pontide Block with the Anatolide–Tauride Platform (e.g. Thomson, Stöckhert & Brix, Reference Thomson, Stöckhert and Brix1998; Okay, Reference Okay2008). However, the lack of amphibolite facies metamorphic host rocks for granitoids from the Apuseni–Banat–Timok–Srednogorie Belt and the Pontides makes such a scenario questionable; further studies are needed to unravel a possible correlation of the Asterousia-type rocks with the Apuseni–Banat–Timok–Srednogorie Belt and the Pontides. For this reason, we adopt the geodynamic model presented in Martha et al. (Reference Martha, Dörr, Gerdes, Krahl, Linckens and Zulauf2017) that suggests a second magmatic arc along the southern margin of the Pelagonian–Lycian Block following the subduction of the Pindos Ocean underneath Pelagonia–Lycia, probably starting during mid-Late Cretaceous time.
In the model of Martha et al. (Reference Martha, Dörr, Gerdes, Krahl, Linckens and Zulauf2017), progressive subduction of the Pindos Ocean and collision led to thickening of the upper plate accompanied by D2 SE-directed thrusting under amphibolite facies conditions. This event pre-dates middle to late Campanian intrusion of granitoids that occurred within a magmatic arc setting along the southern margin of the Pelagonian–Lycian Block (Martha et al. Reference Martha, Dörr, Gerdes, Krahl, Linckens and Zulauf2017). The different evolution of Asterousia-type rocks from central and eastern Crete following the intrusion of Campanian granitoids is of particular interest. D3 top-to-the SE shearing is known from the area west of Melambes (Martha et al. Reference Martha, Dörr, Gerdes, Petschick, Schastok, Xypolias and Zulauf2016) and from the present study area, while in the Pachia Ammos area post-intrusive deformation has been brittle (Kneuker et al. Reference Kneuker, Dörr, Petschick and Zulauf2015). Pressure constraints show that post-intrusive contact metamorphism and ductile shearing occurred at upper structural levels in the study area (see Section 5.c). This suggests an E–W-aligned metamorphic field gradient for Crete that resulted from stronger uplift and exhumation of the ACC-type rocks of eastern Crete. Such an E–W-aligned metamorphic field gradient is also known for late Oligocene to early Miocene subduction-related metamorphism of the lower Cretan nappe system. P–T estimates for the Phyllite-Quartzite Unit sensu lato from western Crete (P = 800–1700 MPa; T = 350–450°C) indicate a stronger metamorphic overprint than for exposures from eastern Crete (P = 400–800 MPa; T = 250–350°C) (e.g. Seidel, Kreuzer & Harre, Reference Seidel, Kreuzer and Harre1982; Franz, Reference Franz1992; Theye, Seidel & Vidal, Reference Theye, Seidel and Vidal1992; Brix et al. Reference Brix, Stöckhert, Seidel, Theye, Thomson and Küster2002; Zulauf et al. Reference Zulauf, Kowalczyk, Krahl, Petschick and Schwanz2002). The metamorphic field gradient for the Phyllite-Quartzite Unit sensu lato shows the same direction as that observed in the Uppermost Unit on Crete. The related westwards crustal tilting of both nappe systems occurred at strikingly different times, however; the field gradient on Crete already existed when granitoids intruded the ACC. The tectonic processes behind stronger uplift and exhumation of the ACC-type rocks of eastern Crete need further investigation.
Stacking of units commenced with top-to-the SE shearing of the ACC on top of the Theodorii Greenschist that formed the northern margin of the Pindos realm (see also Martha et al. Reference Martha, Dörr, Gerdes, Krahl, Linckens and Zulauf2017). K–Ar actinolite data from the comparable Anafi Greenschist yielded cooling ages of 58.9±3.4 Ma to 61.8±3.0 Ma. The closure temperature of actinolite (470±25°C; Dahl, Reference Dahl1996) is close to the peak temperature of greenschist facies metamorphism. This is why greenschist facies top-to-the SE shearing should be middle to late Paleocene in age. Subsequent exhumation and ongoing top-to-the SE movement led to prehnite-pumpellyite facies thrusting of the Theodorii Greenschist and the ACC-type rocks on top of the Arvi Unit. Prehnite-pumpellyite facies metamorphism and top-to-the SE shearing of the Arvi Unit has not been dated, but must be younger than the Maastrichtian fossils of the Arvi metalimestones (Tataris, Reference Tataris1964).
The age of thrusting of the Uppermost Unit on top of the Pindos Unit should be latest Eocene or earliest Oligocene considering the age of the Pindos flysch and apatite fission-track ages, proving collective cooling down of the Pindos and Uppermost units (Thomson et al. Reference Thomson, Stöckhert and Brix1998; Thomson, Stöckhert & Brix, Reference Thomson, Stöckhert, Brix, Ring, Brandon, Lister and Willett1999). The Pindos flysch compares well with the flysch sequences from the area west of Melambes and on Anafi, where brittle top-to-the SE kinematics during late Eocene time have been constrained for thrusting of the Uppermost Unit on top of the Pindos Unit (Martha et al. Reference Martha, Dörr, Gerdes, Petschick, Schastok, Xypolias and Zulauf2016). NE–SW-trending striation on brittle shear planes in quartzite and SW-vergent folds observed in the Uppermost Unit are correlated with W(SW)-vergent folds found in the Pindos flysch south of Sykologos, and indicate a mutual evolution of the Uppermost and Pindos units. The shear zone striation can be correlated with NNE–SSW- to NE–SW-directed shortening related to strike-slip movements reported by Kneuker et al. (Reference Kneuker, Dörr, Petschick and Zulauf2015) from brittle faulting of diorite and quartzdiorite from the ACC in the Pachia Ammos area (northern Ierapetra Graben). Furthermore, Tortorici et al. (Reference Tortorici, Catalano, Cirrincione and Tortorici2012) reported semi-brittle to brittle top-to-the SSW structures from the Uppermost Unit west of Melambes and in the Ardaktos Graben. NE–SW shortening affecting the Uppermost and Pindos units took place at upper crustal levels, and might have resulted from crustal shortening following a change in direction of nappe movement during late Eocene time (Aravadinou et al. Reference Aravadinou, Xypolias, Chatzaras, Iliopoulos and Gerogiannis2016).
6. Conclusions
Based on our new geological map and the data presented above, the following conclusions are drawn.
(1) The Uppermost Unit south of the Dikti Mountains consists of the Arvi Unit at the base, the Theodorii Greenschist in the middle and the ACC-type rocks on top. The ACC-type rocks show evidence for polyphase metamorphism and deformation.
(2) ACC-type metasedimentary rocks are affected by contact metamorphism, which is attributed to a non-exposed pluton. The age of the intrusion and contact metamorphism (74±2 Ma) is compatible with published intrusion ages from other areas.
(3) The ACC-type rocks underwent polyphase metamorphism and deformation with at least three ductile deformation phases: D1 with unknown kinematics and conditions; pre-middle Campanian amphibolite facies D2 top-to-the SE shearing, which led to the dominant foliation (S2); and D3 top-to-the SE shearing, which started during the late phase of Campanian intrusions and related contact metamorphism.
(4) SE-directed thrusting emplaced the ACC-type rocks on top of the Theodorii Greenschist under greenschist facies conditions. Thrusting of the ACC-type rocks and the Theodorii Greenschist on top of the Arvi Unit occurred under prehnite-pumellyite facies conditions and is also associated with top-to-the SE kinematics. This compares well with the shear sense inferred from exposures of comparable rocks in the area west of Melambes and on Anafi.
(5) ‘Tilting’ of the ACC-type rocks responsible for the E–W-directed metamorphic field gradient should have been established prior to middle to late Campanian intrusion of granitoids.
(6) Further studies should focus on a possible correlation of the ACC with the Apuseni–Banat–Timok–Srednogorie Belt and the Pontides, a magmatic arc with contemporaneous intrusion of granitoids.
Acknowledgements
We are grateful to Maria Bladt and Nils Prawitz for help with thin-section production, Rainer Petschick for assistance with XRD analysis, Heidi Höfer and Markus Schölmerich for support with EMP analysis and Linda Marko for help with isotopic analyses (all Goethe-University Frankfurt). Benoît Dubacq (Paris), Petek Ayda Ustaömer (Istanbul) and the executive editor Olivier Lacombe (Paris) are thanked for helpful and constructive reviews and comments on the manuscript. The first author gratefully acknowledges financial support for fieldwork by ERASMUS (Leonardo-da-Vinci programme; grant agreement no. 2013-1-DE2-LEO02-16568) and JJB and PMN acknowledge financial support for geological mapping from the Vereinigung von Freunden und Förderern der Goethe-Universität Frankfurt.
Supplementary material
To view supplementary material for this article, please visit https://doi.org/10.1017/S0016756818000328