I. INTRODUCTION
New materials must be developed to enable changing from fossil fuel to hydrogen or solar oriented technologies. In the case of hydrogen technology, a large outstanding issue is storage capacity. There are several storage options to consider: gas, cryogenic liquid, physisorbed on large surface area structures, metal hydrides, complex hydrides, and chemical hydrides. Many metals and alloys are abundant, and relatively cheap and can contain a high-volume density of hydrogen, e.g., Mg–Ni, La–Ni, Na–Al, Li–Al, and Cr–V–Ti–Zr. The latter, Cr–V–Ti–Zr is a quaternary system and shows interesting advantages for hydrogen storage. The ternary Cr–Ti–V system has been used previously as hydrogen storage material. However, Cho et al. Reference Cho, Han, Park and Akiba1 showed that replacement of Ti atoms by Zr improved hydrogen storage. In addition to substituting Zr, Cho et al. Reference Cho, Han, Park and Akiba1 modified the composition ratio of Ti to Cr.
For hydrogen storage, AB2 Laves phase alloys are particularly promising materials. ZrV2, ZrCr2, and ZrFe2 were first proposed as Laves phases for hydrogen storage. Reference Shaltiel, Jacob and Davidov2 However, subsequent study has shown that increasing the vapor pressure of Zr based Laves phase alloys can be done without reducing absorption capacity. This can be achieved by partial substitution of the A or B element with transition elements, such as Ti, Cr, Ni, and Cu. Reference Ivey and Northwood3 An understanding of the appropriate phase diagram is very helpful, if not necessary. Since all candidate elements, i.e., Ti, Zr, Fe, and Cr, have quite high melting temperatures, experimental investigations based on phase equilibria will be time consuming due to long equilibration times. The Calphad Reference Kaufman and Bernstein4 method allows extension of the phase diagrams beyond areas accessible by available experimental data. In this work two ternary systems, Cr–Ti–Zr and Fe–Ti–Zr, were thermodynamically described using the Calphad approach.
II. LITERATURE REVIEW
The Cr–Zr binary system was recently described thermodynamically by Pavlu et al., Reference Pavlu, Vrestal and Sob5 who used a combination of first principle calculation Reference Kresse and Furthmüller6 and classical Calphad Reference Kaufman and Bernstein4 methods. For their work, they used the experimental phase diagram data from Domagala et al., Reference Domagala, McPherson and Hansen7 Gebhart et al., Reference Gebhart, Rexer and Petzow8 Budberg et al., Reference Budberg, Alisova and Musaev9 Rumball and Elder, Reference Rumball and Elder10 Svernikov and Spektor, Reference Svechnikov and Spektor11 and Petkov et al. Reference Petkov, Prima, Tretyachenkov and Kocherzhinskij12 The experimental data described liquidus line, invariant reactions, and single and binary regions. Unfortunately, there is no thermodynamic data available for this binary system. The Cr–Zr system was optimized earlier by Zeng et al. Reference Zeng, Hämäläinen and Luoma13,Reference Zeng, Hämäläinen and Lilius14
Pavlu et al. Reference Pavlu, Vrestal and Sob15 also optimized the Cr–Ti system using the same combination of ab initio and Calphad methods. For the Cr–Ti assessment they used experimental data from Carlson and Alexander, Reference Carlson and Alexander16 Svechnikov et al., Reference Svechnikov, Shurin and Dmitrijeva17,Reference Svechnikov, Teslyuk, Kocherzhinsky, Petkov and Dabizha18 McQuilian, Reference McQuillan19,Reference McQuillan20 Cuff et al., Reference Cuff, Grant and Floe21 Duwez and Taylor, Reference Duwez and Taylor22 van Thyne et al., Reference van Thyne, Kessler and Hansen23 Bagarjatskij et al., Reference Bagarjatskij, Nosova and Tagunova24 Ermanis et al., Reference Ermanis, Farrar and Argolin25 Mikheev and Alekasashin, Reference Mikheev and Alekasashin26 Farrar and Margolin, Reference Farrar and Margolin27 and Minayeva et al. Reference Minayeva, Budberg and Gavze28 These experimental data describe liquidus and solidus lines, phase boundaries, invariant reactions, and single and binary regions. As with the Cr–Zr system, no thermodynamic data is available for Cr–Ti. The system was also critically assessed by Zhuang et al. Reference Zhuang, Shen, Liu, Ling, Shang, Du and Schuster29
The Fe–Zr system was optimized by Jiang et al. Reference Jiang, Oikawa, Ikeshoji, Wulff and Ishida30 using the Calphad method, and thermodynamic data, i.e., mixing enthalpy for the liquid phase at different temperatures, from Sudavstvova et al., Reference Sudavtsova, Kurach and Batalin31 Sidorov et al., Reference Sidorov, Valishev, Esin and Gel’d32 Wang et al., Reference Wang, Luck and Predel33 and Rosner-Kuhn et al. Reference Rosner-Kuhn, Qin, Schaefers, Thiedemann and Frohberg34 Jiang et al. also used phase equilibrium data, such as liquidus and solidus lines, single and binary phase regions, and invariant reactions, from Svechnikov and Spector, Reference Svechnikov and Spector35,Reference Svechnikov and Spektor36 Abrahamson and Lopata, Reference Abrahamson and Lopata37 Malakhova and Alexeyeva, Reference Malakhova and Alekseyeva38 Malakhova and Kobylkin, Reference Malakhova and Kobylkin39 Tanner and Levinson, Reference Tanner and Levinson40 Stupel et al., Reference Stupel, Bamberger and Weiss41 Aubertin et al., Reference Aubertin, Gonser, Campbell and Wagner42 Borrelly et al., Reference Borrelly, Merle and Adami43 and Servant et al. Reference Servant, Gueneau and Ansara44
The binary Zr–Ti system was thermodynamically assessed by Kumar et al. Reference Hari Kumar, Wollants and Delaey45 using limited thermochemical data from Auffredic et al. Reference Auffredic, Etchessahar and Debuigne46 ; Blacktop et al., Reference Blacktop, Crangle and Argent47 who measured heat of BCC_A2 to HCP_A3 transformation; Peyzulayev et al., Reference Peyzulayev, Sumin, Bykov and Popova48 who measured activity of Ti in liquid phase; and Zee et al., Reference Zee, Watters and Davidson49 who determined vapor pressure of Ti over rich Zr liquid. Kumar et al. Reference Hari Kumar, Wollants and Delaey45 also used phase diagram information such as single and binary phase regions, liquidus and solidus lines from Rudy, Reference Rudy50 Farrar and Adler, Reference Farrar and Adler51 Chatterji et al., Reference Chatterji, Hepworth and Hruska52 Etchessahar and Debuigne, Reference Etchessahar and Debuigne53 Blaktop at al., Reference Blacktop, Crangle and Argent47 and Auffredic et al. Reference Auffredic, Etchessahar and Debuigne46
The Fe–Ti system was thermodynamically assessed by Dumitrescu et al., Reference Dumitrescu, Hillert and Saunders54 where they discussed five Fe–Ti system assessments from Murray, Reference Murray and Murray55 Balasubramanian, Reference Balasubramanian56 Kumar et al., Reference Hari Kumar, Wollants and Delaey57 Jonsson, Reference Jonsson58 and Rand, 59 and proposed their own optimization based on available experimental data. Their optimization used thermochemical data from Kubaschewski and Dench, Reference Kubaschewski and Dench60 Fruehan, Reference Fruehan61 Dyubanov et al., Reference Dyubanov, Stomakhin and Filippov62 Furukawa and Kato, Reference Furukawa and Kato63 Robinson and Argent, Reference Robinson and Argent64 Esin et al., Reference Esin, Valishev, Ermakov, Geld and Petrushevskii65 Gachon et al., Reference Gachon, Notin and Hertz66 Wang et al., Reference Wang, Luck and Predel67 and Dinsdale et al. 68 ; and phase diagram information from McQuillan, Reference McQuillan69 van Thyne et al., Reference van Thyne, Kessler and Hansen23 Hellawall and Hume-Rothery, Reference Hellawell and Hume-Rothery70 Murakami et al., Reference Murakami, Kimura and Nishimura71 Speich, Reference Speich72 Abrahamson and Lopata, Reference Abrahamson and Lopata37 Booker, Reference Booker73 Ko and Nishizawa, Reference Ko and Nishizawa74 Dew-Hughes, Reference Dew-Hughes75 Ramnaekers et al., Reference Ramnaekers, van Loo and Bastion76 Kivilahti and Tarasova, Reference Kivilahti and Tarasova77 and Qiu and Jin. Reference Qiu and Jin78
Literature about the Cr–Ti–Zr and Fe–Ti–Zr ternaries is scarce. The Fe–Ti–Zr system was investigated by Zhou et al. Reference Zhou, Jin, Liu, Liu and Jin79,Reference Zhou, Zeng and Liu80 who provided isothermal sections at 1173 K and at 1023 K. The data was summarized by Raghavan. Reference Raghavan81 Zhou et al. Reference Zhou, Jin, Liu, Liu and Jin79,Reference Zhou, Zeng and Liu80 do not match the thermodynamic description by Jiang et al., Reference Jiang, Oikawa, Ikeshoji, Wulff and Ishida30 because the stability of intermetallic compounds, FeZr2 and FeZr3, from Zhou et al. Reference Zhou, Jin, Liu, Liu and Jin79,Reference Zhou, Zeng and Liu80 differs from those of Jiang et al. Reference Jiang, Oikawa, Ikeshoji, Wulff and Ishida30 However, Zhou et al.’s experimental results agree with recent investigations by Stein et al. Reference Stein, Sauthoff and Palm82 There is no available liquidus projection of the Fe–Ti–Zr system.
A similar situation holds for the Cr–Ti–Zr system, where only two works are available. Kornilov et al. Reference Kornilov, Belousov and Musayev83 determined isothermal sections of Cr–Ti–Zr system at 1673, 1073, and 923 K, and Musayev et al. Reference Musayev, Kornilov and Belousov84 provided a liquidus projection of Cr–Ti–Zr. There is no available thermochemical data for either Fe–Ti–Zr or Cr–Ti–Zr.
III. THERMODYNAMIC MODELS
Seven phases are involved in the optimization: BCC_A2, FCC_A1, HCP_A3, Laves_C14, Laves_C15, Laves_C36, and liquid. Table I shows the detailed description of their crystal structures.
Crystal structures of phases in Cr–Ti–Zr and Fe–Ti–Zr systems. 92

The Gibbs free energy of pure elements with respect to temperature is
 ${}^0{G_i}\left( T \right) = {G_i}\left( T \right) - H_i^{{\rm{SER}}}$
, which can be expressed as
 $${}^0{G_i}\left( T \right) = a + bT + cT\ln \left( T \right) + d{T^2} + e{T^{ - 1}} + f{T^3} + i{T^4} + j{T^7} + k{T^{ - 9}}\quad ,$$
where
 ${}^0{G_i}\left( T \right)$
is the constant enthalpy of the standard element reference,
 $H_i^{{\rm{SER}}}$
, at 298.15 K and 1 bar, as recommended by Scientific Group Thermodata Europe (SGTE),
85
T is an absolute temperature, a, b, …, k are coefficients. The reference states are BCC_A2 (Cr), (Fe) and (V), and HCP_A3 (Zr).
 ${}^0{G_i}\left( T \right)$
may be derived for several temperature ranges, where the coefficients a, b, c, d, e, f, i, j, and k have different values. The specific
 ${}^0{G_i}\left( T \right)$
functions are taken from SGTE Unary (Pure elements) TDB v.5.
85
A. Substitutional solutions
Solid and liquid solution phases (liquid, FCC_A1, HCP_A3, BCC_A2) are described by the substitution solution model, Reference Guggenheim86
 $${G_m}( T ) = \sum\limits_i {{x_i}{}^0{G_i}( T ) + RT\sum\limits_i {{x_i}\ln ( {{x_i}} )} + \sum\limits_i {\sum\limits_{j > i} {{x_i}{x_j}} \bigg( {\sum\limits_v {{}^v{L_{ij}}{{\big( {{x_i} - {x_j}} \big)}^v}} } \bigg)} } \quad ,$$
where x
i
is mole fraction of element i,
 ${}^0{G_i}\left( T \right)$
is Gibbs energy of element i in the given phase, R is gas constant, T is an absolute temperature and
v
L
ij
is interaction parameter. The first term in Eq. (2) represents Gibbs energy of unmixed elements, the second one is Gibbs energy of ideal mixing and the third one,
 $\sum\limits_i {\sum\limits_{j > i} {{x_i}{x_j}} \left( {\sum\limits_v {{}^v{L_{ij}}{{\left( {{x_i} - {x_j}} \right)}^v}} } \right)}$
, is the Redlich–Kister polynomial for excess Gibbs free energy.
B. Laves_C36 and Laves_C14
The Laves_C36 and Laves_C14 phases were described by a three sublattice model, (A,B)4:(A,B)6:A2, following Saunders and Miodownik Reference Saunders and Miodownik87 and Hillert and Steffansson, Reference Hillert and Steffansson88 as this is the most suitable model to describe the atomic arrangement in the C36 and C14 phases. Therefore, the Gibbs energy is
 $$\eqalignb{ G_m^{{\rm{Laves}}} = Y_{\rm{A}}^{\rm{I}}Y_{\rm{A}}^{{\rm{II}}}Y_{\rm{A}}^{{\rm{III}}} + Y_{\rm{A}}^{\rm{I}}Y_{\rm{B}}^{{\rm{II}}}Y_{\rm{A}}^{{\rm{III}}} + Y_{\rm{B}}^{\rm{I}}Y_{\rm{A}}^{{\rm{II}}}Y_{\rm{A}}^{{\rm{III}}} + Y_{\rm{B}}^{\rm{I}}Y_{\rm{B}}^{{\rm{II}}}Y_{\rm{A}}^{{\rm{III}}} + 0.33RT\left( {Y_{\rm{A}}^{\rm{I}}\ln Y_{\rm{A}}^{\rm{I}} + Y_{\rm{B}}^{\rm{I}}\ln Y_{\rm{B}}^{\rm{I}}} \right) + 0.5RT\left( {Y_{\rm{A}}^{\rm{I}}\ln Y_{\rm{A}}^{\rm{I}} + Y_{\rm{B}}^{\rm{I}}\ln Y_{\rm{B}}^{\rm{I}}} \right) + {}^{xs}{G^{{\rm{Laves}}}}\quad ,}$$
where Y i n represents site fraction of element i on sublattice n, R represents gas constant, and T represents an absolute temperature. The first four terms represent Gibbs energy of end members, the fifth and sixth terms represent Gibbs energy of mechanical mixing, and the last one represents Gibbs energy of excess.
C. Laves_C15
The Laves_C15 phase was described by a two sublattice model, (A,B)2:(A,B), following Saunders and Miodownik Reference Saunders and Miodownik87 and Hillert and Steffansson. Reference Hillert and Steffansson88 The Gibbs energy is
 $$G_m^{{\rm{Laves}}} = Y_{\rm{A}}^{\rm{I}}Y_{\rm{A}}^{{\rm{II}}} + Y_{\rm{A}}^{\rm{I}}Y_{\rm{B}}^{{\rm{II}}} + Y_{\rm{B}}^{\rm{I}}Y_{\rm{A}}^{{\rm{II}}} + Y_{\rm{B}}^{\rm{I}}Y_{\rm{B}}^{{\rm{II}}} + 0.67RT\left( {Y_{\rm{A}}^{\rm{I}}{\rm{ln}}Y_{\rm{A}}^{\rm{I}} + Y_{\rm{B}}^{\rm{I}}{\rm{ln}}Y_{\rm{B}}^{\rm{I}}} \right) + 0.33RT\left( {Y_{\rm{A}}^{\rm{I}}{\rm{ln}}Y_{\rm{A}}^{\rm{I}} + Y_{\rm{B}}^{\rm{I}}{\rm{ln}}Y_{\rm{B}}^{\rm{I}}} \right) + {}^{xs}{G^{{\rm{Laves}}}}\quad ,}$$
where Y i n represents site fraction of element i on sublattice n, R represents gas constant and T represents an absolute temperature. The first three terms represent Gibbs energy of end members, the fourth and fifth represent the Gibbs energy of mechanical mixing, and the last one represents the Gibbs energy of excess.
IV. OPTIMIZATION
The thermodynamic parameters for all phases in the system were optimized using ThermoCalc Reference Andersson, Helander, Hoglund, Shi and Sundman89 and Pandat software, Reference Chen, Daniel, Zhang, Chang, Yan, Xie, Schmid-Fetzer and Oates90 using thermodynamic data for the liquid phase and phase equilibrium were used. Each of the selected data was given a weight based on experimental uncertainty. Optimization was performed step wise following Schmid-Fetzer et al. Reference Schmid-Fetzer, Andersson, Chevalier, Eleno, Fabrichnaya, Kattner, Sundman, Wang, Watson, Zabdyr and Zinkevich91 All parameters were evaluated together to provide the best system descriptions. Table II shows the calculated interaction parameters.
Excess Gibbs energy parameters.

V. RESULTS AND DISCUSSION
The thermodynamic model described here includes five binary (Cr–Ti, Cr–Zr, Fe–Ti, Fe–Zr, Ti–Zr) and two ternary systems (Cr–Ti–Zr and Fe–Ti–Zr). The Cr–Ti system description was sourced from Ref. Reference Pavlu, Vrestal and Sob15, without change. The thermodynamic model of Cr–Zr was sourced from Ref. Reference Pavlu, Vrestal and Sob5. However, due to issues with reproduction of the phase diagram, some of the parameters describing Laves_C14, Laves_C15 and Laves_C36 were optimized. Note that values obtained from the first principle calculation by Pavlu et al. Reference Pavlu, Vrestal and Sob5 were not changed.
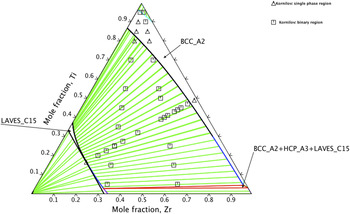
Figure 1 shows the calculated isothermal section of the ternary Cr–Ti–Zr system at 1073 K superimposed with experimental data from Kornilov et al. Reference Kornilov, Belousov and Musayev83 In general, the isothermal section agrees well with experiments, aside from the Ti rich corner, where experimental data suggest a larger BCC_A2 region. However, considering the phase boundary in the binary Cr–Ti system, the Kornilov et al. Reference Kornilov, Belousov and Musayev83 data seems to be overestimated. The solubility of Cr in binary Cr–Ti BCC_A2 from Kornilov et al. is 0.2 mole fraction of Cr, whereas the same solubility in Pavlu et al. Reference Pavlu, Vrestal and Sob15 is 0.14 mole fraction of Cr at 1073 K.
Isothermal section of the Cr–Ti–Zr system at 1073 K superimposed with experimental data given by Kornilov et al. Reference Stein, Sauthoff and Palm82

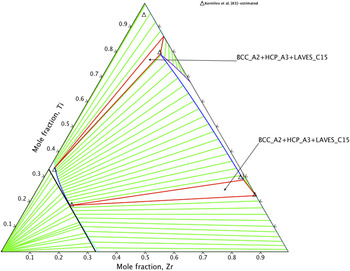
Figure 2 shows the calculated isothermal section of Cr–Ti–Zr system at 923 K with experimental data from Kornilov et al. Reference Kornilov, Belousov and Musayev83 The calculated curve agrees well with experiments, aside from the Ti rich corner. The HCP_A3 phase composition in the tie-triangle BCC_A2 + HCP_A3 + Laves_C15 contains less Ti than for Kornilov et al. Reference Kornilov, Belousov and Musayev83 According to their data, the HCP_A3 phase exhibits a small Cr solubility, which contradicts the binary Cr–Ti system proposed by Pavlu et al. Reference Pavlu, Vrestal and Sob15 Thus, calculation of ternary equilibrium is somewhat different from the experimental result. It is hard to judge without additional experimental data which result is correct.
Isothermal section of Cr–Ti–Zr system at 923 K. Experimental determination of tie-triangles were taken from Kornilov et al. Reference Stein, Sauthoff and Palm82 work.

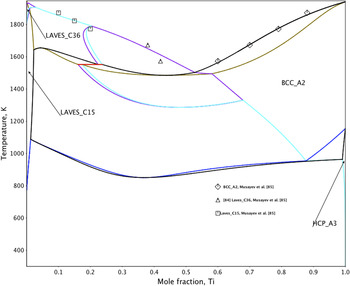
Figure 3 shows the calculated isoplethal section Cr77Zr33–Ti together with experimental data from Musayev et al. Reference Musayev, Kornilov and Belousov84 The liquidus line follows experimental data well.
Isoplethal section Cr77Zr33–Ti together with data taken from Musayev et al. Reference Kornilov, Belousov and Musayev83 work.

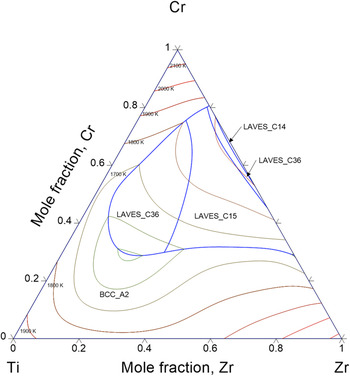
Figure 4 shows the liquidus projection of the ternary Cr–Ti–Zr system. There are 5 primary solidification regions: BCC_A2, double Laves_C36, Laves_C15, and Laves_C14. The primary solidification of Laves_C14 is very small and occurs only for a very small concentration of Ti, up to x Ti = 0.01. All the invariant reactions in the ternary Cr–Ti–Zr system belong to Class II. Table III shows detailed information about the reactions.
Liquidus projection of Cr–Ti–Zr system.
Invariant reactions in the ternary Cr–Ti–Zr system.

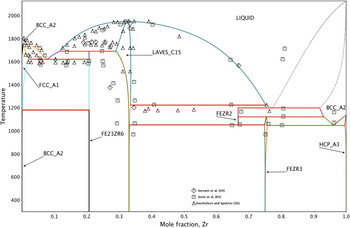
The thermodynamic description of the binary system Fe–Ti was, in general, from Dumitrescu et al. Reference Dumitrescu, Hillert and Saunders54 However, to keep all models consistent, the Laves_C14 phase was recalculated. Dumitrescu et al. Reference Dumitrescu, Hillert and Saunders54 described this phase by the model (Fe,Ti)0.67:(Fe,Ti)0.33, whereas the model (Fe,Ti)0.333:(Fe,Ti)0.5:(Fe)0.167 was used here. The binary Fe–Zr system was thermodynamically described by Jiang et al. Reference Jiang, Oikawa, Ikeshoji, Wulff and Ishida30 However, new experimental data from Stein et al. Reference Musayev, Kornilov and Belousov84 reveals different stabilities of FeZr2 and FeZr3 phases. Stein et al. show that FeZr2 is stable at temperatures between 1053 and 1224 K, whereas FeZr3 decomposes by FeZr2 + BCC_A2 = FeZr3 at 1124 K. This was confirmed by ternary equilibrium reported by Zhou et al. Reference Zhou, Jin, Liu, Liu and Jin79,Reference Zhou, Zeng and Liu80 In contrast to Stein et al., Reference Musayev, Kornilov and Belousov84 Jiang et al. Reference Jiang, Oikawa, Ikeshoji, Wulff and Ishida30 used older data and calculated that intermetallic compounds (IMCs) FeZr2 and FeZr3 were stable from room temperature to 1247 K, and 2161 K, respectively. Figure 5 shows the recalculated Fe–Zr system, with FeZr2 and FeZr3 stability taken from Stein et al., together with experimental data from Servant et al., Reference Servant, Gueneau and Ansara44 Stein et al., Reference Musayev, Kornilov and Belousov84 and Svechnikov and Spektor. Reference Svechnikov and Spektor36 The calculated invariant reactions follow Stein et al. Reference Musayev, Kornilov and Belousov84 results rather than Svechnikov and Spektor. Reference Svechnikov and Spektor36 The liquidus line shows acceptable agreement with experimental data except for the Zr rich BCC_A2 phase. The Laves_C15 phase follows Ref. Reference Svechnikov and Spektor36 whereas the new data from Stein et al. Reference Musayev, Kornilov and Belousov84 exhibits larger solubility range of this IMC toward the iron side. The discrepancy between calculation and experiments argues this system should be re-optimized in the future.
Calculated binary Fe–Zr system superimposed with experimental data given by Servant et al., Reference Servant, Gueneau and Ansara44 Stein et al. Reference Musayev, Kornilov and Belousov84 and Svechnikov and Spektor. Reference Svechnikov and Spektor36

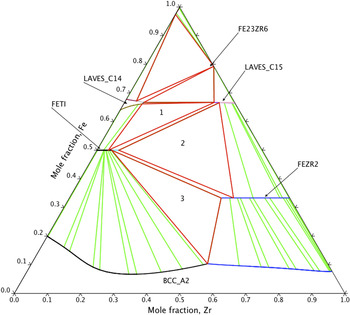
Figure 6 shows the calculated isothermal section of the ternary Fe–Ti–Zr system at 1173 K, as well as ternary phase regions determined by Zhou et al. Reference Zhou, Jin, Liu, Liu and Jin79 Zhou et al. Reference Zhou, Jin, Liu, Liu and Jin79 also determined a ternary region BCC_A2(Fe) + Laves_C14 + Laves_C15. However, they did not find IMC Fe23Zr6 at 1173 K. This was because during the diffusion triple experiment, some phases do not appear due to slow kinetic processes.
Calculated isothermal section of the ternary Fe–Ti–Zr system at 1173 K. The numbers indicate experimentally determined ternary phase regions Reference Zhou, Jin, Liu, Liu and Jin79 : 1—Laves_C14 + Laves_C15 + FeTi, 2—FeTi + FeZr2 + Laves_C15, 3—BCC_A2 + FeTi + FeZr2.

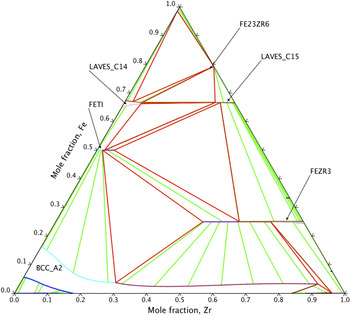
Figure 7 shows the calculated isothermal section at 1023 K. The FeZr2 phase is not present, rather, the FeZr3 phase is apparent, which agrees with experimental data from Zhou et al. Reference Zhou, Zeng and Liu80
Calculated isothermal section of the ternary Fe–Ti–Zr system at 1023 K.

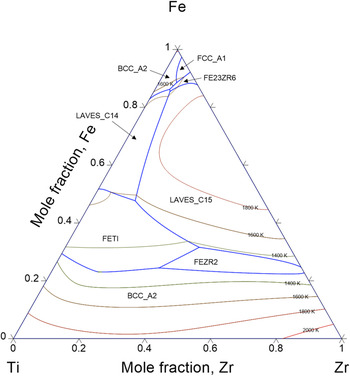
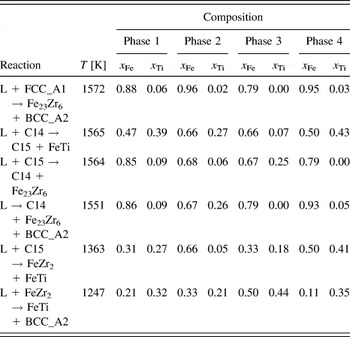
Figure 8 shows the calculated liquidus projection of the ternary Fe–Ti–Zr system. There are eight primary solidification regions: FCC_A1, double BCC_A2, Fe23Zr6, Laves_C14, Laves_C15, FeTi, and FeZr2. The calculation also shows one Class I invariant reaction and four Class II invariant reactions, as detailed in Table IV.
Calculated liquidus projection of the ternary Fe–Ti–Zr system.

Invariant reactions in the ternary Fe–Ti–Zr system.

VI. SUMMARY
The thermodynamic properties of two potential hydrogen storage material ternary systems were calculated. Good agreement was obtained between calculation and available experimental data. The thermodynamic models were unified and some improvements in the descriptions for binary systems are introduced.
ACKNOWLEDGMENT
This work was supported by the Taiwan Ministry of Science and Education (Grants 104-2221-E-259-002, 103-2221-E-259-002, and 105-2221-E-259-004).