


Introduction
High levels of social anxiety, such as those associated with social anxiety disorders, are common (Grant et al., 2000; Kessler, Berglund, et al., Reference Kessler, Berglund, Demler, Jin, Merikangas and Walters2005; Kessler, Chiu, Demler, Merikangas and Walters, Reference Kessler, Chiu, Demler, Merikangas and Walters2005) and disabling (Lydiard, Reference Lydiard2001; Regier, Rae, Narrow, Kaelber and Schatzberg, Reference Regier, Rae, Narrow, Kaelber and Schatzberg1998; Stein and Kean, Reference Stein and Kean2000; Weissman et al., Reference Weissman, Bland, Canino, Greenwald, Lee and Newman1996). Self image plays a prominent role in contemporary theories of social anxiety (e.g. Clark and Wells, Reference Clark, Wells, Heimberg, Liebowitz, Hope and Schneier1995; Hofmann and Otto, Reference Hofmann and Otto2007; Moscovitch, Reference Moscovitch2009). In addition, some theorists have proposed that social anxiety is self-maintaining through interpersonal processes (Alden and Taylor, Reference Alden and Taylor2004; Hook and Valentiner, Reference Hook and Valentiner2002; La Greca and Harrison, Reference La Greca and Harrison2005). These views propose that social anxiety leads individuals to engage in interpersonal behaviors that reinforce the maladaptive self-image underlying social anxiety.
The two studies described in this article provide tests of hypotheses that are consistent with these ideas. These studies are derived from an approach to social anxiety drawing on self-verification theory (Swann, Reference Swann, Suls and Greenwald1983; Wallace and Alden, Reference Wallace and Alden1997). Theorists have viewed self-verification as one of several core motives that individuals may have regarding the self (e.g. Morling and Epstein, Reference Morling and Epstein1997; Sedikides and Strube, Reference Sedikides and Strube1997). Self-verification theory suggests that individuals seek out, elicit, and prefer information congruent with their self-images, and dislike, dismiss, and disbelieve incongruent information. The self-verification view of social anxiety suggests that some problematic interpersonal behaviors that contribute to social anxiety are performed with the goal of maintaining a negative self-image. To fully understand these problematic behaviors, one must have a firm grasp of the nature of the negative self-image that is possessed by those who are socially anxious.
Social self-esteem
Social anxiety is believed to be characterized by a negative self-concept in terms of social behavior. Moscovitch (Reference Moscovitch2009) proposes that social anxiety involves a view of the self as deficient in social skill, social anxiety, social value, and character (Moscovitch, Reference Moscovitch2009). Similarly, Turner, Johnson, Beidel, Heiser and Lydiard (Reference Turner, Johnson, Beidel, Heiser and Lydiard2005) propose that social anxiety involves images of the self as socially awkward, unskilled, and incompetent. Hook and Valentiner (Reference Hook and Valentiner2002) offer a characterization, proposing that social anxiety involves a view of the self as not worthy and not deserving of, nor likely to receive, warmth, affection, friendship, and love.
An examination of negative self-concept underlying social anxiety, as suggested by these descriptions, requires a measure of social self-esteem. Operationalizing this aspect of self-image offers a means for examining whether the emphasis on social behavior is useful for understanding social anxiety, as maintained by prominent conceptualizations of social anxiety (e.g. Clark and Wells, Reference Clark, Wells, Heimberg, Liebowitz, Hope and Schneier1995). Based on such ideas, we hypothesize that social anxiety is especially related to low social self-esteem rather than to low general self-esteem. The two studies described in this article test this idea. Although likely to be strongly associated with low general self-esteem, low social self-esteem is thought to incorporate beliefs that the self is socially incompetent and lacking in social value.
In these studies, social self-esteem was assessed via modification of items from the Rosenberg Self Esteem Scale (RSES, Rosenberg, Reference Rosenberg1965).Footnote 1 To the extent possible, these modifications preserved the format and language of original RSES items. For example, the RSES item “At times I think I am no good at all” was rewritten as “At times I think I am not lovable at all.” Inclusion of both original items and modified items in the final scale allowed social self-esteem to be assessed independently of general self-esteem, and allowed separate examinations of the relations between these two constructs and other constructs related to social anxiety. In addition, this strategy allowed for a stringent test by developing a measure that minimally differed from the original RSES. Of particular interest are those constructs that may serve to maintain social anxiety, such as preference for negative social feedback.
Preference for negative social feedback
A wide variety of methods have been used to document self-verification effects for general self-esteem (see Sedikides and Strube, Reference Sedikides and Strube1997; Swann, Reference Swann, Higgins and Sorrentino1990), but not for social self-esteem. One example that is particularly relevant for the studies described here involves the Feedback Seeking Questionnaire (FSQ; Swann, Wenzlaff, Krull and Pelham, Reference Swann, Wenzlaff, Krull and Pelham1992). The FSQ presents six questions in each of five domains: social (general), intellectual, artistic/musical, physical appearance, and sports. Half the questions are positively framed, and half are negatively framed. For example, two of the items from the social (general) domain are: “What is some evidence you have seen that [your name here] has good social skills?” and “What is some evidence you have seen that [your name here] doesn't have very good social skills?” Participants are asked to choose two of the six questions in each domain that they would like someone close to the participant to answer about the participant. The number of negatively framed questions chosen is used as an index of the preference for negative feedback.
Many prior studies that have used the FSQ have provided evidence of self-verification processes (see Sedikides and Strube, Reference Sedikides and Strube1997; Swann, Reference Swann, Higgins and Sorrentino1990). For example, in a sample of child and adolescent inpatients, FSQ scores were found to predict subsequent peer rejection (Joiner, Katz and Lew, Reference Joiner, Katz and Lew1997). The FSQ measure has been one tool for documenting the self-verification processes associated with depression and general self-esteem (Joiner and Metalsky, Reference Joiner and Metalsky1995; Weinstock and Whisman, Reference Weinstock and Whisman2004), but to our knowledge, it has not been used to explore self-verification processes as they might relate to negative social self-esteem.
To assess whether self-verification theory applies to social anxiety and the construct of social self-esteem that we propose underlies social anxiety, a modified version of the FSQ was constructed.Footnote 2 For the current research, three new domains were added to the questionnaire. These assess the preference for negative social feedback: social (affection), social (friendship), and social (intimacy). These three new social domains differ from the social (general) domain that is included in the original FSQ in that they assess self-verification needs related to one's social value, and the social (general) domain emphasizes social skills and competence. The format of the items in these new domains mirrored the format of existing FSQ items. For example, a positively framed social (affection) item was: “What about [your name here] makes you think it is easy to have warm feelings for him or her?” A negatively framed social (affection) item was: “What about [your name here] makes you think it is not easy to have warm feelings for him or her?” As in the existing FSQ, participants were asked to choose two questions in each domain that they would like someone close to the participant to answer about the participant. The number of negatively framed questions chosen is used as an index of the preference for negative social feedback, i.e. the preference for feedback from others indicating that one does have low social value. Retention of the original FSQ items in the revised scale allowed any negative social feedback-seeking tendency to be assessed independently of a general tendency to seek negative feedback.
Study 1 used these newly constructed measures to examine relationships among the variables of preference for negative social feedback, social self-esteem, and social anxiety. We hypothesized negative relations between: (1) social self-esteem and preference for negative social feedback; (2) social self-esteem and social anxiety; and (3) preference for negative feedback and social anxiety. Support for the self-verification model of social anxiety would be especially strong if such relations could not be explained by: (1) general preference for negative feedback (assessed via responses to the original FSQ items); (2) general self-esteem (assessed via responses to the original RSES items); or (3) relevant alternative constructs, such as depression.
Study 1: Method
Participants and procedures
Students were recruited from Introductory Psychology courses at a large Midwestern university in the United States and received course credit for their participation. Questionnaires were administered in group sessions lasting 30–40 minutes in a large classroom, with answers recorded directly on the questionnaires. Data were obtained from 394 participants, but only 317 (60.9%, 193 female) provided usable data. The primary reason for missing data was that many participants incorrectly completed the FSQ (see below), endorsing too few or too many items in one or more domains. The mean age of these participants was 19.0 (SD = 2.7). Some (n = 11, 3.5%) failed to identify their race, but most did so [Caucasian (n = 225, 71.0%); African-American (n = 54; 17.0%); other racial group (n = 27, 8.5%)]. Most (n = 309, 97.5%) reported never being married. Median annual family income was between $50,001 and $55,000.
Measures
Demographics. A demographic questionnaire was included to assess participants’ age, sex, race, marital status, and annual family (parental) income.
Depression. This construct was assessed via the 21-item Beck Depression Inventory (BDI; Beck, Ward, Mendelsohn, Mock and Erbaugh, Reference Beck, Ward, Mendelsohn, Mock and Erbaugh1961). This measure has demonstrated good psychometric properties (Beck, Steer and Garbin, Reference Beck, Steer and Garbin1988). A depression score was derived from responses to the BDI using the usual scoring procedures.
Social anxiety. This construct was assessed via responses to the 20-item Social Interaction Anxiety Scale (SIAS; Mattick and Clarke, Reference Mattick and Clarke1998). This measure has demonstrated good psychometric properties (Brown et al., Reference Brown, Turovsky, Heimberg, Juster, Brown and Barlow1997). A social anxiety score was derived from responses to the SIAS using the usual scoring procedures.
Self-esteem. General and social self-esteem were assessed via responses to an expanded version of the RSES (described earlier). Standard procedures were used to combine responses to the standard RSES items into a general self-esteem score (Wylie, Reference Wylie1989). Similar procedures were used to combine responses to the10 new modified items on the scale into a social self-esteem score.
Preference for negative feedback. A general preference for negative feedback and preference for negative social feedback were assessed using the modified FSQ (described earlier). A general preference for negative feedback score was calculated for each participant by averaging, across the five original FSQ domains, the number of negatively framed questions endorsed (from 0 to 2) by each participant. A preference for negative social feedback score was obtained by averaging, across the three new social domains, the mean number of negatively framed questions (from 0 to 2) chosen by each participant. Averaging, rather than summing, allowed for comparisons across the two measures.
Results and discussion
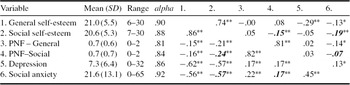
Means and standard deviations for each of the study variables were comparable to those from prior studies (see Sedikides and Strube, Reference Sedikides and Strube1997; Swann, Reference Swann, Higgins and Sorrentino1990). Reliabilities (Cronbach's alpha coefficients) were adequate. Corrrelations and partial correlations provided tests of the study hypotheses (see Table 1).
Means, standard deviations, and reliabilities (Cronbach's alphas) for each variable in Study 1, as well as correlations and partial correlations among variables (N = 317).

Notes: *two-tailed p < .05, **two-tailed p < .01, PNF = Preference for Negative Feedback. Zero-order correlations are listed below the diagonal, and partial correlations controlling for the other four variables in the study are listed above the diagonal. The correlations and partial correlations predicted to be significant are presented in bold italics.
Partial correlation analyses were used to test the hypothesis that there would be negative relations between social self-esteem and preference for negative social feedback. These data show that, as predicted, there was a significant relation between social self-esteem and the preference for negative social feedback, even after controlling for all other variables assessed.
Partial correlation analyses were also used to test the hypothesis that there would be negative relations between social self-esteem and social anxiety. These data also show that, as predicted, there was a significant relation between social self-esteem and social anxiety, even after controlling for all other variables assessed. This latter association appears especially robust given the high first-order correlation between the general self-esteem measure and the social self-esteem measure, and between the general preference for negative feedback measure and the preference for negative social feedback measure.
Partial correlation analyses were also used to test the hypothesis that there would be negative relations between preference for negative feedback and social anxiety. Although the unadjusted correlations show that negative social feedback also was associated with social anxiety, partial correlation analyses revealed that this relation disappeared when controlling for social self-esteem. These results indicate that the preference for negative social feedback is not directly related to social anxiety. We speculate that it may be indirectly related to social anxiety through the action of low social self-esteem.
The results depicted in Table 1 also show that social variables are not the only predictors of social anxiety. For example, the data reveal that social anxiety is also uniquely predicted by both general preference for negative feedback and general self-esteem. Clearly, then, in addition to explaining how self-verification might contribute to social anxiety, a comprehensive model of social anxiety would need to account for such constructs.
Nonetheless, the data from Study 1 provide partial support for the idea that self-verification processes may, indeed, play a role in the maintenance of social anxiety. The data from Study 1 also suggest that one can distinguish between social self-esteem and general self-esteem, and between the tendency to selectively seek negative social feedback and the general tendency to seek negative feedback.
Study 2
Fear of negative evaluation has often been considered to be a clinical hallmark of social anxiety and social anxiety disorder (Clark and Wells, Reference Clark, Wells, Heimberg, Liebowitz, Hope and Schneier1995; Rapee and Heimberg, Reference Rapee and Heimberg1997). For example, the DSM-IV-TR (American Psychiatric Association, 2000) proposes that individuals with social anxiety disorder “are afraid that others will judge them to be anxious, weak, ‘crazy’, or stupid” (p. 450). Accordingly, conventional treatments for social anxiety disorder often target evaluation fears.
Study 2 addresses a seeming paradox: How can the socially anxious fear negative evaluation (as reflected in the DSM-IV-TR definition) but, at the same time, prefer negative feedback (as reflected in the self-verification view)? Recent theorizing may resolve this paradox. Weeks, Heimberg and Rodebaugh (Reference Weeks, Heimberg and Rodebaugh2008) observed that socially anxious individuals also fear positive evaluations. Accordingly, they suggest that social anxiety is characterized by fear of all evaluation. Using a clinical sample, Study 2 explored this idea by testing the hypothesis that the preference for negative social feedback is not substantially related to both the fear of negative social evaluation and the fear of positive evaluation.
In addition, applying self-verification theory to social anxiety leads to an interesting prediction about some of the effects of treatments that successfully reduce social anxiety. If treatments successfully reduce social anxiety, then they may also increase social self-esteem. Less obvious is whether the treatment should alter the preference for negative social feedback. We hypothesized that the preference for negative social evaluation would be largely unaffected by a treatment that reduces social anxiety and fears of evaluation. This is examined by looking at a social anxiety treatment that targets social evaluation fears, showing that it reduces those fears, and showing that it does not substantially reduce the preference for negative social evaluation. The model suggests that any such effect will be indirect, working though social self-esteem. Given the indirect route involved in such an effect, it may not be readily observed in the data. In addition, we hypothesized that pre-treatment levels of the preference for negative social evaluation would predict post-treatment social anxiety symptoms because such self-verification needs were not directly targeted in treatment.
Method
Participants
Participants were patients in an intensive outpatient program. The primary diagnosis for these patients was an anxiety disorder, and it was unaccompanied by diagnoses of psychotic disorder or an active (untreated) substance use disorder. Diagnoses were based on the Mini International Neuropsychiatric Interview (MINI; Sheehan et al., Reference Sheehan, Lecrubier, Harnett-Sheehan, Amorim, Janavs and Weiller1998). Ninety-eight patients were admitted to the program, but relatively complete data were available for only 62 of them. This reduced sample was predominantly female (n = 42; 68%) and Caucasian/White (n = 57; 92%). The mean age was 31.9 (SD = 13.8; range = 12 to 64). Education level of patients varied (30% high school diploma or less; 33% partial college education, 37% a 4-year college degree or greater). Forty-six percent of the sample reported being married and/or living with a partner, 44% reported never having been married, and 10% reported being separated or divorced.
Participants (n = 47; 76%) were often diagnosed with multiple disorders. For the purposes of Study 2, participants were assigned to a diagnostic group on the basis of both primary and secondary diagnoses. The social anxiety disorder primary group (n = 16; 26%) consisted of those with a primary diagnosis of social anxiety disorder. The social anxiety disorder secondary group (n = 17; 27%) consisted of those with a secondary diagnosis of social anxiety disorder. The non-social anxiety disorder group (n = 29; 47%) consisted of those with no primary or secondary diagnosis of social anxiety disorder. The most common secondary diagnoses in the social anxiety disorder primary group were generalized anxiety disorder (n = 7; 44%) and major depressive disorder (n = 7; 44%). The most common primary diagnosis in the social anxiety disorder secondary and non-social anxiety disorder groups were panic disorder (n = 25; 54%), obsessive compulsive disorder (n = 8; 17%), and generalized anxiety disorder (n = 7; 15%). The most common secondary diagnosis (other than social anxiety disorder) in the social anxiety disorder secondary and non-social anxiety disorder groups were generalized anxiety disorder (n = 16; 35%) and obsessive compulsive disorder (n = 12; 26%).
Measures
A pre-treatment questionnaire packet completed by participants included a demographic questionnaire. Pre-treatment and post-treatment packets completed by participants both included the modified versions of the RSES and FSQ, the SIAS, and the BDI (all described in Study 1). The pre- and post-treatment packets also both included two measures of evaluation fears: the Brief Fear of Negative Feedback scale (BFNE; Leary, Reference Leary1983) and the Fear of Positive Evaluation Scale (FPES; Weeks et al., Reference Weeks, Heimberg and Rodebaugh2008). The BFNE is a 12-item measure. Responses to each item are made on an ordered category scale ranging from 1 (not at all characteristic of me) to 5 (extremely characteristic of me). Following Rodebaugh et al. (Reference Rodebaugh, Woods, Thissen, Heimberg, Chambless and Rapee2004) and Weeks et al. (Reference Weeks, Heimberg, Fresco, Hart, Turk and Schneier2006), only the eight straightforwardly-worded items on the BFNE were used to construct a fear of negative evaluation index. The FPES is a 10-item measure with responses measured on an ordered category rating scale ranging from 0 (not at all true) to 9 (very true). Following Weeks et al. (Reference Weeks, Heimberg, Fresco, Hart, Turk and Schneier2006), 8 items on this scale were used to construct a fear of positive evaluation index.
Procedure
Participants completed pencil-and-paper questionnaire packets during the initial assessment process. Treatment eligibility was determined at that time. Similar questionnaires were completed just before each participant's final treatment session. Treatment occurred 4 days per week. The typical program duration was 2–3 weeks. The goal of treatment was not full recovery, but reduction of symptoms sufficient to warrant transfer to a less intensive, traditional outpatient treatment program. The treatment received by patients was determined largely by their primary diagnosis, but treatment regimens were also influenced by secondary diagnoses.
The primary treatment for social anxiety disorder was exposure; this was sometimes accompanied by psycho-education and general cognitive therapy. The treatment approach was informed primarily by the treatment models of Beck and Emery (Reference Beck and Emery1985), Clark and Wells (Reference Clark, Wells, Heimberg, Liebowitz, Hope and Schneier1995), and Heimberg (Reference Heimberg1991). In vivo exposure was typical, but was sometimes supplemented by imaginal exposure. Exposure included behavioral experiments in which patients were exposed to negative evaluations. For example, social anxiety disorder patients gave short speeches while other group members jeered, booed, and threw paper. Treatment of social anxiety disorder also included exposure to positive evaluations. For example, group members barraged social anxiety disorder patients with compliments, applause, and admiration. These exposures were framed as opportunities to reappraise the social cost of such evaluations; hopefully, such reappraisals would reduce evaluation fears (see also Hofmann, Reference Hofmann2004). To the degree afforded by a group treatment format, the patient's specific dysfunctional beliefs were identified and the behavioral experiments were framed as opportunities to re-evaluate such beliefs. In addition, the treatment also included psychoeducation, cognitive restructuring, and dropping of safety behaviors and self focus attention during behavioral experiments.
Other treatments were as follows: for panic disorder, treatment consisted of interoceptive exposure, sometimes conducted in situ; for obsessive compulsive disorder, treatment consisted of exposure and response prevention therapy; for generalized anxiety disorder, treatment consisted of behavioral experiments and cognitive restructuring to address dysfunctional cognitions; and for post-traumatic stress disorder, treatment consisted of prolonged exposure.
Results and discussion
Correlations among constructs
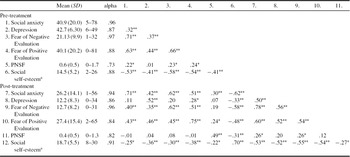
Table 2 presents means, standard deviations, and reliabilities (all at acceptable levels) for the measures collected in Study 2, along with intercorrelations among all measures. Given the directional nature of our predictions, the a priori cut-offs for inferential tests were one-tailed.
Means, standard deviations, and reliabilities for and correlations among Study 2 measures

Notes: N = 62. *one-tailed p < .05. **one-tailed p < .01. a N = 60 due to missing data, PNSF = Preference for Negative Social Feedback.
One purpose of Study 2 was to test the hypothesis that social anxiety was substantially unrelated to fears of evaluation. Indeed, the results in Table 2 show that at pre-treatment, social anxiety was positively related to both the fear of negative evaluation and the fear of positive evaluation. These significant positive relations appeared again in the post-treatment measures. Thus, these results confirm the idea of Weeks et al. (Reference Weeks, Heimberg and Rodebaugh2008) that socially anxious individuals fear evaluations, regardless of whether the evaluations are positive or negative.
The results in Table 2 also show that at pre-treatment, preference for negative feedback was positively related to both the fear of negative evaluation and the fear of positive evaluation. The significant positive relation between preference for negative feedback and fear of negative evaluation appeared again in the post-treatment measures. These results suggest that the socially anxious can fear negative evaluation, yet prefer negative feedback to positive feedback.
Other correlations consistent with a self-verification view of social anxiety also appear in Table 2. For example, the correlation between social self-esteem and social anxiety was significant at pre-treatment and at again at post-treatment. Similarly, the correlation between preference for negative social feedback and social anxiety was significant at both pre- and post-treatment, and the correlation between preference for negative social feedback and social anxiety was also significant at both pre- and post-treatment. These associations were of similar (or in some cases larger) magnitude in the current clinical sample then in the non-clinical sample used in Study 1, providing confirmation of those associations observed in Study 1.
The correlations also suggest consistency across time. For example, the measure of post-treatment social anxiety was predicted by both the pre-treatment measure of preference for negative social feedback and the pre-treatment measure of social self-esteem. These remained significant, even when controlling for pre-treatment social anxiety (partial rs = .24 and −.41, respectively, one-tailed ps < .05 and .01).
Effects of successful treatment of social anxiety
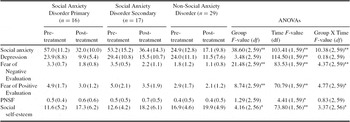
Mixed ANOVAs assessed the impact of treatments on various psychological measures. In these analyses, diagnostic group (primary diagnosis of social anxiety, secondary diagnosis of social anxiety, no diagnosis of social anxiety) was the between-subjects variable and time of questionnaire administration (pre- versus post-treatment) was the within-subjects variable. The results of the ANOVAs are presented in Table 3. Table 3 also presents the pre- and post-treatment means and standard deviations of the measures for each diagnostic group.
Means and standard deviations for three diagnostic groups at pre- and post-treatment, and results of repeated measure ANOVAs in Study 2

Notes: *two-tailed p < .05, **two-tailed p < .01. PNSF = Preference for Negative Social Feedback.
The effectiveness of the social anxiety treatment is reflected in the significant Diagnostic Group X Time interactions. Social anxiety disorder patients reported high initial levels of social anxiety, fear of evaluation, and preference for negative social feedback, and low levels of social self-esteem. In both the primary diagnosis of social anxiety disorder group and the secondary diagnosis of social anxiety disorder group, all of these measures, except preference for negative feedback, showed improvement after receipt of treatment. Hence, consistent with the self-verification view, the fear-reduction treatments that reduced social anxiety also increased social self-esteem. This effect suggests the presence of a link between these two constructs. Moreover, the absence of a significant effect of the treatment on the negative social feedback preference measure provides a test of the hypothesis that the preference for negative social evaluation would be largely unaffected by a treatment that reduces social anxiety and fears of evaluation. This result is consistent with the view of this construct as relatively independent from evaluation fears, which were the primary target of treatment. This finding is also consistent with the absence of a direct path from social anxiety to preference for negative social feedback.
Some implications
One implication of the data is that residual social anxiety following treatment among those with social anxiety disorder is strongly related to both initial social self-esteem and to initial preference for negative social feedback. Moreover, the results are consistent with the view that social self-esteem and self-verification processes are clinically relevant to social anxiety. Ironically, these variables were not directly addressed by the treatment studied here. Instead, effects on these variables appear to be side effects of the fear reduction treatment technique. We note, however, that other treatments specifically target the self-concept (Clark and Wells, Reference Clark, Wells, Heimberg, Liebowitz, Hope and Schneier1995; Hofmann, Reference Hofmann2000; Hofmann and Otto, Reference Hofmann and Otto2007). Accordingly, future research might examine the degree to which these other treatments and manipulations change self-verification processes associated with social anxiety, and whether direct alteration of these constructs might contribute to more effective treatment of social anxiety.
General discussion
Recapitulation and summary
The two studies described in the present paper examined the self-verification model of social anxiety. We believe that these studies successfully provided evidence documenting the applicability of self-verification processes to social anxiety.
Study 1 developed new measures of social self-esteem (independent of general self-esteem) and preference for negative social-evaluation (independent of general preference for negative evaluation). Results from Study 1 also showed that, even after controlling for all other variables assessed: (1) there was a significant relation between social self-esteem and the preference for negative social feedback; and (2) there was a significant relation between social self-esteem and social anxiety.
An examination of the correlation between the measures of social self-esteem and general self-esteem raises questions about the distinctiveness of these constructs. The high level of convergence is likely due, in part, to development of social self-esteem items using items from the general self-esteem measure. Controlling for the measure of general self-esteem effectively controlled not only for the construct of general self-esteem, but also systematic error associated with the wording of items. Despite the lack of distinctiveness of the content of these two self-esteem measures, these minimal differences in the wording were apparently responsible for the differential pattern of incremental validity. The measure of social self-esteem appeared to be useful when used in conjunction with the measure of general self-esteem for examining this specific facet of self-esteem.
Study 2 found that the socially anxious do indeed fear negative evaluation, but prefer negative social feedback to positive social feedback. This apparent paradox is solved by the fact that socially anxious people fear all evaluation, not just negative evaluation. Data from Study 2 also confirmed the results from Study 1, revealing evidence in a clinical sample of correlations between social self-esteem and the preference for negative social feedback, between social self-esteem and social anxiety, and between preference for negative social feedback and social anxiety. Study 2's results also revealed that these relationships exhibit stability across time. Moreover, Study 2 found that fear-reduction treatments that reduced social anxiety also increased social self-esteem. Finally, the non-significant effect of treatment on the negative social feedback preference measure was consistent with the absence of a direct path from social anxiety to preference for negative social feedback.
The version of the FSQ used in these studies is new, raising concerns about the validity of this measure. For example, this measure of the preference for negative feedback about one's social value might be construed as a desire for self-improvement. Study 2 provided evidence that this preference was largely unrelated to a fear of positive evaluation, and unaffected by a treatment that successfully reduced the fear of positive evaluation. We also note that other versions of the FSQ have been used successfully to examine self-verification processes, and that the results of those studies converge with other studies using different methodology (see Sedikides and Strube, Reference Sedikides and Strube1997; Swann, Reference Swann, Higgins and Sorrentino1990). The inclusion of the original FSQ, including its social (general) domain, allowed for stringent tests examining the unique importance of the preference for negative feedback about one's social value after controlling for the general preference for negative feedback (including about one's social skills and competence). We also note that although the original RSES and FSQ have been extensively used and validated, the versions used in this current study are new. Additional evidence of these measures’ reliabiilty and validity would increase confidence in the findings from the current studies.
The effect sizes in Study 1 were quite modest. The similarities between the two measures of self-esteem, and between the two measures of preference for negative feedback, likely prevented the observed effect sizes from being inflated due to shared method variance. The most magnitudes of the unique relationships observed in Study 1 suggest that a general self-verificaiton framework substantially approximates a self-verification framework specifically adapted for social anxiety. The large amount of missing data in Study 1 had unknown effects on our results, reinforcing the need for further investigation before strong conclusions can be drawn.
The effect sizes in Study 2 were of moderate magnitude, with pre-treatment preference in negative social feedback accounting for about 6% of post-treatment social anxiety symptoms after controlling for pre-treatment social anxiety symptoms. The goal of the intensive outpatient treatment program was not full recovery, so it is not clear if a more complete treatment might affect self-verificaiton needs. Further research is needed to understand whether and how to address self-verification needs during treatment.
Many results reported in the present manuscript are consistent with the application of self-verification ideas to social anxiety, but other models (e.g. Alden and Taylor, Reference Alden and Taylor2004) might be able to explain some of these results. For example, the findings regarding social self-esteem are consistent with the characterization of the self underlying social anxiety (e.g. Moscovitch, Reference Moscovitch2009; Turner et al., Reference Turner, Johnson, Beidel, Heiser and Lydiard2005). The finding, however, of pre-treatment preference for negative feedback predicting residual social anxiety symptoms following treatment is not readily accounted for by theories other than a self-verification theory. Although alternative explanations were not fully ruled out, these preliminary tests were quite favorable to the application of a self-verification model to social anxiety. Future research could provide more stringent tests of this self-verification model of social anxiety, as well as explore why self-verification rather than self-enhancement or other self-evaluation motives (e.g. Sedikides and Strube, Reference Sedikides and Strube1997; Swann, Reference Swann, Higgins and Sorrentino1990) would be operating.
Many of the cognitions, behaviors, and interpersonal processes predicted by self-verification theory can also be understood as safety behaviors (Clark and Wells, Reference Clark, Wells, Heimberg, Liebowitz, Hope and Schneier1995). There are, however, important differences in how self-verification and safety behaviors are conceptualized and described. Self-verification processes are proposed to be unconsciously motivated by the need for epistimological security, i.e. the need for consistency in one's view of self. Safety behaviors are proposed to be consciously motivated by the desire to reduce anxiety and/or reduce threat. This view of safety behaviors suggests that not all such behaviors are maladaptive; some may be neutral or adaptive (see Helbig-Lang and Petermann, Reference Helbig-Lang and Petermann2010). Clark and Wells (Reference Clark, Wells, Heimberg, Liebowitz, Hope and Schneier1995) do not speculate about unconscious motivation associated with maladaptive safety behaviors, and self-verification theory is largely silent on the individual's conscious intent (Swann, Reference Swann, Higgins and Sorrentino1990).
One speculative idea that arises from this observation is that social anxiety might develop because negative self-verification needs could potentially shape an individual's behavioral repertoire. That is, adaptive coping behaviors might result in dissonance for individuals with negative self-verification needs, and the verification created by maladaptive safety behaviors might reinforce those behaviors for these individuals. This issue is beyond the scope of the current studies and might be investigated in future research.
Tafarodi and Swann (Reference Tafarodi and Swann1995) have described two dimensions of self-esteem, social competence and self-liking, that seem closely related to the construct of social self-esteem. Those dimensions might be viewed as relatively lower-order appraisals that contribute to the relatively higher order appraisal of social self-esteem, which represents the perception that one is likely to be the object of warmth, support, and friendship. The relationships between social self-esteem and dimensions of self-esteem, other than general self-esteem, were not examined in these studies.
Although the diagnostic procedure used in Study 2 has shown adequate reliability in other studies, this issue was not examined in the current study. Increasing our confidence about these diagnoses, the levels of pre-treatment symptoms and the pattern of reduction in symptoms provide some confirmation that the diagnostic grouping variable was meaningful. In addition, the consistency in findings across the two studies, despite the differences in samples, provides evidence of generality of these findings. Nevertheless, the validity of the diagnoses of participants in Study 2 was not examined, and the applicability of the findings to the diagnostic category of social anxiety disorder is not known.
If self-verification processes are at work in socially anxious individuals, self-image could be a target in the treatment of social anxiety (Clark and Wells, Reference Clark, Wells, Heimberg, Liebowitz, Hope and Schneier1995; Hofmann, Reference Hofmann2000). Moreover, maintaining the gains of therapy in the real world may depend on helping socially anxious clients to develop the type of self-image needed to build and maintain warm and supportive relationships outside of therapy. Similarly, the natural course of social anxiety may be affected by the degree to which the individual can receive and incorporate positive social treatment in their relationships. These considerations suggest that the exploration of ideas relevant to self-verification can be both theoretically fruitful and of considerable practical import to understanding and treating social anxiety.
Acknowledgements
Earlier analyses of these data were presented at the 39th Annual Convention of the Association for the Advancement of Behavior Therapy/Association for Behavioral and Cognitive Therapies. We thank the research participants for their willingness to participate in the investigation and the contribution of their time and effort. We thank Megan Armstrong, Emily LeFew, Nicole Patterson, Nicole Stockberger, Jenny Ursini, and Karen Wiemeyer for assisting with data collection and data entry in Study 1; and to the staff at Linden Oaks Hospital, including Lou Mastro, Paul Teodo, Adrienne Ahlquist, Shayla Parker and Simon Jencius, for their help with Study 2. We also thank Thomas Joiner for comments on earlier analyses. Items for the modified versions of the RSES and FSQ are available upon request.



Comments
No Comments have been published for this article.