I. INTRODUCTION
Atactic polystyrene (aPS) exhibits moderate mechanical, thermal, and chemical stability and has been used extensively in optical applications. There is a window of transparency from the ultraviolet–visible region of the electromagnetic spectrum from the absorption peak at 250–300 nm assigned to the s0 to s1 transition of the benzene ring through the visible region.Reference Torikai and Shibata1 This particular window of transparency attracted those interested in aPS scintillators.Reference Moser, Harder, Hurlbut and Kusner2–Reference Feygelman, Harmon and Walker4 During scintillation, the phenyl rings in the aPS backbone absorb ionizing radiation and there is a nonradiative energy transfer from the polymer to a fluorescent dye which emits light from 350 to 450 nm. aPS scintillator materials have been used to detect ionizing radiation via fluorescence measurements in a variety of applications. This spurred interest in developing scintillators with properties that are stable when exposed to ionizing radiation. Wallace et al.Reference Wallace, Sinclair, Gillen and Clough5 investigated the effect of gamma radiation on color center formation in aPS irradiated in vacuum and in air to doses up to 100 kGy. They found that the absorption at 400 nm is greater in vacuum annealed than in air annealed samples. Chiang et al.Reference Chiang, Hu and Lee6 analyzed postradiation annealing data of Wallace et al.Reference Wallace, Sinclair, Gillen and Clough5 and determined that annealing induced color center annihilation data followed the first order kinetics for samples irradiated in air and the second order kinetics for samples irradiated in vacuum. Onyiriuka et al.Reference Onyiriuka, Hersh and Hertl7 showed that gamma-irradiation oxidizes polystyrene to produce surface and subsurface carbonyl groups that oxidize to produce carboxylic acid groups. Clough et al.Reference Clough, Gillen, Mallone and Wallace8 summarized basic mechanisms that induce radiation damage in aPS. Radiation induced scission produces free radicals that are long-lived in the stiff PS matrix. These radicals are color centers that recombine when the matrix is softened during heating. Radiation also produces oxidation and other products that may result in permanent color centers. Overall, PS is relatively radiation resistant to mechanical degradation when compared to other thermoplastic matrices. This is due to the fact that cross-linking reactions are more prevalent than scission reactions under most radiation conditions. Also of importance is the fact that the phenyl rings on the backbone absorb and dissipate some of radiation energy via nondestructive pathways.
The search for radiation hard “styrene-like” materials resulted in different approaches to optimize radiation hardness. One approach which minimized optical damage was to plasticize the matrix so that free radicals recombined rapidly.Reference Harmon, Gaynor and Taylor3,Reference Harmon and Gaynor9 A second approach focused on mechanical properties and the effect of the phenyl rings on nondestructive radiation energy dissipation. Research focused on syndiotactic polystyrene (sPS) for several reasonsReference Diola, Okada, Mihara, Nichols and Schellenberg10:
The polymer backbone retained the phenyl substituents, which enhance radiation hardness. The stereoregular sPS crystallized, rendering the polymer with improved mechanical properties, heat resistance, and solvent resistance as compared to aPS.
Crystallization rates are high enough to make processing practical. (The isotactic form of PS has prohibitively long crystallization rates.) Additionally, early studies reported in the trade literature stated that sPS exhibited stable tensile properties after exposure to gamma radiation and exhibited biocompatibility as well.Reference Hermanson and Wessel11
To understand radiation induced effects in sPS, it is necessary to understand the complex polymorphism of this material and how it is influenced by heat and solvent treatment.Reference Guerra, Vitaglian, Rosa, Petraccone and Corradini12–Reference Rapacciuolo, Derosa, Guerra, Mensitieri, Apicella and Delnobile21 Two crystalline forms arise upon cooling from melt, the α form with a hexagonal unit cell and the β form with an orthorhombic unit cell.Reference Guerra, Vitaglian, Rosa, Petraccone and Corradini12,Reference Lu, Zhao, Chen, Xiong, Zhang, Mai and Wu13 When crystals formed from the melt are solvent treated, they transform into a columnar γ form, which incorporates the guest solvent into the crystal. Annealing drives out the guest molecules and yields the “emptied” γ form referred to as the δ form. The α and β crystalline forms are between disordered structures (α′ and β′) and perfectly ordered (α″ and β″) forms. These two crystalline forms possess different densities,Reference Suna, Morgana and Lewis16 gas permeabilities,Reference Olson, Prodpran, Jamieson and Nazarenko17,Reference Larobina, Sanguigno, Venditto, Guerra and Mensilieri18 thermal stabilities,Reference Prodpran, Shenogin and Nazarenko19,Reference Ho, Lin, Tsai and Woo20 solvent resistances,Reference Rapacciuolo, Derosa, Guerra, Mensitieri, Apicella and Delnobile21 etc. Guerra et al.Reference Guerra, Vitaglian, Rosa, Petraccone and Corradini12 observed that the crystalline structure of sPS produced by cooling from melt consists of both α″ and β′ forms. Clearly, understanding the competition between α and β crystalline forms during melting crystallization is very important for its practical applications.
Multiple endothermic peaks are observed in differential scanning calorimetry as sPS cools from the melt and different interpretations of these peaks are found in the literature. This is due to the fact that sample morphologies are influenced by thermal history such as crystallization temperature and cooling rate. Lin and WooReference Lin and Woo22 and Hong et al.Reference Hong, Jo, Lee and Kim23 reported that high, intermediate, and low melting peak temperatures correspond to the β′, α, and β forms, respectively. Later, Wang et al.Reference Wang, Hsu and Lo24 agreed that the low and intermediate temperature peaks are due to melting of the α and β forms, respectively. They suggested that the high melting peak contained a mixture of α and β forms. Zhou et al.Reference Zhou, Lu and Mai25 and Rosa et al.Reference Rosa, de Ballesteros, Gennaro and Auriemma26 studied the isothermal crystallization of sPS and found that the crystallization temperature and time increase with increasing β form content and decreasing α form content. However, Ting et al.Reference Ting, Nyugen, Hu, Chen and Lee27 observed the opposite trend. The transformation from one crystalline form to another during crystallization under different environmental conditions clearly renders sPS a morphologically complex system. Additionally, Ho et al.Reference Ho, Lin, Hsieh and Chang28 documented a phase transformation from α″ to β′ in sPS crystallized at 245 °C for different times. Lu et al.Reference Lu, Zhao, Chen, Xiong, Zhang, Mai and Wu13 shed light on the fact that depressing the nucleation barrier is beneficial for the formation of α crystals in melt-crystallized sPS.
Liu et al.Reference Liu, Nguyen, Yang and Lee29 illustrated that gamma irradiation has a significant effect on the chemical properties and microstructure of sPS. Onyiriuka et al.Reference Onyiriuka, Hersh and Hertl7 believed that some of the radicals formed in sPS during radiation react with oxygen to form peroxide and then degrade the main chain. Recently, we studied the isothermal crystallization kinetics of sPS irradiated in air.Reference Ting, Nyugen, Hu, Chen and Lee27 Both crystallization temperature and time increased with increasing amount of crystalline α form. This prompted us to investigate the kinetics of isothermally crystallized sPS irradiated under vacuum in this paper. First, we decompose the overlapping endothermic peaks of DSC into three Gaussian functions (or less) corresponding to the different crystalline forms in vacuum gamma-irradiated sPS. Then, we undertake an analysis of crystal growth kinetics using Avrami's model.Reference Avrami30–Reference Avrami32 The results are confirmed by x-ray diffraction pattern and Fourier transform infrared (FTIR) spectra. These results are compared to those we obtained earlier for sPS irradiated in air.Reference Ho, Lin, Hsieh and Chang28
II. EXPERIMENTAL PROCEDURES
sPS pellets with a number average molecular weight of 3.5 × 10⁵ g/mol and glass transition temperature (T g) of 99.6 °C were obtained from Dow Chemical Company (Midland, MI). Sample preparation has been described earlier.Reference Ting, Nyugen, Hu, Chen and Lee27 Transparent sPS sheets were produced by compression molding at 300 °C and quenching in 0 °C water. Ground and polished samples were annealed at 90 °C for 24 h to reduce residual stresses. Samples of 5 × 5 × 1 mm were placed in vacuum-filled glass tubes. Gamma irradiation was undertaken a Co-60 source at Radiation Application Technology Center in the Institute of Nuclear Energy Research (Tauyuan, Taiwan). A constant dose rate of 30 kGy/h was used to deliver doses from 200 to 800 kGy at 24 °C.
Isothermal crystallization behaviors of vacuum gamma-irradiated sPS were investigated using a Nietzsch DSC 200F3 differential scanning calorimeter (Selb, Germany). Samples were heated to the melting point at 310 °C, cooled to the crystallization temperature (T c), maintained at T c for a crystallization period (t), and then heated again in the DSC to generate thermograms.Reference Ting, Nyugen, Hu, Chen and Lee27 The DSC data for the reheating period showed resolvable melting endothermic peaks that were used to analyze crystallization kinetics.
FTIR spectroscopy was conducted in a Nicolet AVATAR 320 FTIR Spectrometer in the attenuation total reflection (ATR) mode (Thermo Electron Corp., Madison, WI). XRD traces were recorded via a Rigaku D/MAX-IIB diffractometer (Shibuya-Ku, Tokyo, Japan).
III. RESULTS AND DISCUSSION
sPS crystallizes rapidly while it is cooled from the melt. Even at rapid cooling rates, crystallization starts before the sample reached T c (220 °C ≤ T c ≤ 260 °C); crystallization is faster than the cooling rate. Further, depending on the heat flow history, the crystalline materials in sPS may change from one phase to another during crystallization. Ergo, the DSC thermograms of the vacuum gamma-irradiated sPS samples exhibited multiple, overlapping endothermic peaks. There were three overlapping endothermic peaks at crystallization temperatures from 220 to 242.5 °C, two at 250 °C, and one peak at 260 °C. This is similar to what was observed in sPS samples irradiated in air.Reference Ting, Nyugen, Hu, Chen and Lee27 The endothermic peaks were resolved by using Eq. (1) to obtain quantitative data of crystallization kinetics. Equation (1) shows that the melting enthalpy change (ΔH) with respect to the differential temperature (ΔT) of the endothermic envelop consists of different Gaussian functions. That is,
 $${{\Delta H} \mathord{\left/ {\vphantom {{\Delta H} {\Delta T}}} \right. \kern-\nulldelimiterspace} {\Delta T}} = \mathop\sum\limits_{i = 1}^n {{A_i}\exp \left\{ { - {{\left[ {{{\left( {T - {T_i}} \right)} \mathord{\left/ {\vphantom {{\left( {T - {T_i}} \right)} {{\gamma _i}}}} \right. \kern-\nulldelimiterspace} {{\gamma _i}}}} \right]}^2}} \right\} + B} \quad ,$$
where A i, T i, and γi represent the peak height, melting peak temperature, and the Gaussian radius, respectively; B is a constant. The subscript i corresponds to the ith endothermic peak. n is equal to three at T c ≤ 242 °C, two at T c = 250 °C, and one at T c = 260 °C, respectively. When n = 3, i equals 1, 2, and 3, corresponding to crystalline forms β, α, and β′. When n = 2, i = 1 and 2, representing for β and α forms. When n = 1, i = 1, indicating the β form. The ith endothermic peak is designated as Pi. The reasons for melting peak temperatures T 1, T 2, and T 3 attributed to β, α, and β′ forms, respectively, were explained in detail by Woo and WuReference Woo and Wu33 and Liu et al.Reference Liu, Nguyen, Yang and Lee29 using DSC and x-ray analyses.
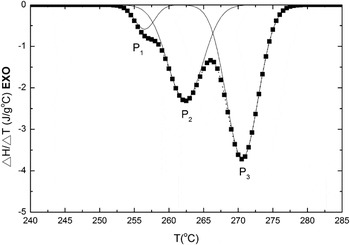
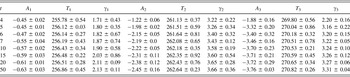
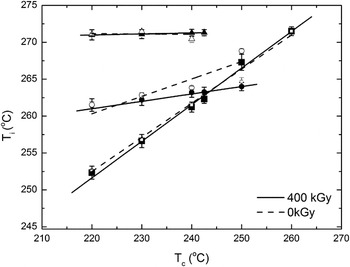
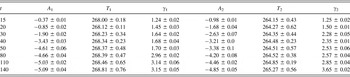
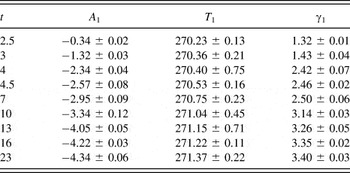
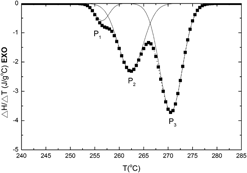
DSC thermograms in the different crystallization temperatures for nonirradiated, vacuum-irradiated, and air-irradiated sPS were displayed by Liu et al.Reference Liu, Nguyen, Yang and Lee29 They elaborated the effect of irradiation environment on crystallization without kinetics. For a sPS sample crystallized at a given temperature and time, the heat flow and corresponding temperature change as a function of time, respectively, in the region of endothermic peak were obtained from DSC thermograms. Then, the curve of heat flow versus temperature was replotted as an envelope of endothermic peak and the Gaussian function was used to deconvolute. Figure 1 shows a typical deconvoluted Gaussian function obtained via Eq. (1) for the sample vacuum-irradiated at 400 kGy and isothermally crystallized at 230 °C for 15 min. The values of A i, T i, and γi are shown in Table I, which includes values for other crystallization times. Note that the ordinate in Fig. 1 is (ΔH/ΔT − B). Three Gaussian functions correspond to the three crystalline forms α, β, and β′ at the selected T c. A i, T i, and γi increased with increasing crystallization time. When t increased from 2 to 50 min, both T 1 and T 2 increased by 0.8 °C while T 3 increased by 1.7 °C. Tables II and III list the values of A i, T i, and γi for vacuum gamma-irradiated sPS (400 kGy) at crystallization temperatures of 250 and 260 °C, respectively. There were two crystalline forms, β and α, at T c = 250 and one form, β, at 260 °C. Furthermore, T 2 is lower than T 1 at T = 250 °C, which is opposite to that observed at T c ≤ 242 °C. The changes in both A i and γi with t at T c = 250 and 260 °C are similar to that for T c ≤ 242 °C. The effects of crystallization time on A i, T i, and γi for vacuum gamma-irradiated sPS at the other doses were similar to those obtained at 400 kGy. Note that several doses and crystallization times and temperatures were measured, only characteristic results are graphed to depict the effects of important variables. Plots of the melting peak temperature, T i, as a function of T c for vacuum gamma-irradiated sPS at 400 kGy and nonirradiated sPS are shown in Fig. 2 by solid and dashed lines, respectively. Note that the melting peak temperature, T i, is the average value of the melting peak temperatures of different crystallization times as tabulated in Table I. For the irradiated sPS, the slope of the T 1 versus T c plot was greater than that for the T 2 versus T c plot. These two solid lines intercepted at 242 °C. That is, the melting peak temperature, T 1, corresponding to β form was lower than that of T 2 corresponding to α form at T c ≤ 242 °C and higher than that of T 2 at T c > 242 °C for irradiated sPS. Furthermore, the melting peak temperature of T 3 corresponding to β′ form was constant at T c ≤ 242 °C and disappeared at T c > 242 °C. Thus, the α and β forms coexisted at T c = 250 °C and only the β form appeared at T c = 260 °C. The melting peak temperatures, T is, at a given T c for both sPS irradiated in vacuum and air at 400 kGy were almost the same. Additionally, the effects of irradiation dose on the melting temperatures were almost the same in the range from 200 to 800 kGy regardless of irradiation environment. This result is different from that for the nonirradiated sPS, in which T 2 was always higher than T 1, and T 3 vanished at T c ≥ 242 °C, as shown in Fig. 2 by the dashed lines.Reference Ting, Nyugen, Hu, Chen and Lee27 These data are similar to results reported by Woo and Wu.Reference Woo and Wu33
Typical deconvoluted Gaussian function for vacuum gamma-irradiated sPS at 400 kGy and crystallized at 230 °C for 15 min.

A i (J/g °C), T i (°C), and γi (°C) for vacuum gamma-irradiated sPS at 400 kGy and crystallized at 230 °C for different times t (min); i = 1, 2, and 3.

Melting temperatures T is, as a function of crystallization temperature, T c, for vacuum gamma-irradiated (dose = 400 kGy) and nonirradiated sPS.

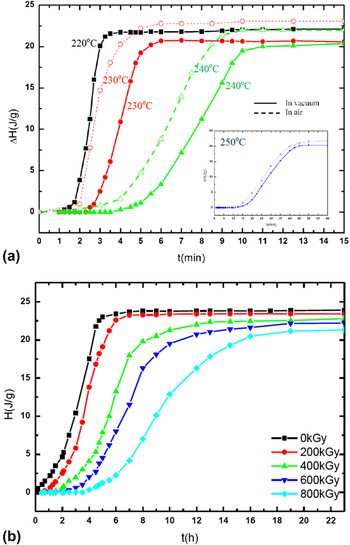
The solid lines in Fig. 3(a) show the total melting enthalpy, H, for sPS irradiated in vacuum. The dashed lines showing the data of sPs irradiated in air were obtained from our previous research.Reference Ting, Nyugen, Hu, Chen and Lee27 This is the area of all three peaks, which is proportional to crystallinity of the sample, as a function of crystallization time at four T c values. Note that the melting enthalpy curve at 250 °C is shown in the inset because its crystallization time is much longer than those at lower T cs. A general S shape was observed, and these results are similar to those of nonirradiated and air gamma-irradiated sPS samples.Reference Ting, Nyugen, Hu, Chen and Lee27,Reference Liu, Nguyen, Yang and Lee29 The induction time (defined as the time between t = 0 and the onset of a steep rise in melting enthalpy), the rate of H change with crystallization time, and the time required to complete crystallization increased significantly with increasing crystallization temperature. Obviously, the driving force for crystallization is proportional to the difference between the melting temperature and T c. Therefore, at a given melting temperature, a lower T c corresponds to a faster crystallization rate and a larger enthalpy change. The dashed lines in Fig. 3(a) depict the total melting enthalpies for sPS irradiated in air at 400 kGy and crystallized at 230, 240, and 250 °C, respectively. At a dose of 400 kGy, the induction time and the time required to complete crystallization were longer for vacuum irradiated sPS than for air irradiated sPS, while the rate of change of H with t was shorter for vacuum irradiated sPS than for air irradiated sPS. This phenomenon also occurred for the other doses and crystallization temperatures.
(a) Total melting enthalpy as a function of t for vacuum gamma-irradiated sPS and air gamma-irradiated sPS at 400 kGy and crystallized at different T cs; (b) plot of H versus t for vacuum gamma-irradiated sPS at different doses and crystallized at 260 °C.

Further, Fig. 3(b) shows a plot of total melting enthalpy versus crystallization time for sPS irradiated in vacuum at different doses and crystallized at 260 °C. The induction time, the rate of H change with t, and the time required to complete crystallization are more pronounced with increasing dose. The effect of increasing dose on total melting enthalpy behavior of vacuum irradiated sPS is similar to that noted on H versus t behavior as T c increases.
The relative percent of crystalline material, X it, in each of the three melting peaks (P1, P2, and P3) at a crystallization time, t, was obtained from the area of the ith Gaussian distribution shown in Eq. (1) as:
 $${X_{it}}\left( \% \right) = {{100\int_{ - \infty }^\infty {\left( {{{\Delta {H_i}\left( t \right)} \mathord{\left/ {\vphantom {{\Delta {H_i}\left( t \right)} {\Delta T}}} \right. \kern-\nulldelimiterspace} {\Delta T}}} \right){\rm{d}}T} } \mathord{\left/ {\vphantom {{100\int_{ - \infty }^\infty {\left( {{{\Delta {H_i}\left( t \right)} \mathord{\left/ {\vphantom {{\Delta {H_i}\left( t \right)} {\Delta T}}} \right. \kern-\nulldelimiterspace} {\Delta T}}} \right){\rm{d}}T} } {\sum\limits_{i = 1}^n {\int_{ - \infty }^\infty {\left( {{{\Delta {H_i}\left( t \right)} \mathord{\left/ {\vphantom {{\Delta {H_i}\left( t \right)} {\Delta T}}} \right. \kern-\nulldelimiterspace} {\Delta T}}} \right){\rm{d}}T} } }}} \right. \kern-\nulldelimiterspace} {\mathop\sum\limits_{i = 1}^n {\int_{ - \infty }^\infty {\left( {{{\Delta {H_i}\left( t \right)} \mathord{\left/ {\vphantom {{\Delta {H_i}\left( t \right)} {\Delta T}}} \right. \kern-\nulldelimiterspace} {\Delta T}}} \right){\rm{d}}T} } }}$$
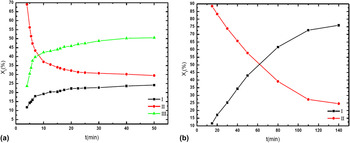
The variation of crystalline fractions, X it, of P1, P2, and P3 with t for vacuum gamma-irradiated sPS at 400 kGy and crystallized at 230 and 250 °C is shown in Figs. 4(a) and 4(b), respectively. At T c = 230 °C, X 1t and X 3t increased with increasing t, but X 2t exhibits the opposite trend. Compared to X 2t and X 3t, X 1t was the smallest at all crystallization times. The plot of X 2t versus t intercepted with the plot of X 3t versus t at a crystallization time of approximately 7 min. The X 2t value was greater than the X 3t value at short times. At this crystallization temperature, the rate of X 1t change decreased with increasing t. It can be seen from Fig. 4(a) that the relative decrease for X 2t was greatest and it changed from 53.8% at t = 3 min to 35.7% at t = 50 min. Similar curves of X it versus t were obtained from other T c values between 220 and 242 °C and other doses. However, the plot of X it versus t for air gamma-irradiated sPS displayed an opposite trend; X 1t and X 3t values decreased with increasing t and X 2t values increased at T c between 220 and 242 °C.Reference Ting, Nyugen, Hu, Chen and Lee27 In addition, the curve of X 3t versus t vanished at 250 °C for vacuum gamma-irradiated sPS regardless of the radiation dose, and this is similar to that obtained for air gamma-irradiated sPS. At this crystallization temperature, X 1t increased and X 2t decreased rapidly between 15 and 80 min and slowed down thereafter for vacuum gamma-irradiated sPS [Fig. 4(b)] for all doses between 200 and 800 kGy. The opposite effect was noted in samples irradiated in air. In air irradiated sPS, X 1t decreased and X 2t increased with t. In vacuum irradiated sPS, X 1t was the smallest fraction (∼11% after 15 min) at short times (t ≤ 40 min) and became a major component at the long times (74% after 140 min). On the contrary, X 2t was the largest fraction in vacuum gamma-irradiated sPS at short times and changed to a minor component at long times. The X 1t line intercepted with X 2t line at approximately 60 min for vacuum gamma-irradiated sPS at 400 kGy. Because X 1t is equal to 1 − X 2t at 250 °C, X 1t can be calculated if X 2t is given and vice versa. The above behavior also occurred for vacuum gamma-irradiated sPS at other doses crystallized at 250 °C. Furthermore, the curves of X 1t and X 2t versus t for air irradiated sPS crystallized at 250 °C displayed an opposite trend.
Variation of crystallized fractions, X it, with t for the vacuum gamma-irradiated sPS at 400 kGy and crystallized at (a) T c = 230 °C and (b) T c = 250 °C. Note that X 3t is vanished at T c = 250 °C.

At a fixed T c and t, the total melting enthalpy of the vacuum gamma-irradiated sPS decreased with increasing radiation dose. However, it is difficult to define the effect of radiation dose on X it at a fixed T c or t. Generally, X 1t decreased with increasing radiation dose at T c = 220 °C, but increased with increasing radiation dose at T c = 230 °C and T c = 240 °C; X 2t increased with increasing dose between T c = 220 and 240 °C; and X 3t decreased with increasing dose between 220 and 240 °C. X 1t increased with increasing dose at T c = 250 °C, while X 2t exhibited an opposite trend. The effect of radiation dose on X it at different T is and times is listed in Tables I–III.
A i (J/g °C), T i (°C), and γi (°C) for vacuum gamma-irradiated sPS at 400 kGy and crystallized at 250 °C for different times t (min); i = 1, 2.

A i (J/g °C), T i (°C), and γi (°C) for vacuum gamma-irradiated sPS at 400 kGy and crystallized at 260 °C for different times t (min); i = 1.

The isothermal crystallization kinetics of sPS irradiated with gamma rays were studied using the Avrami equationReference Liu, Nguyen, Yang and Lee29–Reference Avrami31:
 $$1 - {X_{it}} = \exp \left( { - {k_i}{t^{{n_i}}}} \right)$$
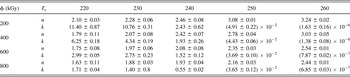
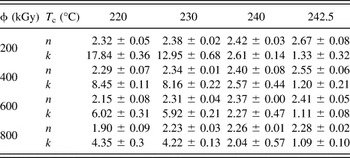
where X it is the crystalline fraction at time t, k i is the crystallization rate, n i is the exponent related to the growth mode and nucleation mode, and subscript i represents the ith melting peak corresponding to the crystalline form in sPS as stated in the previous section. The Avrami model was successfully applied to investigate the crystallization kinetics of polymorphic nonirradiated sPS.Reference Wessen34–Reference Wu, Hsu, Chen and Wu36 The Avrami equation [or Eq. (3)] is valid only for crystal growth. For the vacuum gamma-irradiated sPS, the crystalline fractions of X 1t and X 3t (i.e., the crystalline β′ and β forms) increased, but that of X 2t (α form) at crystallization temperatures between 220 and 242 °C decreased with t [e.g., see Fig. 4(a) for the vacuum gamma-irradiated sPS at 400 kGy and T c = 230 °C]. Therefore, Eq. (3) was used to study the crystallization kinetics of the β and β′ in vacuum gamma-irradiated sPS. Tables IV and V list n and k for the β and β′ forms, respectively. Note that the β′ form was not present at T c = 250 and 260 °C. The exponent n increased with increasing T c, but decreased with increasing radiation dose for both β and β′ forms in vacuum gamma-irradiated sPS. This is similar to what was observed for the α form in air irradiated sPS.Reference Ting, Nyugen, Hu, Chen and Lee27 However, this is different from that for nonirradiated sPS, where n was reported to be equal to 3 for all T c valuesReference Wessen34 and to be constant for 122 °C ≤ T c ≤132 °C and 244 °C ≤ T c ≤ 252 °C.Reference Wang, Huang, Cheng, Cheng and Shong37 On the other hand, k decreased with increasing crystallization temperature and gamma-ray dose for both vacuum and air irradiated sPS. Wang et al.Reference Wang, Huang, Cheng, Cheng and Shong37 also observed that k decreased with increasing gamma ray dose. Ting et al.Reference Ting, Nyugen, Hu, Chen and Lee27 found that the glass transition temperature of air irradiated sPS increases with gamma ray dose, implying that chain crosslinks increase with gamma ray dose. The more the polymer chain crosslinks, the lower the chain mobility. These results imply that gamma radiation retards the crystallization of β and β′ forms in vacuum irradiated sPS and the crystallization of α form in air irradiated sPS.
The values of exponent n and crystallization rate k (10−2 min−n) at different T cs (°C) and radiation doses ϕ for crystalline β in vacuum gamma-irradiated sPS.

The values of exponent n and crystallization rate k (10−2 min−n) at different T cs and radiation doses ϕ for crystalline β′ in vacuum gamma-irradiated sPS.

For a given radiation dose, the crystallization rate, k, varies with the crystallization temperature. To calculate the activation energy of crystallization kinetics, we find the crystallization half time that has the same unit at all crystallization temperatures. The crystallization half time τ(T) at each temperature was determined from Eq. (3) at X it = 0.5. That is,
 $$\tau \left( T \right) = {\left[ {{{{\rm{ln}}2} \mathord{\left/ {\vphantom {{{\rm{ln}}2} {k\left( T \right)}}} \right. \kern-\nulldelimiterspace} {k\left( T \right)}}} \right]^{{1 \mathord{\left/ {\vphantom {1 n}} \right. \kern-\nulldelimiterspace} n}}}$$
and 1/τ(T) satisfied a modified Arrhenius equation as
 $${1 \mathord{\left/ {\vphantom {1 {\tau \left( T \right)}}} \right. \kern-\nulldelimiterspace} {\tau \left( T \right)}} = \left( {{1 \mathord{\left/ {\vphantom {1 {{\tau _0}}}} \right. \kern-\nulldelimiterspace} {{\tau _0}}}} \right)\exp \left[ {{{ - U} \mathord{\left/ {\vphantom {{ - U} {R\left( {T - {T_\infty }} \right)}}} \right. \kern-\nulldelimiterspace} {R\left( {T - {T_\infty }} \right)}}} \right]\exp \left[ {{{ - A} \mathord{\left/ {\vphantom {{ - A} {T\left( {{T_{\rm{m}}} - T} \right)}}} \right. \kern-\nulldelimiterspace} {T\left( {{T_{\rm{m}}} - T} \right)}}} \right]$$
where τ0, U, A, R, T ∞, and T m are pre-exponent factor, the activation energy, the thermodynamic driving force, gas constant, Kelvin temperature in which polymer chains stop segmental motion, and the melting temperature, respectively. Note that T ∞ is usually assumed as T g − 30 K, where T g is the glass transition temperature. Equation (5) is rearranged as
 $$Z = - \ln \tau \left( T \right) + {A \mathord{\left/ {\vphantom {A {T\left( {{T_{\rm{m}}} - T} \right)}}} \right. \kern-\nulldelimiterspace} {T\left( {{T_{\rm{m}}} - T} \right)}} = {{ - \ln {\tau _0} - U} \mathord{\left/ {\vphantom {{ - \ln {\tau _0} - U} {R\left( {T - {T_\infty }} \right)}}} \right. \kern-\nulldelimiterspace} {R\left( {T - {T_\infty }} \right)}}$$
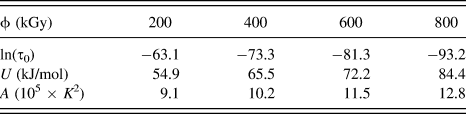
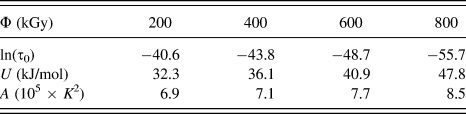
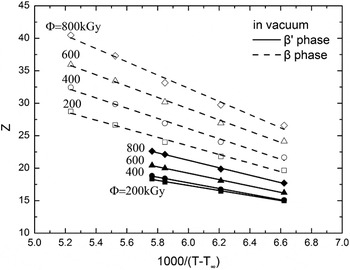
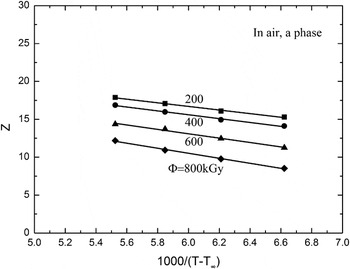
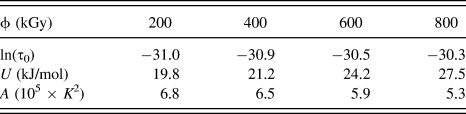
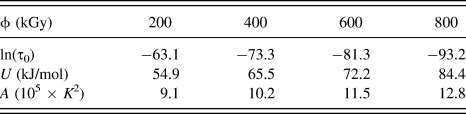
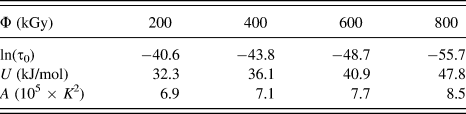
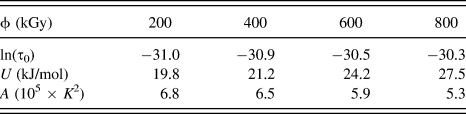
The dashed and solid lines of Z versus 1/(T − T ∞) for the β and β′ crystalline forms, respectively, in sPS irradiated in vacuum at different gamma doses are shown in Fig. 5. T ∞ is assumed to be 342 K and T m is equal to 583 K. U and ln(τ0) were obtained from slope and intercept of Fig. 5; and A was calculated using least square curve fitting. The values of ln(τ0), U, and A for β and β′ crystalline forms in vacuum irradiated sPS are presented in Tables VI and VII, respectively. The activation energy U and thermodynamic driving force for sPS irradiated in vacuum increased with increasing dose. The results for U and A suggest that higher activation energies and driving forces are required to crystallize sPS material irradiated in vacuum at higher doses than at lower doses. For comparison, Fig. 6 displays plots of Z versus 1/(T − T ∞) for the α crystalline form in air gamma-irradiated sPS at different doses from data obtained in Ref. Reference Ting, Nyugen, Hu, Chen and Lee27. The values of ln(τ0), U, and A for the α form in air irradiated sPS materials are listed in Table VIII and were obtained from our previous work.Reference Ting, Nyugen, Hu, Chen and Lee27 The activation energy, U, for air irradiated sPS α phase increased with increasing dose, but the thermodynamic driving force, A, decreased with increasing dose. However, both the rate of crystallization and the crystalline fraction decreased with increasing dose, suggesting that the high energy required to crystallize α form in air gamma-irradiated sPS corresponds to the low rate of crystallization and to the crystalline fraction, not the thermodynamic driving force. This is because crosslinks of polymer chain increase with gamma ray dose that retards the crystallization.
The values of crystallization half time τ0 (min−1), thermodynamic driving force A (105 × K 2), and activation energy U (kJ/mol) of β form in vacuum gamma-irradiated sPS samples for different doses ϕ.
The values of crystallization half time τ0 (min−1), thermodynamic driving force A (105 × K 2), and activation energy U (kJ/mol) of β′ form in vacuum gamma-irradiated sPS samples for different doses ϕ.
Plots of Z versus 1000/(T − T ∞) for β and β′ crystalline forms in vacuum gamma-irradiated sPS at different gamma ray doses.

Plots of Z versus 1000/(T − T ∞) for α crystalline forms in air gamma-irradiated sPS at different gamma ray doses.

The values of crystallization half time τ0 (min−1), thermodynamic driving force A (105 × K 2), and activation energy U (kJ/mol) of α form in air gamma-irradiated sPS samples for different doses ϕ.
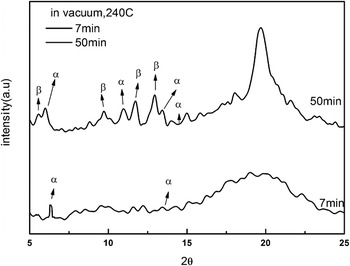
X-ray diffraction patterns of isothermally crystallized sPS irradiated in air and vacuum for different doses were reported elaborately in the previous study.Reference Liu, Nguyen, Yang and Lee29 In this study, XRD was used to confirm the relative changes of the α and β crystalline forms with crystallization time in vacuum irradiated sPS at different doses. Figure 7 displays the XRD patterns for t = 7 and 50 min at a dose of 800 kGy followed by isothermal crystallization at 240 °C. The diffraction angles, diffraction planes, and the corresponding diffraction peaks have been reported previously and are listed in Table IX.Reference Liu, Nguyen, Yang and Lee29 A mixture of α and β crystalline forms exists in the gamma-irradiated sPS regardless of the irradiation environment. This is consistent with the DSC melting enthalpy data. As shown in Fig. 7, the diffraction peaks of the α form at 2θ = 6.7° (α and α″) and 14° (α″) were lower at 50 min than at 7 min and those of β form at 2θ = 6.2° (β and β′), 10.4° (β and β′), and 12.3° (β and β′) increased with crystallization time. These results suggest that the crystallinity fraction of the β form increased and that of α form decreased in the vacuum gamma-irradiated sPS materials. These results qualitatively agreed with that obtained by DSC as shown in Fig. 4(a). However, this phenomenon is different from that as the diffraction peaks of α form increased, and those of β and β′ forms decreased in air irradiated sPS materials.Reference Ting, Nyugen, Hu, Chen and Lee27
XRD pattern of sPS irradiated in vacuum of 800 kGy and then crystallized at 240 °C for times being equal to 7 and 50 min.

The crystalline forms of sPS cooled from melt temperature and the corresponding diffraction angle 2θ and diffraction plane (h k l).Reference Liu, Nguyen, Yang and Lee29

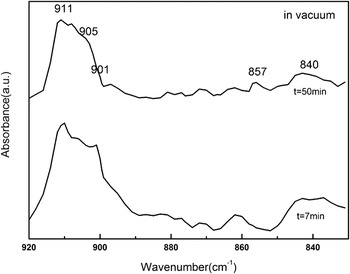
FTIR not only characterizes the chemical changes caused by the gamma ray irradiation, but also follows the morphological evolution of the irradiated samples during crystallization, documenting amorphous material, and the α and β crystalline forms. Figure 8 shows the FTIR-ATR spectra in the 800–920 cm−1 region for t = 20 and 50 min for vacuum irradiated sPS at 800 kGy and crystallized at 240 °C. The bands at 840 and 905 cm−1 are assigned to the amorphous materials, those at 857 and 911 cm−1 are due to the β form, and the 901 cm−1 was assigned to the α form.Reference Ho, Lin, Hsieh and Chang28,Reference Woo and Wu33 For irradiation in vacuum, the peak intensity at 857 cm−1 was higher at t = 50 min than that at t = 20 min, and the band at 901 cm−1 had the opposite trend. These results imply that the crystallinity fraction of the β form increased and that of the α form decreased with t for vacuum gamma-irradiated sPS. FTIR results were consistent qualitatively with XRD and DSC data. However, the band at 901 cm−1 was more pronounced at longer crystallization time in air gamma-irradiated sPS, but the peak intensities at 911 cm−1 had the opposite trend.Reference Ting, Nyugen, Hu, Chen and Lee27 The effect of irradiation environment on chemical changes of isothermally crystallized gamma-irradiated sPS was studied by Liu et al. using FTIR spectroscopy.Reference Liu, Nguyen, Yang and Lee29 They found a broad absorption band peak near 1730 cm−1 for sPS irradiated in air due to the formation of carbonyl groups (C=O). They proposed two schemes of reaction pathways for ketone and aldehyde formation of sPS irradiated in air. In the absence of oxygen, macromolecular free radicals of sPS under gamma irradiation underwent crosslinking to form large molecules. The chemical processes in PS occurred during UV irradiation in air and vacuum were reviewed by Rabek.Reference Rabek38
FTIR spectra at t = 20 and 50 min of sPS irradiated in vacuum at 800 kGy and then crystallized at 240 °C.

IV. CONCLUSIONS
The isothermal crystallization kinetics of vacuum gamma-irradiated sPS have been investigated. The results obtained for vacuum gamma-irradiated sPS are compared to those obtained for air gamma-irradiated sPS. Some important findings are summarized:
(1) The melting temperatures of the α, β, and β′ crystalline forms are unchanged regardless of the radiation environment.
(2) For samples irradiated in vacuum and air, the crystallinity-fractions decrease with increasing crystallization temperature; the melting enthalpies increase with increasing crystallization time; and the times to complete crystallization increase with increasing dose.
(3) The β and β′ crystalline fractions in vacuum gamma-irradiated sPS increased with increasing t; the α fractions decrease with t. This is exactly opposite to what is observed in samples irradiated in air.
(4) The crystallization rates of β and β′ in the vacuum gamma-irradiated sPS decreased with increasing dose. In air gamma-irradiated sPS, crystallization rates of the α form also decrease as the dose increases.
(5) The activation energy and thermodynamic driving force for crystallization of β and β′ forms in vacuum gamma-irradiated sPS increase with increasing radiation dose. On the contrary, the thermodynamic driving force for crystallization of α form decreases with radiation dose. The activation energy, U, for air irradiated sPS α phase increased with increasing dose, but the thermodynamic driving force, A, decreased with increasing dose. However, both the rate of crystallization and the crystalline fraction decreased with increasing dose, suggesting that the high energy required to crystallize α form in air gamma-irradiated sPS corresponds to low rate of crystallization and to the crystalline fraction, not the thermodynamic driving force.
Overall, the morphology and kinetics of gamma irradiated sPS are significantly influenced by the presence or absence of oxygen. The α crystalline form appears to evolve to a greater extent than the β and β′ forms in air irradiated samples. Whereas, β and β′ forms are dominant in the vacuum irradiated samples. This strong effect on microstructure and properties necessitates careful design of sPS devices used in ionizing radiation environments.
ACKNOWLEDGMENT
This work was financially supported by the Ministry of Science and Technology, Taiwan.