1 Introduction
Evaporative drying is a phenomenon that occurs in many scientific and engineering processes, for example, design of new materials and structures, food preserving and production of ceramics and paper. Recently, the self-assembly of nanoparticles induced by controlled evaporation of colloidal suspensions has attracted a lot of attention as a method for the fabrication of complex materials (Hamon et al. Reference Hamon, Postic, Mazari, Bizien, Dupuis, Even-Hernandez, Jimenez, Courbin, Gosse, Artzner and Marchi-Artzner2012; Boles, Engel & Talapin Reference Boles, Engel and Talapin2016; Brunschwiler et al. Reference Brunschwiler, Zürcher, Del Carro, Schlottig, Burg, Zimmermann, Zschenderlein, Wunderle, Schindler-Saefkow and Stässle2016). Zurcher et al. (Reference Zurcher, Chen, Burg, Zimmermann, Straessle, Studart and Brunschwiler2016) and Städler et al. (Reference Städler, Carro, Zurcher, Schlottig, Studart and Brunschwiler2017) have been working on nanoparticle self-assembly by non-isothermal evaporation to create underfills with high thermal conductivity applied as materials for electronic packaging. Hamon et al. (Reference Hamon, Postic, Mazari, Bizien, Dupuis, Even-Hernandez, Jimenez, Courbin, Gosse, Artzner and Marchi-Artzner2012) conducted drying experiments of gold-nanorod-based materials on a textured substrate and observed that the self-assembled nanostructures are locally ordered as a smectic B phase, which could be used for amplifying optical signals. Boles et al. (Reference Boles, Engel and Talapin2016) described that different shapes of nanocrystal like spheres or polyhedral rods can be used to design new functional materials with unique optical, magnetic, electronic and catalytic properties. In these studies, the self-assembly of nanomaterials is highly dependent on the control of drying of colloidal suspensions. The drying pattern determines how and where the particles accumulate and assemble, while drying rate affects the yield of generation of self-assembled structures. Therefore, it is essential to study the mechanisms of liquid drying in these micro-pore structures to guide the self-assembly processes.
Drying of pore structures includes heat and mass transfer problem that involves phase change, liquid and gas flows inside the porous medium, and diffusive or convective flows to the outside surrounding environment. The evaporation pattern and rate depend on the geometry of the structure, such as the pore size and distribution, and on the environmental conditions, such as the temperature, vapour pressure and air speed. Experiments have been done to study drying in micro-pore structures. Laurindo & Prat (Reference Laurindo and Prat1998) investigated the drying rate in a two-dimensional (2D) quasi-isothermal etched micro-model of three basic cases, namely without/stabilizing/destabilizing gravity, and found that thin liquid films have significant contributions to the drying rate. Yiotis et al. (Reference Yiotis, Boudouvis, Stubos, Tsimpanogiannis and Yortsos2004) studied the effect of liquid films on the drying of porous media, and they found the effect to be dominant when capillarity controls the process. Pillai, Prat & Marcoux (Reference Pillai, Prat and Marcoux2009) studied slow evaporation of liquids in 2D porous media with three sides insulated and one side exposed to air for drying. The porous medium was divided into two layers with different porosities and pores sizes, and only one layer was exposed to air. When the larger-pore layer was exposed, the inner smaller-pore layer started drying only after the outer larger-pore layer was totally dried out, and the evaporation rate decayed. When the smaller-pore layer was exposed, both the smaller-pore layer (due to evaporation) and larger-pore layer (due to capillary pumping) dried out and the evaporation rate was bilinear. Most recently, Chen et al. (Reference Chen, Duru, Joseph, Geoffroy and Prat2017, Reference Chen, Joseph, Geoffroy, Prat and Duru2018) studied how to control drying kinetics by designing three different pore size distributions in micro-sized porous media. They demonstrated two types of control, i.e. controlling the sequence of primary invasions through pore space and controlling the secondary liquid structures such as films/bridges. For the liquid films/bridges, they provide hydraulic connectivity between the bulk liquid cluster and external rim. The bulk transports liquid to the rim due to capillary pumping, and the liquid at the rim dries faster than at the centre since it is closer to open air. Therefore, a higher average evaporation rate was obtained. Fantinel et al. (Reference Fantinel, Borgman, Holtzman and Goehring2017) studied small-scale heterogeneity of the evaporation in a micro-model made of pillar arrays, and observed no clear effect on how evaporation rates evolved. Besides the effects of external force, pore size/distribution and liquid films, the influence of temperature on drying patterns and drying rate was explored. Vorhauer et al. (Reference Vorhauer, Tran, Metzger, Tsotsas and Prat2013) compared isothermal and non-isothermal drying in a 2D square pore network. These experiments showed that a stabilized gas–liquid region was established with decreasing temperature, while faster breakthrough and an extended two-phase zone were observed under isothermal condition. Vorhauer, Metzger & Tsotsas (Reference Vorhauer, Metzger and Tsotsas2011) also observed that drying patterns and drying rates significantly depend on the direction of temperature gradient and pore size distribution.
The development of numerical models enables one to simulate the drying processes, but taking into account accurately all drying phenomena remains a challenge. To describe the drying process, there are mainly two categories of numerical models: continuum models and pore network models. In continuum models, overall parameters like porosity, permeability and diffusivity are used to represent the transport properties of pore structures. Continuum models (Defraeye Reference Defraeye2014) have been successfully used to study drying behaviour in pore structures such as fruits (Defraeye et al. Reference Defraeye, Aregawi, Saneinejad, Vontobel, Lehmann, Carmeliet, Verboven, Derome and Nicolaï2013) and porous plate (Defraeye et al. Reference Defraeye, Houvenaghel, Carmeliet and Derome2012). The continuum models are very efficient in computation, but they lack the ability to analyse local pore-scale drying phenomena. The pore network model (PNM), originally proposed by Fatt (Reference Fatt1956), represents a porous medium with pores and throats that interact according to different physical mechanisms such as capillarity, gravity and pressure dissipation by flow. Over the years, the PNM has been improved by incorporating film effect (Prat Reference Prat2007; Vorhauer et al. Reference Vorhauer, Wang, Kharaghani, Tsotsas and Prat2015) and viscous effect (Metzger & Tsotsas Reference Metzger and Tsotsas2008). The influence of temperature (Surasani, Metzger & Tsotsas Reference Surasani, Metzger and Tsotsas2008, Reference Surasani, Metzger and Tsotsas2009) is also developed to simulate non-isothermal drying in 2D (Taslimi Taleghani & Dadvar Reference Taslimi Taleghani and Dadvar2014) and three-dimensional (3D) (Surasani, Metzger & Tsotsas Reference Surasani, Metzger and Tsotsas2010) pore networks. Through these developments, PNMs have become powerful tools for studying drying of pore structures. However, PNMs remain approximations when simulating real complex porous materials where pores and throats are not regular, or when the sizes of pores and throats are quite similar, even if based on actual X-ray computed tomography (Blunt et al. Reference Blunt, Bijeljic, Dong, Gharbi, Iglauer, Mostaghimi, Paluszny and Pentland2013). The coupling of inner pore-scale liquid capillary flow as well as evaporation with outside laboratory-scale vapour diffusion as well as gas convection remains complex in PNMs (Yiotis et al. Reference Yiotis, Tsimpanogiannis, Stubos and Yortsos2007; Shaeri, Beyhaghi & Pillai Reference Shaeri, Beyhaghi and Pillai2013).
In the last few decades, the lattice Boltzmann (LB) method has been widely used to study complex single-phase and multiphase fluid flow in real complex pore structures (Kang, Zhang & Chen Reference Kang, Zhang and Chen2002; Sukop & Or Reference Sukop and Or2003; Huang et al. Reference Huang, Li, Liu and Lu2009; Boek & Venturoli Reference Boek and Venturoli2010; Chen et al. Reference Chen, Luan, He and Tao2012, Reference Chen, Kang, Mu, He and Tao2014; Liu, Zhang & Valocchi Reference Liu, Zhang and Valocchi2015; Liu et al. Reference Liu, Kang, Leonardi, Schmieschek, Narváez, Jones, Williams, Valocchi and Harting2016; Li et al. Reference Li, Luo, Kang, He, Chen and Liu2016a ). Because of the simplicity in dealing with complex wall boundaries, LB models have proved to be very advantageous in simulating flow in pore structures. For simulating multiphase flow, LB models can capture the interface automatically by incorporating intermolecular-level interactions of kinetic nature, a feature which is very advantageous over traditional computational fluid dynamics methods such as volume of fluid (Hirt & Nichols Reference Hirt and Nichols1981) or level-set method (Sussman, Smereka & Osher Reference Sussman, Smereka and Osher1994; Osher & Fedkiw Reference Osher and Fedkiw2001) that both require interface tracking and reconstruction. With the advantages of easily dealing with complex wall boundaries and capturing interfaces automatically, LB models have already been successfully applied to study immiscible fluid flow in pore structures with effects of viscosity ratio, capillary number, wettability and gravity, under different permeability (Li, Pan & Miller Reference Li, Pan and Miller2005; Huang et al. Reference Huang, Li, Liu and Lu2009; Ghassemi & Pak Reference Ghassemi and Pak2011). The above applications of LB models are all under isothermal conditions, while non-isothermal LB models are still under development and their applications are very limited. Recently, thermal multiphase LB models have been used to simulate non-isothermal droplet evaporation (Li, Zhou & Yan Reference Li, Zhou and Yan2016b ) and boiling (Li et al. Reference Li, Kang, Francois, He and Luo2015; Gong et al. Reference Gong, Yan, Chen and Wright2018). Yu et al. (Reference Yu, Li, Zhou, Zhou and Yan2017) have studied droplet evaporation on different heated heterogeneous solid surfaces. Zhang, Hong & Cheng (Reference Zhang, Hong and Cheng2015) simulated liquid thin-film evaporation on a heated microstructural surface, and studied the heat transfer with different surface wettability. However, the mechanisms of bulk liquid evaporation in pore structures are yet to be studied with LB models.
In the work described above, either the experiments lacked numerical validations, or the numerical models were still rough. In this paper, we study both numerically and experimentally non-isothermal bulk liquid evaporation in specifically designed micro-pore structures, i.e. spiral-shaped micro-pore structure (SMS) and gradient-shaped micro-pore structure (GMS). Our proposed LB model here is more accurate in capturing the physics, and it helps us to understand the mechanisms better. Firstly, we introduce the thermal entropic multiple-relaxation-time multiphase lattice Boltzmann model (T-EMRT-MP LBM) and validate it with experiments in the literature by simulating single-droplet evaporation on a heated hydrophobic substrate. Then we briefly describe the experiments as well as the simulation set-ups. Finally liquid evaporation in SMS and GMS is simulated and compared with our experimental results both qualitatively and quantitatively. A better understanding of the evaporation process is obtained by investigating liquid mass, evaporation rate, liquid–vapour interface area and simulated heat transfer during evaporation. Results from our studies indicate ways to control liquid evaporation paths in pore structures as well as ways to maintain a high evaporation rate.
2 Model development
2.1 EMRT-MP LBM
We apply the EMRT-MP LBM to simulate two-phase flow. The EMRT-MP LBM was developed by Qin et al. (Reference Qin, Moqaddam, Kang, Derome and Carmeliet2018) to simulate two-phase flow with a large range of Reynolds and Weber numbers at high density ratios. Here we briefly summarize the method. The LB equation for the populations of discrete velocities that incorporates the external force term is written as
 $$\begin{eqnarray}f_{i}(\boldsymbol{x}+\boldsymbol{v}_{i},t+1)=f_{i}^{\prime }\equiv (1-\unicode[STIX]{x1D6FD})f_{i}(\boldsymbol{x},t)+\unicode[STIX]{x1D6FD}f_{i}^{mirr}(\boldsymbol{x},t)+F_{i}.\end{eqnarray}$$
The equilibrium populations
 $f_{i}^{eq}$
maximize the entropy
 $S[f]=-\sum _{i=1}^{Q}f_{i}\ln (\,f_{i}/W_{i})$
under fixed density and momentum
 $\{\unicode[STIX]{x1D70C},\unicode[STIX]{x1D70C}\boldsymbol{u}\}=\sum _{i=1}^{Q}\{1,\boldsymbol{v}_{i}\}f_{i}^{eq}$
, where
 $W_{i}$
are the lattice weights (Karlin, Ferrante & Öttinger Reference Karlin, Ferrante and Öttinger1999; Chikatamarla, Ansumali & Karlin Reference Chikatamarla, Ansumali and Karlin2006). The parameter
 $0<\unicode[STIX]{x1D6FD}<1$
is determined by the kinematic viscosity
 $\unicode[STIX]{x1D708}$
through
 $\unicode[STIX]{x1D708}=c_{s}^{2}(1/(2\unicode[STIX]{x1D6FD})-1/2)\unicode[STIX]{x1D6FF}t$
. Here
 $c_{s}=\unicode[STIX]{x1D6FF}x/(\sqrt{3}\unicode[STIX]{x1D6FF}t)$
is the lattice speed of sound, and lattice units
 $\unicode[STIX]{x1D6FF}x=\unicode[STIX]{x1D6FF}t=1$
are used with lattice speed
 $c=1$
. The mirror state is constructed at each lattice site and every time step from the entropy maximization of the summarized post-collision population
 $f_{i}^{\prime }$
by relaxing high-order moments properly (Karlin, Bösch & Chikatamarla Reference Karlin, Bösch and Chikatamarla2014; Bösch, Chikatamarla & Karlin Reference Bösch, Chikatamarla and Karlin2015).
The last term
 $F_{i}=[f_{i}^{eq}(\unicode[STIX]{x1D70C},\boldsymbol{u}+\unicode[STIX]{x0394}\boldsymbol{u})-f_{i}^{eq}(\unicode[STIX]{x1D70C},\boldsymbol{u})]$
in (2.1) represents the fluid–fluid cohesive force for phase separation and the fluid–solid interaction for realizing various wettability. The forces are implemented by evaluation of the flow velocity increment
 $\unicode[STIX]{x0394}\boldsymbol{u}=\boldsymbol{F}\unicode[STIX]{x1D6FF}t/\unicode[STIX]{x1D70C}$
with the force
 $\boldsymbol{F}=\boldsymbol{F}_{c}+\boldsymbol{F}_{w}$
. Real velocity of the fluid including the force term is
 $\boldsymbol{u}_{f}=\boldsymbol{u}+\unicode[STIX]{x0394}\boldsymbol{u}/2$
. To obtain a tunable surface tension, the multirange pseudopotential-based cohesive force is applied as (Sbragaglia et al.
Reference Sbragaglia, Benzi, Biferale, Succi, Sugiyama and Toschi2007)
 $$\begin{eqnarray}\boldsymbol{F}_{c}=-\unicode[STIX]{x1D713}(\boldsymbol{x})\mathop{\sum }_{i=1}^{Q}w(|\boldsymbol{v}_{i}|^{2})[G_{1}\unicode[STIX]{x1D713}(\boldsymbol{x}+\boldsymbol{v}_{i})+G_{2}\unicode[STIX]{x1D713}(\boldsymbol{x}+2\boldsymbol{v}_{i})]\boldsymbol{v}_{i},\end{eqnarray}$$
where the interaction potential
 $\unicode[STIX]{x1D713}=\sqrt{2(P_{EoS}-\unicode[STIX]{x1D70C}c_{s}^{2})/[(G_{1}+2G_{2})c^{2}]}$
, and
 $G_{1},G_{2}$
are coefficients to tune the surface tension. Here
 $P_{EoS}$
is the equation of state, and here we adopt the Carnahan–Starling equation of state (Yuan & Schaefer Reference Yuan and Schaefer2006). The other fluid–solid interaction force is represented as
 $$\begin{eqnarray}\boldsymbol{F}_{w}=-\unicode[STIX]{x1D713}(\boldsymbol{x})\mathop{\sum }_{i=1}^{Q}w({|\boldsymbol{v}_{i}|}^{2})[G_{1}\unicode[STIX]{x1D713}(\unicode[STIX]{x1D70C}_{w})I(\boldsymbol{x}+\boldsymbol{v}_{i})+G_{2}\unicode[STIX]{x1D713}(\unicode[STIX]{x1D70C}_{w})I(\boldsymbol{x}+2\boldsymbol{v}_{i})]\boldsymbol{v}_{i},\end{eqnarray}$$
where
 $I$
is the indicator function that equals unity at solid nodes and zero at fluid nodes,
 $\unicode[STIX]{x1D70C}_{w}$
is the parameter to determine wettability and
 $w(|\boldsymbol{v}_{i}|^{2})$
in
 $\boldsymbol{F}_{c}$
and
 $\boldsymbol{F}_{w}$
are appropriately chosen weights (Yuan & Schaefer Reference Yuan and Schaefer2006). With this EMRT-MP LBM, two-phase flow can be simulated for a large range of fluid viscosity and tunable surface tension (Qin et al.
Reference Qin, Moqaddam, Kang, Derome and Carmeliet2018).
2.2 T-EMRT-MP LBM
To model non-isothermal evaporation, the equation for heat transport in liquid and vapour phases including latent heat is coupled to the EMRT-MP LBM, referred to as the T-EMRT-MP LBM. The heat transport equation is derived from the local balance law for entropy (Anderson, McFadden & Wheeler Reference Anderson, McFadden and Wheeler1998). By neglecting viscous heat dissipation, the governing equation for temperature (
 $T$
) transport can be written as (Li et al.
Reference Li, Zhou and Yan2016b
; Yu et al.
Reference Yu, Li, Zhou, Zhou and Yan2017)
 $$\begin{eqnarray}\unicode[STIX]{x2202}_{t}T=-\boldsymbol{u}_{f}\boldsymbol{\cdot }\unicode[STIX]{x1D735}T+\frac{1}{\unicode[STIX]{x1D70C}C_{V}}\unicode[STIX]{x1D735}\boldsymbol{\cdot }(\unicode[STIX]{x1D706}\unicode[STIX]{x1D735}T)-\frac{T}{\unicode[STIX]{x1D70C}C_{V}}\left(\frac{\unicode[STIX]{x2202}P_{EOS}}{\unicode[STIX]{x2202}T}\right)_{P}\unicode[STIX]{x1D735}\boldsymbol{\cdot }\boldsymbol{u}_{f},\end{eqnarray}$$
where
 $\unicode[STIX]{x1D70C}$
is the fluid density,
 $\unicode[STIX]{x1D706}$
is the thermal conductivity and
 $C_{V}$
is the specific heat at constant volume. The first two terms on the right-hand side of equation (2.4) represent heat convection and conduction, respectively, while the last term corresponds to the latent heat for phase change. There are two approaches to solve the extended temperature equation. The first method is to use another LB equation with a source term, which induces error terms in the recovered macroscopic temperature equation, as explained by Li, Zhou & Yan (Reference Li, Zhou and Yan2017). The recent model developed by Gong et al. (Reference Gong, Yan, Chen and Wright2018) uses this method. The other way is to solve it with traditional numerical schemes like finite difference method. In this way, no error terms are introduced and the model is more accurate. In our paper, this equation is solved by finite difference method with second-order Runge–Kutta scheme for time discretization:
 $$\begin{eqnarray}T^{t+\unicode[STIX]{x1D6FF}t}=T^{t}+\frac{\unicode[STIX]{x1D6FF}t}{2}(h_{1}+h_{2}),\end{eqnarray}$$
where
 $h_{1},h_{2}$
are given as
 $$\begin{eqnarray}h_{1}=F(T^{t}),\quad h_{2}=F(T^{t}+\unicode[STIX]{x1D6FF}t\ast h_{1})\end{eqnarray}$$
and
 $F(T)$
represents the right-hand side of (2.4) while
 $\unicode[STIX]{x1D6FF}t$
is the time step in numerical iteration. For spatial discretization, isotropic central schemes are employed to evaluate the first-order derivative and the Laplacian (Lee & Lin Reference Lee and Lin2005).
The two-way coupling between the EMRT-MP LBM and temperature equation works as follows: at each time step, flow variables like density, velocity and pressure are firstly computed by solving EMRT-MP LBM; then they are plugged into the temperature equation to update the temperature field; finally the updated temperature is incorporated in the computing flow field by the equation of state for the next time step. The mesh used for solving the temperature equation is the lattice in EMRT-MP LBM, and in this way extra interpolations are not necessary for data exchange. The detailed explanation of how evaporation is considered is presented in appendix A.
2.3 Validation of T-EMRT-MP LBM
The study of droplet evaporation has been of much interest in both experimental and numerical research (Dunn et al.
Reference Dunn, Wilson, Duffy, David and Sefiane2009; Stauber et al.
Reference Stauber, Wilson, Duffy and Sefiane2014; Saxton et al.
Reference Saxton, Whiteley, Vella and Oliver2016). For a droplet of diameter
 $D$
evaporating at a constant temperature, the evaporation process is described by the well-known
 $D^{2}$
law. This law shows that the square of the droplet diameter decreases linearly with evaporation time, i.e.
 $D^{2}(t)/D_{0}^{2}=1-Kt$
, and that the coefficient
 $K$
is linearly dependent on thermal conductivity
 $\unicode[STIX]{x1D706}$
(Law Reference Law1982). Dash & Garimella (Reference Dash and Garimella2013) studied experimentally droplets evaporating on hydrophobic and superhydrophobic surfaces, and their results were shown to follow the
 $D^{2}$
law. Our model is a non-isothermal model, but it can be used to simulate this quasi-isothermal drying case by certain simulation set-ups. In appendix A, we have simulated single-droplet evaporation in a closed cavity and compared with the diameter square law as well as the result from Gong et al. (Reference Gong, Yan, Chen and Wright2018), to show the accuracy of our model. Since we mainly study non-isothermal evaporation in this paper, we validate our T-EMRT-MP LBM with droplet evaporation on a heated hydrophobic surface by comparing the evolutions of droplet volume, radius and contact angles with experiment results (Dash & Garimella Reference Dash and Garimella2014).
In the experiments by Dash & Garimella (Reference Dash and Garimella2014), the droplet is gently deposited on a heated surface with different temperatures. The droplet size is small, i.e.
 $3\pm 0.1~\unicode[STIX]{x03BC}\text{l}$
, so that gravity can be neglected. The experiments are done in ambient conditions with an air temperature of
 $T_{air}=(21\pm 0.5)\,^{\circ }\text{C}$
and relative humidity
 $(36\pm 2)\,\%$
. We consider two experiments with different surface temperatures of 40 and
 $50\,^{\circ }\text{C}$
. The surface has a contact angle of
 $120^{\circ }$
initially when the experiments start. The evaporation happens in a relatively static ambient condition without air flow; thus convective evaporation is neglected and diffusive evaporation is considered. Our simulations are carried out in a 3D domain with
 $N_{x}\times N_{y}\times N_{z}=160\times 160\times 100~\text{lattices}^{3}$
, with a droplet of diameter of
 $D_{0}=70$
lattice nodes initially located in the centre of a heated substrate. The lateral four sides and top boundary conditions are zero gradient for both velocity and temperature. The zero-gradient velocity boundary allows vapour flowing out freely. The density ratio of liquid and vapour is
 $\unicode[STIX]{x1D70C}_{l}/\unicode[STIX]{x1D70C}_{v}\approx 30$
with temperature ratio of
 $T/T_{c}=0.75$
, where
 $T_{c}$
is the critical temperature. The vapour temperature is set as saturation temperature
 $T_{vapor}=T_{sat}=0.75T_{c}$
, while the substrate surface is considered to be a non-slip wall at a temperature of
 $T_{w1}=0.778T_{c}$
and
 $T_{w2}=0.794T_{c}$
for the cases of 40 and
 $50\,^{\circ }\text{C}$
surface temperature. These non-dimensional temperatures are chosen to keep the relative temperature differences in the simulations similar to those in the experiments, i.e.
 $(T_{w1}-T_{vapor})/T_{c}=2.8\,\%\approx (40-21.5)/647=2.85\,\%$
and
 $(T_{w2}-T_{vapor})/T_{c}=4.4\,\%\approx (50-21.5)/647=4.41\,\%$
, where
 $T_{c}=647$
K is the water critical temperature. As
 $T_{w}>T_{vapor}$
, the droplet gradually evaporates because of the heat conducted from the substrate to the boundaries. The evaporation continues because of the difference in vapour pressure between the liquid–vapour interface and the outlet as explained in § 2.2. Note that all the variables here are in lattice units, and the analysis in the following work is based on the similarity of non-dimensional numbers between experiment and LBM, as discussed below, guaranteeing similar fluid and heat/mass transport phenomena being studied in experiments and LBM.
Evaporating droplet at normalized time
 $t^{\ast }=0.14$
. (a) Half-droplet cross-section profile and boundary conditions; (b) temperature contours; (c) streamlines inside (Marogoni flow) and outside the droplet (evaporated vapour).

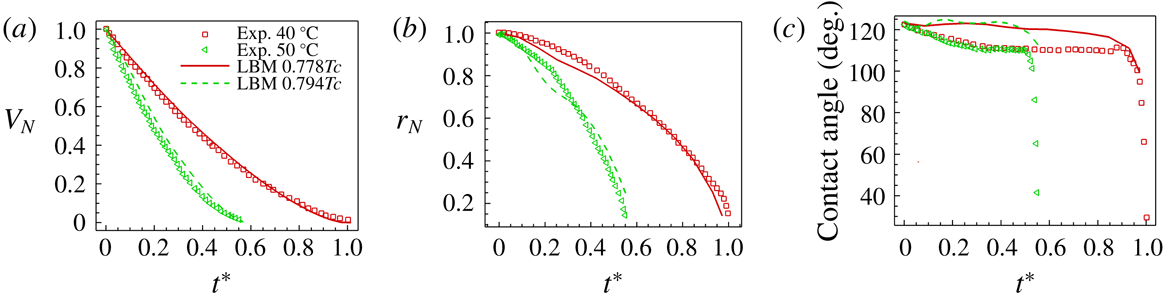
Comparisons between T-EMRT-MP LBM simulations and experiments. (a) Normalized droplet volume; (b) normalized droplet contact radius; (c) droplet contact angle.

The analysis of droplet evaporation is analysed using normalized variables, i.e.
 $V_{N}=V(t)/V_{0}$
,
 $r_{N}=r(t)/r_{0}$
and
 $t^{\ast }=t/t_{0}(T_{w1})$
, where
 $V_{0}$
,
 $r_{0}$
and
 $t_{0}(T_{w1})$
are the initial droplet volume, contact radius and total evaporation time at a substrate temperature of
 $T_{w1}$
. Using
 $t_{0}(T_{w1}=0.778T_{c})$
as a reference, we can compare the different evaporation rates for the different temperature cases, i.e.
 $T_{w1}=0.778T_{c}$
and
 $T_{w2}=0.794T_{c}$
. Figure 1 shows the results for an evaporating droplet on a heated substrate with temperature
 $T_{w1}=0.778T_{c}$
at normalized time
 $t^{\ast }=0.14$
. In figure 1(b) we show the temperature distribution inside and outside the droplet. We observe that the temperature decreases from the substrate to the outside. Because of the temperature variation at the liquid–vapour interface, the surface tension changes. Higher surface tension appears at locations of lower temperature, introducing a surface flow from bottom to top on the surface of the droplet. This surface flow induces a vortex flow inside the droplet, known as Marangoni flow (Liu et al.
Reference Liu, Valocchi, Zhang and Kang2013, Reference Liu, Valocchi, Zhang and Kang2014; Li et al.
Reference Li, Zhou and Yan2016b
; Wodlei et al.
Reference Wodlei, Sebilleau, Magnaudet and Pimienta2018). In figure 1(c) we show the Marangoni flow, which qualitatively validates our model.
Schematic representation of micro-pore structure: (a) side view; (b) top view.

In figure 2 we compare quantitatively the time evolution of normalized volume, contact radius and contact angle for experiment and simulation. Overall, we observe a good agreement between our simulation results and experiments, both showing a decrease of droplet volume and contact radius with time. In the experiments, the total evaporation time for a plate temperature of
 $50\,^{\circ }\text{C}$
is around
 $55\,\%$
of that for a temperature of
 $40\,^{\circ }\text{C}$
, which is also captured by the simulations. The variation in contact angle in the simulations is smaller compared with the experiments. A possible reason is that the heated surface is assumed to be totally smooth in the simulations, while in experiments it is not. According to Dash & Garimella (Reference Dash and Garimella2014), the roughness of a surface may lead to a
 $10^{\circ }$
contact angle hysteresis. By the end of the evaporation process, the change in contact angle in experiments becomes more obvious, with values below
 $40^{\circ }$
, while in the simulations, the decrease is less. However, in general, our T-EMRT-MP LBM simulation results agree well with the experimental results both qualitatively and quantitatively.
3 Experimental set-ups and procedures
In this paper, the liquid evaporation was studied in micro-cavities containing arrays of squared silicon (Si) micro-pillars, which were fabricated by photolithography and reactive-ion etching, obtaining a pillar height of
 $60~\unicode[STIX]{x03BC}\text{m}$
(figure 3
a). These pillars were aligned in SMS and GMS geometries, respectively. In a typical porous medium, there are two main drying periods, i.e. the constant rate period (CRP) and the decreasing rate period (DRP) (Irawan Reference Irawan2006; Yiotis et al.
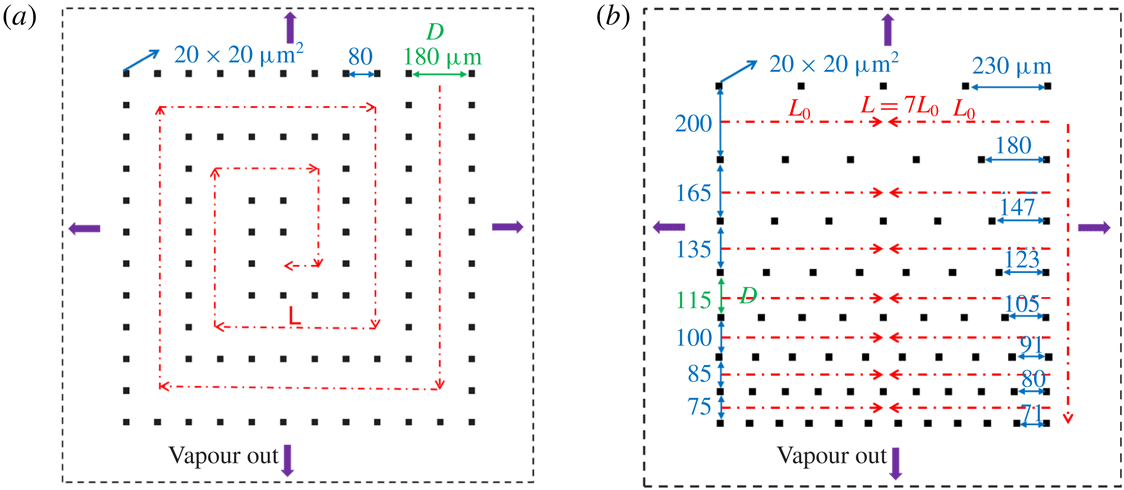
Reference Yiotis, Tsimpanogiannis, Stubos and Yortsos2006). The CRP is due to the capillary pumping effect, which is the internal liquid transport from large pore spaces inside the porous medium to small ones maintaining liquid water at the vaporization plane. The DRP is when the pores filled with liquid are around the same size, and the pumping effect is very weak and the evaporation plane is receding into the model system. To accelerate the drying process, and since the CRP shows the highest drying rate compared to the DRP, it is the common aim to prolong the CRP for as long as possible. The geometries of SMS and GMS are designed in such a way with certain pore spaces to favour capillary pumping until the end of the drying phase. In this way, the liquid evaporation path follows the specific designs, and the liquid evaporation rate is increased, compared to typical porous media. The evolutions of evaporation rate in SMS and GMS are shown in §§ 5.1 and 5.2, respectively. SMS is designed with two different values, 180 and
 $80~\unicode[STIX]{x03BC}\text{m}$
, for the distance between the pillars (figure 4
a), while in GMS the pillar distance gradually decreases layer by layer (figure 4
b). Subsequently, a glass lid was bonded on top of the pillars to form the micro-pore structure, allowing visual inspection during the evaporation process. Before the experiments, the cavities were treated with oxygen plasma for 5 min at 600 W (PVA TePla GIGAbatch 310 M) in order to get a uniform contact angle on the surfaces. After this treatment, the measured contact angle varies between
 $35^{\circ }$
and
 $39^{\circ }$
. To avoid the influence of liquid remaining stuck at the edges of the plates, a fence of pillars was placed around the experimental area, referred to as ‘protection pillars’ (figure 3
b) in the following text. The distance
 $D$
(in green) is chosen as the characteristic length for liquid flow. The red dash-dot arrows indicate the expected flow direction. Length
 $L$
is the total length that a liquid meniscus travels during the evaporation process. In SMS,
 $L$
is the total length of spiral shape, while in GMS,
 $L=7L_{0}$
is the sum of the half-length of each layer. These dimensions are used to determine non-dimensional numbers as shown below.
For the experiment, the micro-pore structure was placed on a hot plate fixed at a constant temperature of
 $50\,^{\circ }\text{C}$
(figure 5
a). A solution of deionized water and fluorescein was injected in the micro-cavity and the fluorescence was excited by a lateral illumination source (
 $455<\unicode[STIX]{x1D706}<495~\text{nm}$
) and filtered by an emission filter (
 $500<\unicode[STIX]{x1D706}<550~\text{nm}$
) before being collected by a camera (ace acA2040-90, Besler). Images were recorded every 1 s during the entire evaporation of the solution (figure 5
b). After the experiment, the recorded images were processed with ImageJ (Stalder et al.
Reference Stalder, Melchior, Müller, Sage, Blu and Unser2010) to extract information for detailed analysis discussed in § 5.
Top view of the experimental area of (a) SMS and (b) GMS. The height of SMS and GMS is
 $60~\unicode[STIX]{x03BC}\text{m}$
.

Experimental set-up for liquid evaporation in micro-pore structure: (a) schematic representation; (b) photo of experimental set-up with zoom of micro-pore structure.

4 Simulation set-ups
Given the small height-to-length ratio (
 $6/500$
) of the micro-pore structure, we first simulate the evaporation process in two dimensions. A comparison with a 3D simulation is provided in § 6. In the experiment the temperature is kept constant at
 $50\,^{\circ }\text{C}$
by heating the hot plate. Since the thermal conductivity of silicon is high (
 $130~\text{W}~\text{m}^{-1}~\text{K}^{-1}$
), it is reasonable to assume that the silicon plate and pillars are at the same temperature as the aluminium plate. This assumption of equal temperature in plate and pillars is supported by measurements of the temperature difference across the cavity from the bottom of silicon to the top of the glass plate, which was found to be less than
 $1\,^{\circ }\text{C}$
. It is important to note that in two dimensions the heated silicon pillars are the only heat sources, while in three dimensions the plate is also a heat source. In LBM simulations, the spurious current around the liquid–vapour interface increases with the density ratio, which affects the accuracy of the models. By applying the EMRT-MP LBM here, the spurious current is decreased around one order of magnitude (Qin et al.
Reference Qin, Moqaddam, Kang, Derome and Carmeliet2018) compared to that in original models. However, the characteristic velocity of liquid during drying is also very small (see experiments in § 5), suggesting the density ratio not too high in simulations. Moreover, according to the mechanisms analysed in § 5, as long as the non-dimensional numbers are kept similar to those of experiments, similar drying processes are recovered by simulations. We simulated the drying process for liquid–vapour density ratios ranging from 15 to 60 and found that the results are not sensitive to these ratios. To maintain a high accuracy of the simulations while saving computational time, the density ratio of liquid to vapour is chosen to be
 $\unicode[STIX]{x1D70C}_{l}/\unicode[STIX]{x1D70C}_{v}\approx 30$
with a vapour temperature equal to the saturation temperature
 $T_{vapor}=T_{sat}=0.75T_{c}$
and a pillar temperature
 $T_{pl}=0.76T_{c}$
. The pillar temperature is set to ensure that all the mechanisms during drying are the same as in the experiments (see § 5 and appendix D). The temperature boundary conditions at the four lateral sides are assumed to be Neumann boundary conditions, with a temperature gradient equal to zero. The boundary condition for vapour flow is a zero-gradient velocity condition at the four lateral sides so that vapour can flow out freely. Heat at the boundary is thus transported out of the computational domain by vapour transport. The size of pillars is
 $7\times 7~\text{lattices}^{2}$
and the pillars are located similarly to the experiments. In our LBM simulations, the liquid–vapour interface is a smooth boundary over 4 to 5 lattices. The pillar size is sufficiently larger than the interface thickness so that interface effects can be neglected, meaning pinning of the interface will occur at the pillar edges.
In this paper, the Reynolds, capillary and Péclet numbers are used to evaluate the similarity between our simulations and experiments. For fluid flow, the Reynolds and capillary numbers are used. The Reynolds number
 $Re=\overline{u_{m}}D/v$
is defined as the ratio of inertial to viscous force, while the capillary number
 $Ca=\unicode[STIX]{x1D70C}_{l}v\overline{u_{m}}/\unicode[STIX]{x1D70E}$
is the ratio of viscous to capillary force, where
 $\unicode[STIX]{x1D70C}_{l}$
,
 $v$
and
 $\unicode[STIX]{x1D70E}$
are liquid density, kinematic viscosity and surface tension. For heat and mass transport, we also use the Péclet number
 $Pe=\overline{u_{m}}D/D_{v}$
, which is the ratio of convective and diffusive transport of heat or mass and
 $D_{v}$
represents the thermal or mass diffusivity. The fluid properties such as thermal conductivity, heat capacity and viscosity are set according to the values in the experiments. Parameter
 $D$
is a characteristic length taken as the distance between pillars in the centre of the evaporation path (see figure 4). Distance
 $D$
is equal to
 $180~\unicode[STIX]{x03BC}\text{m}$
(63 lattices) for SMS and
 $115~\unicode[STIX]{x03BC}\text{m}$
(38 lattices) for GMS. Parameter
 $\overline{u_{m}}$
is the average velocity of the main liquid meniscus. In SMS, the average velocity of the main liquid meniscus is defined as
 $\overline{u_{m}}=L/t_{tot}$
, where
 $L$
is the total distance travelled by the evaporation front (length of red line in figure 4
a) and
 $t_{tot}$
is the total evaporation time. In GMS, the evaporation front travels layer by layer from large pore rows to small ones resulting in
 $L=7L_{0}$
.
5 Two-dimensional results and discussion
5.1 Liquid evaporation in SMS
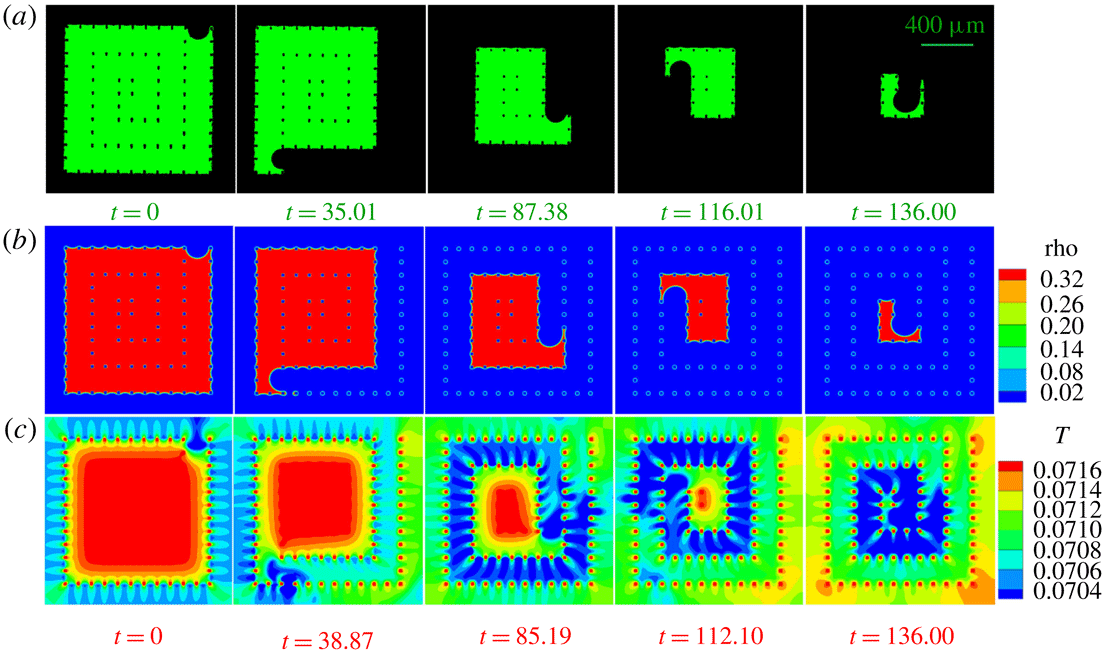
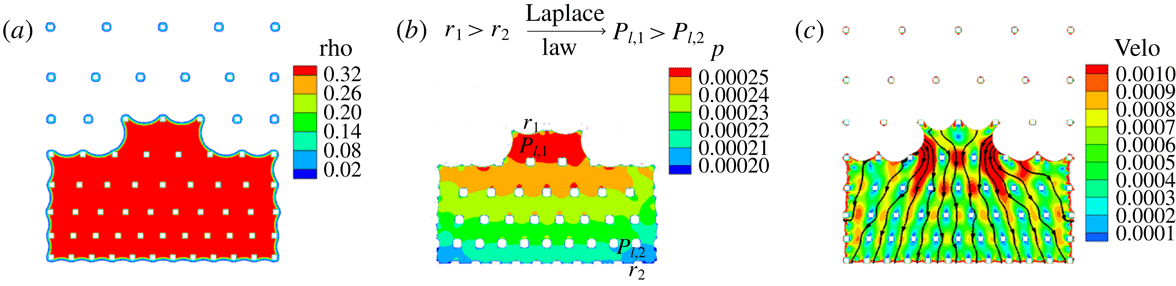
We first analyse the liquid configurations during the evaporation process in SMS. Different frames are compared in figure 6(a,b) for experiment (supplementary movie 1, available online at https://doi.org/10.1017/jfm.2019.69) and simulation (supplementary movie 2). The evaporation process follows a spiral route as we designed. A good agreement between experiment and simulation results is observed. To understand the origin of this spiral pathway, we analyse the density, liquid pressure distribution and velocity contour at time
 $t=32.87~\text{s}$
(figure 7). We observe in figure 7(b) that the liquid pressure is higher at the major meniscus showing a large radius of curvature, while the liquid pressure is lower at the minor menisci, showing smaller radii of curvature. According to the Laplace law, the capillary pressure scales with the surface tension
 $\unicode[STIX]{x1D70E}$
divided by the radius of curvature of the meniscus
 $r$
, or
 $P_{\unicode[STIX]{x1D70E}}\propto \unicode[STIX]{x1D70E}/r$
. If we neglect temperature difference at different menisci, the surface tension
 $\unicode[STIX]{x1D70E}$
can be assumed to be the same at all menisci. This means that the capillary pressure
 $P_{\unicode[STIX]{x1D70E}}$
at the major meniscus is lower than that at the minor menisci. Assuming the vapour pressure is constant in the vapour phase and in equilibrium with the liquid pressure at the menisci, the liquid pressure is then given by
 $P_{l}=P_{v}-P_{\unicode[STIX]{x1D70E}}$
. This means that the liquid pressure will be higher at the major meniscus than at the minor menisci, as is found in our simulations. This pressure difference leads to an internal liquid flow from major to minor menisci as also shown in the velocity contours in figure 7(c). This shows that evaporation mainly happens at the minor menisci, while the movement of the major meniscus results from the internal liquid flow driven by the liquid pressure difference.
Figure 6(c) shows the temperature distribution (supplementary movie 3) during the evaporation process. The temperature drops at the menisci due to evaporative cooling. The vapour phase is cooled in a zone around the evaporating menisci (zone in blue in figure 6
c). The vapour phase remains colder at the consecutive times
 $t=85.19,112.10,136.00$
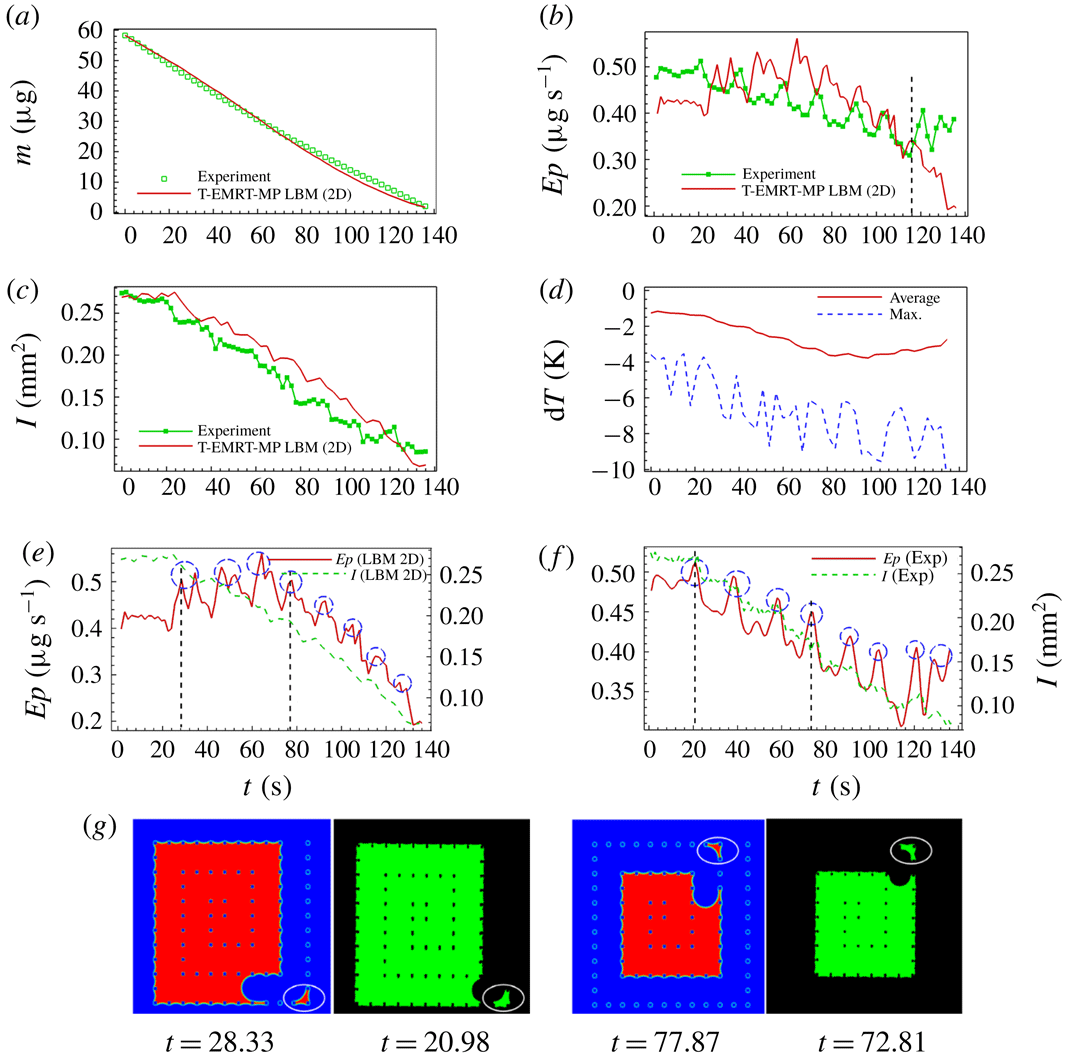
except at zones around the pillars, where the vapour is locally heated by the hot pillars. In the liquid phase, heat is transported from the heated pillars immersed in the liquid phase. A temperature gradient is observed from inside the liquid to the evaporating menisci. The average and maximum temperature variations in the 2D simulation are shown in figure 8(d). We can see that the average and maximum temperature drops are around 2.7 and 10.0 K. Next, by studying the Péclet number for heat flow in liquid and vapour phase, we analyse whether the heat transport is diffusive (conduction) or convective (by fluid flow). It is worth mentioning that the temperature difference in the 2D simulation is found to be larger than that in 3D results, which is presented below.
Different frames of liquid evaporation in SMS. (a) Liquid distribution from experiment (supplementary movie 1); (b) density (supplementary movie 2) and (c) temperature distribution (supplementary movie 3) from 2D T-EMRT-MP LBM simulation. Density (rho) and temperature (
 $T$
) are in lattice units while time (
 $t$
) is in physical units (s).

Explanation of spiral route with (a) density, (b) pressure and (c) velocity contours at physical time
 $t=32.87~\text{s}$
. Density (rho), pressure (
 $p$
) and velocity (velo) are in lattice units.

Figure 8(a) shows the evolution of liquid mass
 $m$
with time
 $t$
for experiment and simulation. A good agreement between simulation and experimental results is observed. Figure 8(b) gives the evaporation rate
 $Ep$
versus time. The evaporation rate gradually decreases with time showing some temporary peaks. Figure 8(c) gives the liquid–vapour interface
 $I$
versus time. The global decrease in evaporation rate is closely related to the decrease in interfacial area as shown in figure 8(e,f), for simulation and experiment, respectively. The local peaks correspond to temporary higher evaporation rates when the major meniscus passes a corner of the spiral path (figure 8
e,f). Liquid configurations at two selected peaks for both simulation (
 $t=28.33~\text{s}$
and
 $t=77.87~\text{s}$
) and experiment (
 $t=20.98~\text{s}$
and
 $t=72.81~\text{s}$
) are illustrated in figure 8(g). After passing the corner, the major meniscus breaks up leaving an isolated liquid island within the corner pillars. These liquid islands evaporate faster compared to bulk liquid due to their high perimeter-to-area ratio, accounting for the peaks in evaporation rate.
Analyses of liquid evaporation in SMS. (a,b) Comparison of liquid mass and evaporation rate between experiment and simulation; (c) comparison of liquid–vapour interface area between experiment and simulation; (d) average and maximum temperature variation in simulation; (e,f) comparison of evaporation rate and liquid–vapour interface in simulation and experiment; (g) comparison of liquid film between pillars after the main meniscus passes the corner between simulation (at
 $t=28.33~\text{s}$
and
 $t=77.87~\text{s}$
) and experiment (at
 $t=20.98~\text{s}$
and
 $t=72.81~\text{s}$
). All variables are in physical units.

The evaporation rates of the 2D simulation and experiment follow the same trend until about
 $t\approx 116~\text{s}$
, after which the evaporation rate remains relatively constant in the experiment, while it continuous to decrease in the simulation. This observation may be explained by the fact that, in the 2D simulation, the heat comes only from the heated pillars, while, in the experiment, both pillars and base silicon plate are heated. Therefore, the thermal energy available for evaporating the liquid is less in the 2D simulation with respect to the experiment. This lower thermal energy slows down the evaporation rate in simulation compared to experiment. Additionally, the higher evaporation rate in the experiment at the end of the evaporation process (
 $t=136.00~\text{s}$
) can be attributed to the evaporation of a film tail of liquid (figure 6
a), which does not appear much in the simulation (figure 6
b). In § 6, we show that we can improve the simulation results when simulating the evaporation process in three dimensions taking into account heat also provided from the silicon plate. In the experiment of drying in SMS, the ratio of the average evaporation rate to the maximum evaporation rate is
 $Ep_{aver}/Ep_{max}=81.5\,\%$
, which means the evaporation rate is generally constant. One main reason is the contribution of capillary pumping as explained in § 3, and the other one is the high heat supply with a substrate temperature of
 $T_{pl}=50\,^{\circ }\text{C}$
. The high temperature difference between the micro-pillar structure and the environment (
 $T_{air}=22\,^{\circ }\text{C}$
) speeds up the vapour diffusion process, which greatly increases the evaporation rate. Thus, the SMS geometry as well as the heating source helps to maintain a high evaporation rate during the entire drying process.
Now we evaluate the non-dimensional numbers as described in § 4. In the experiment, the temperature of the hot plate is at
 $50\,^{\circ }\text{C}$
, at which the properties of water are
 $\unicode[STIX]{x1D70C}_{l}=988~\text{kg}~\text{m}^{-3},v_{L}=5.53\times 10^{-7}~\text{m}^{2}~\text{s}^{-1}$
and
 $\unicode[STIX]{x1D70E}=6.79\times 10^{-2}~\text{N}~\text{m}^{-1}$
. The average velocity of the main evaporation meniscus is
 $\overline{u_{m}}=L/t_{tot}=5.93\times 10^{-3}/136=4.36\times 10^{-5}~\text{m}~\text{s}^{-1}$
. The dimensionless numbers for liquid phase then are a Reynolds number of
 $Re_{L}=0.014$
and a capillary number of
 $Ca=3.51\times 10^{-7}$
. As the Reynolds number is small, the liquid internal flow is in the laminar regime. The capillary number is very small, which means the capillary forces are much more dominant than the viscous forces. For our 2D simulation in SMS, the iteration steps are 364 000 with 7.0 CPU h of 64 processors, leading to the average velocity of main meniscus of
 $4.61\times 10^{-3}$
lattice units. We calculated the corresponding non-dimensional numbers as
 $Re_{L}=1.74$
and
 $Ca=2.33\times 10^{-2}$
. The Reynolds and capillary numbers in simulations are not as low as in experiments, due to the limitation of the LB models, i.e. the velocity cannot be very low and surface tension cannot be very high (Yuan & Schaefer Reference Yuan and Schaefer2006; Qin et al.
Reference Qin, Moqaddam, Kang, Derome and Carmeliet2018). However, both numbers indicate that the simulated flow characteristics are in a similar regime as in the experiment, i.e. laminar flow and capillary forces dominating viscous forces, which accounts for the good agreement between experiments and simulations.
The Reynolds numbers for vapour flow in experiment and simulation are
 $Re_{V}=5.57\times 10^{-3}$
and
 $Re_{V}=0.42$
, respectively. Therefore, the vapour flow is also in the laminar regime. Heat transport from the pillars to the liquid phase is found to be important since it mainly affects the energy supply controlling the evaporation. Therefore, we compare the Péclet number of heat transport in the liquid phase
 $Pe_{L,T}$
for simulation and experiment. We obtain
 $Pe_{L,T}=0.05<1$
in the experiment and
 $Pe_{L,T}=0.71<1$
in the simulation, which indicates that the heat transport in the liquid phase is dominated by diffusion rather than convection. For example, at
 $t_{N}=20.71$
in figure 6(c), the liquid temperature distribution does not follow the internal liquid flow, indicating that the convective heat flow is rather negligible compared to heat diffusion. We further study the type of vapour transport in simulation and experiment. In experiment, the Péclet number of vapour mass transport is
 $Pe_{V,m}=Re_{V}\ast Sc_{V}=3.86\times 10^{-3}$
, with
 $Sc_{V}=v_{V}/D_{V}$
the Schmidt number, where
 $v_{V}=2.08\times 10^{-5}~\text{m}^{2}~\text{s}^{-1}$
and
 $D_{V}=3.0\times 10^{-5}~\text{m}^{2}~\text{s}^{-1}$
are the vapour kinematic viscosity and mass diffusivity at
 $50\,^{\circ }\text{C}$
. In the simulation, the mass diffusivity is more difficult to determine. We first estimate the average density gradient
 $\unicode[STIX]{x0394}\unicode[STIX]{x1D70C}_{V}/\unicode[STIX]{x0394}L_{V}=(\unicode[STIX]{x1D70C}_{V_{2}}-\unicode[STIX]{x1D70C}_{V_{1}})/\unicode[STIX]{x0394}L_{V}$
from liquid–vapour interface to outlet, with
 $\unicode[STIX]{x1D70C}_{V_{2}}$
the vapour density at the interface and
 $\unicode[STIX]{x1D70C}_{V_{1}}$
the vapour density at the outlet boundary, and
 $\unicode[STIX]{x0394}L_{V}$
the average distance from interface to outlet. We also calculate the mass flux
 $q=\unicode[STIX]{x0394}m_{L}/(A_{V}\ast t)$
through evaporation, and finally obtain the vapour diffusivity as
 $D_{V}=q/(\text{d}\unicode[STIX]{x1D70C}_{V}/\text{d}L_{V})$
. In our simulation, the kinematic viscosity of vapour is
 $v_{V}=0.167$
. Then we calculate the Péclet number as
 $Pe_{V,m}=Re_{V}\ast Sc_{V}=1.30\times 10^{-3}$
, which is in a range similar to that of experiments. This means that the vapour transport is diffusive. All the non-dimensional numbers discussed above are summarized in table 1.
Comparison of liquid evaporation process in SMS (2D) at different heating temperatures: (a)
 $T_{pl}=0.76T_{c}$
; (b)
 $T_{pl}=0.80T_{c}$
. Time is in physical units (s).

Non-dimensional numbers for experiment and 2D LBM simulation in SMS.

The capillary number
 $Ca$
affects the capillary pumping effect, and the smaller the capillary number, the stronger the pumping. The evaporation pattern is determined by the competition between pumping effect and local evaporation rate (controlled by temperature gradient by liquid and environment). If the pumping effect is stronger than the local evaporation, the liquid remains pinned to the pillars, which is the case in our experiment. Since the heating temperature affects the liquid properties like surface tension as well as the drying rate, changing temperature results in different evaporation patterns. For example, when we raise the heating temperature of pillars from
 $T_{pl}=0.76T_{c}$
to
 $T_{pl}=0.80T_{c}$
, the capillary number
 $Ca$
increases from
 $2.33\times 10^{-2}$
to
 $1.40\times 10^{-1}$
, and the evaporation pattern changes from ‘spiral’ to ‘continuous’ as shown in figure 9. We found that for a capillary number lower than
 $2.33\times 10^{-2}$
, the capillary pumping effect is sufficient to guarantee a spiral evaporation pattern.
5.2 Liquid evaporation in GMS
Frames of liquid evaporation in GMS. (a) Liquid distribution from experiment (supplementary movie 4); (b) density (supplementary movie 5) and (c) temperature contour (supplementary movie 6) from T-EMRT-MP LBM simulation. Density (rho) and temperature (
 $T$
) are in lattice units while time (
 $t$
) is in physical units (s).

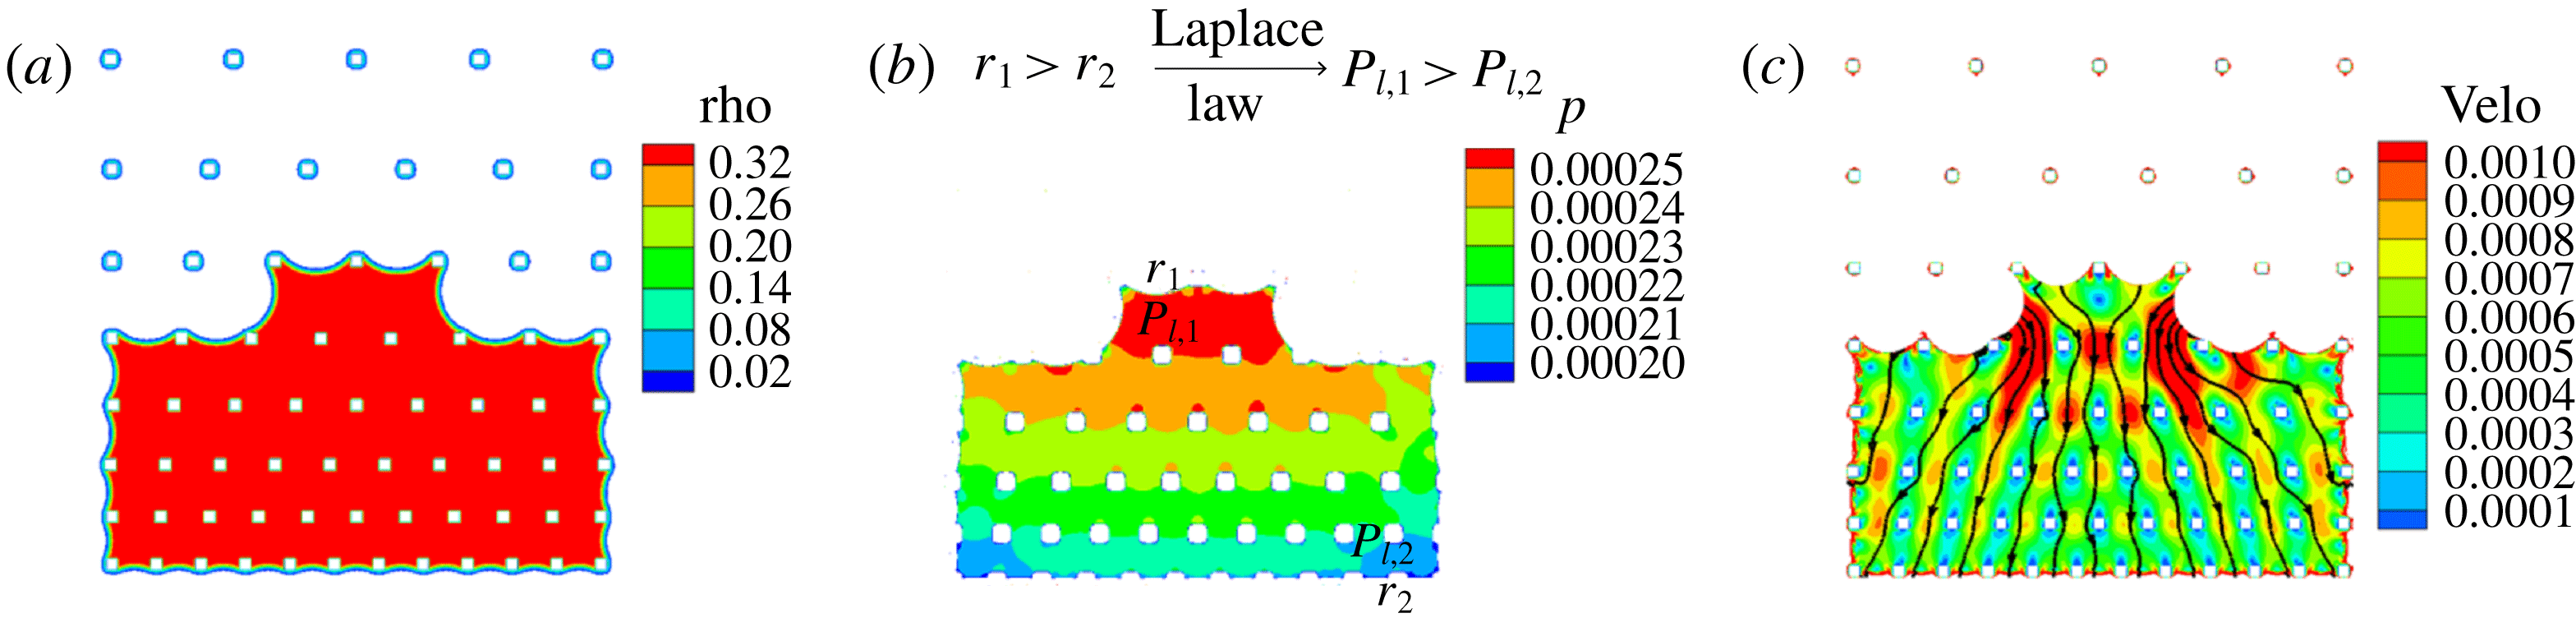
Explanation of layer-by-layer evaporation route with (a) density, (b) pressure and (c) velocity contour at physical time
 $t=51.36~\text{s}$
. Density (rho), pressure (
 $p$
) and velocity (velo) are in lattice units.
Analyses of liquid evaporation in GMS. Comparison of (a) liquid mass, (b) evaporation rate and (c) liquid–vapour interface area between experiment and simulation; (d) average and maximum temperature variation during drying; comparison of (e) evaporation rate and (f) liquid–vapour interface in simulation and experiment. All variables are in physical units.

Figures 10(a) and 10(b) show frames of different liquid configurations for the GMS case, for experiment (supplementary movie 4) and simulation (supplementary movie 5), respectively. Again a good agreement can be observed. The frames show that the liquid evaporation front moves mainly layer by layer from the top row with larger pillar distance to the lower rows with decreasing pillar distance. The larger distance between the pillars in the higher rows leads to menisci with larger radius of curvature, which according to the Laplace law leads to lower capillary pressure or higher liquid pressure. The lower rows with smaller distance between the pillars result in lower liquid pressures. The pressure difference from large to small pore rows, as seen in figure 11(b) at
 $t=51.36~\text{s}$
, leads to an internal liquid flow from large menisci to small ones (figure 11
c). The liquid front thus moves downwards row by row until all liquid is evaporated from the smallest pore row. The temperature field (figure 10
c, supplementary movie 6) shows evaporative cooling at the evaporating menisci: a cooled vapour zone next to these menisci with locally heated zones due to the presence of hot pillars, and a hotter liquid zone heated by the pillars immersed in the liquid phase. The average and maximum temperature variations in the 2D simulation are shown in figure 12(d). We can see that the average and maximum temperature drops are around 1.6 and 4.6 K.
Figure 12(a) shows that the changes of liquid mass with time in the experiment and simulation are in good agreement. The evaporation rate (figure 12
b) in both experiment and simulation fluctuates while decreasing with time. Figure 12(c) gives the liquid–vapour interface
 $I_{N}$
versus time. Figure 12(e,f) shows the relations between evaporation rate and liquid–vapour interfacial area for simulation and experiment, respectively. We observe a close relation between the evaporation rate and interfacial area. The fluctuation behaviour can be explained by the consecutive de-pinning of menisci in a row resulting in a local increase of the evaporation rate. At the end of the evaporation process after
 $t\approx 95~\text{s}$
, the evaporation rate continuously decreases in the simulation while it increases again in the experiment. The reason is also attributed to the fact that less thermal energy available for evaporation in the simulation compared to the experiment as explained in § 5.1. In the experiment of drying in GMS, the ratio of the average evaporation rate to the maximum evaporation rate is
 $Ep_{aver}/Ep_{max}=79.0\,\%$
, indicating that the evaporation rate is almost constant. Similar to SMS, the GMS geometry also helps to maintain high evaporation rate during the entire drying process with heat source.
Non-dimensional numbers for experiment and 2D LBM simulation in GMS.

In GMS, the evaporation time in experiment is 107 s, while the iteration steps in simulation are 300 000 (6.6 CPU h with 64 processors). Similar to the SMS case, we have determined the non-dimensional numbers for both experiments and simulations in GMS, as shown in table 2. The range of non-dimensional numbers shows that the flow, heat and mass transport mechanisms are laminar, capillary-driven and diffusion-dominated.
6 Three-dimensional results
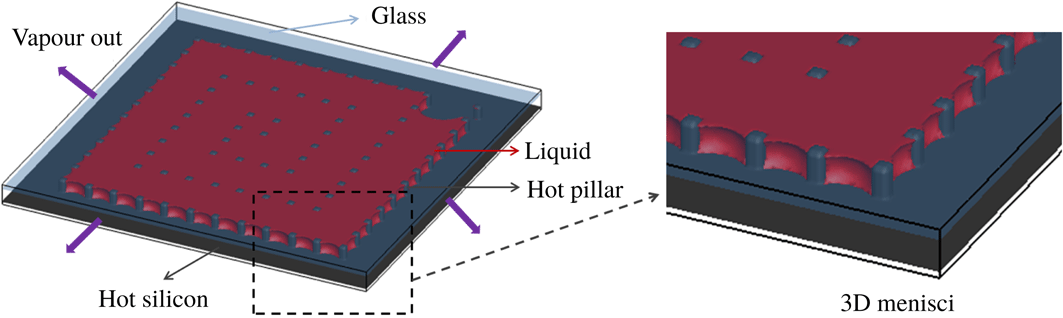
In the 2D simulations presented above, heat is provided only by the pillars, while in the experiments, both the silicon plate and pillars serve as heat sources. Moreover, the menisci in the experiments have a more complex 3D shape, which cannot be captured in a 2D simulation. To verify the accuracy of a 2D simulation, we carried out a 3D simulation for SMS. The ratio of height to length/width is set identical to the one in experiments, and other dimensions remain the same as in the 2D simulation. The 3D simulation set-up is shown in figure 13. The silicon plate and pillars are set to a temperature of
 $T_{h}=0.751T_{c}$
, which is slightly greater than the saturation temperature
 $T_{s}=0.75T_{c}$
. We used a lower surface temperature of the heat source in order to render comparable the non-dimensional numbers in experiment and simulation. The lower surface temperature in three compared to two dimensions can be explained by the fact that heat is more efficiently transported to the liquid in the 3D case with both the bottom silicon plate and pillars as heat sources. The top glass is set adiabatic, since the measured glass temperature was close enough to the surface temperature of the silicon plate. We impose zero velocity gradient (allowing free vapour outflow) at the four boundary sides, similar to the 2D case. For the temperature at the four lateral sides
 $T_{l}$
, we assume that
 $T_{l}$
increases linearly with time until the drying completes when
 $T_{l}$
becomes identical to
 $T_{h}$
, in order to consider the heating effect of the bottom hot plate
 $T_{h}$
during drying.
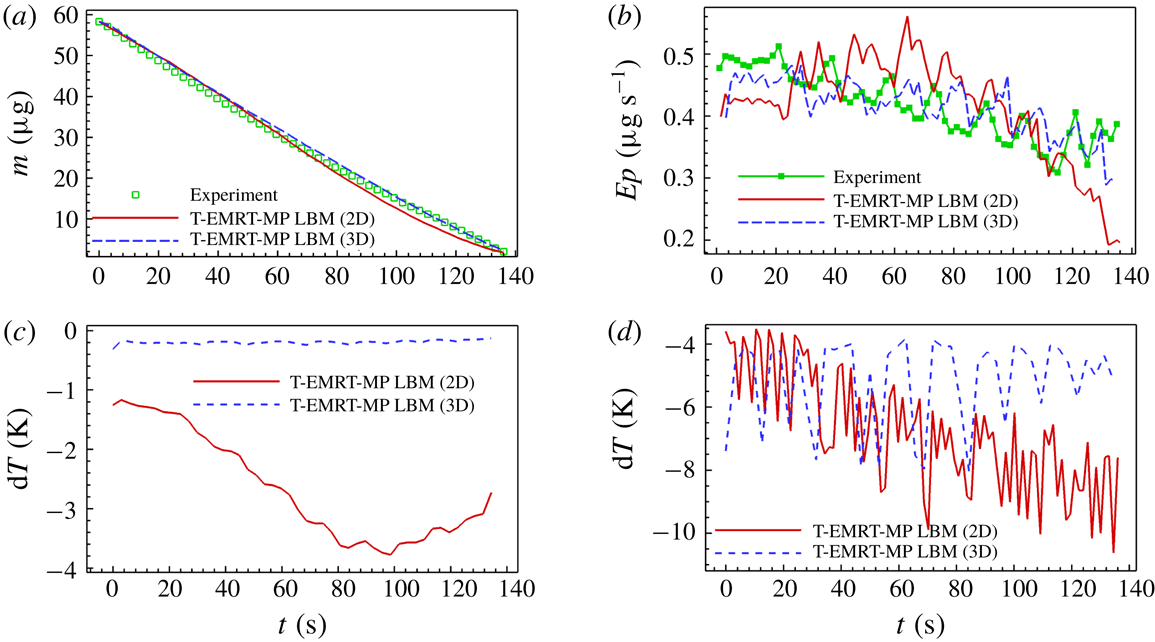
Different frames for the 3D simulation are shown in figure 14. The spiral evaporation route (supplementary movie 7) is the same as in the 2D simulation and experiment. The menisci have now a 3D shape as shown in figure 13. A more striking difference from the 2D simulation is much smaller zones cooled by evaporation in the temperature field (supplementary movie 8), and smaller temperature differences between vapour and liquid phase as shown in figure 14(b). These are caused by the strong heating effect of the bottom silicon plate. The temperature drop in our 3D simulation of drying in SMS is shown in figure 15(c,d). We can see the average and maximum temperature drops are 0.2 and 8.0 K, which are smaller than those in the 2D simulation showing values of 2.6 and 10.0 K. In the work of Städler & Carro (Reference Städler and Carro2016), they find that the temperature at the meniscus first increases by around 1.0 K and then drops by up to 5.0 K in the water drying experiment in a two-layer structure (
 $60~\unicode[STIX]{x03BC}\text{m}$
high) under a heating temperature of
 $76\,^{\circ }\text{C}$
. The temperature variation is very similar to the average maximum drop (5.5 K) in our 3D simulation. For the average temperature drop, they find that it is less than 1.0 K, which is also comparable with our 3D simulation.
Illustration of 3D T-EMRT-LBM simulation set-up of SMS with zoom of 3D menisci.

Frames of liquid evaporation in SMS from 3D T-EMRT-MP LBM simulation. (a) Liquid configuration (supplementary movie 7); (b) temperature contour (supplementary movie 8) of cross-section. Temperature (
 $T$
) is in lattice units while time (
 $t$
) is in physical units (s).

We further investigate the change of liquid mass and evaporation rate with time. As shown in figure 15(a), the evolution of liquid mass with time is quite similar in 2D and 3D simulations and experiment. In figure 15(b), we can see that the evaporation rate of our 3D simulation decreases more slowly than in the 2D simulation, and generally agrees better with the experiment. Especially after
 $t_{N}\approx 30$
, the evaporation rate only slightly decreases in the 3D simulation, but decreases much more significantly in the 2D simulation. The reason is, as explained in § 5.1, that more thermal energy is available in the 3D case for evaporation. For a more detailed comparison, we evaluate the relative errors of the liquid mass (
 $Err_{m}=(m(\text{LBM})-m(\exp ))/m(\exp )$
) and evaporation rate (
 $Err_{Ep}=(Ep(\text{LBM})-Ep(\exp ))/Ep(\exp )$
) for 2D and 3D simulations results, compared to experiment. The average relative error of liquid mass (evaporation rate) is 3.3 % (7.9 %) in the 3D simulation, which is smaller than the 7.2 % (11.7 %) in the 2D simulation. It is clear that the 3D simulation is generally more accurate quantitatively than the 2D one. However, the computational cost in the 3D simulation is 8.0 CPU h with 8800 processors, which is much higher than that in the 2D simulation. Finally, the non-dimensional numbers for the 3D simulations are found to be in a similar regime to those of the experiments (table 3).
Comparison of (a) liquid mass and (b) evaporation rate between experiment and 2D and 3D T-EMRT-MP LBM simulation results in SMS. (c) Average temperature variation and (d) maximum temperature variation between 2D and 3D T-EMRT-MP LBM simulation results in SMS. All variables are in physical units.

Non-dimensional numbers for experiment and 3D LBM simulation in SMS.

In our 3D simulation with contact angle
 $\unicode[STIX]{x1D703}=30^{\circ }$
, no liquid films adjacent to the plates are observed. When we use a contact angle of
 $\unicode[STIX]{x1D703}=0^{\circ }$
, liquid films adjacent to the plates and the corners between the plates and pillars are seen at some time frames as shown in figure 16. However, the films only stay for a short time due to the strong evaporation caused by the high heating temperature of
 $50\,^{\circ }\text{C}$
. The high temperature makes the evaporation much faster than in the case of isothermal evaporation under ambient temperature, quickly depleting the liquid films. Apart from this, the pumping effect also becomes strong due to the decrease of contact angle. The pumping effect is due to capillary pressure difference, i.e.
 $\unicode[STIX]{x1D70E}\cos \unicode[STIX]{x1D703}(1/r_{2}-1/r_{1})$
, where
 $r_{2}$
and
 $r_{1}$
are small and large pore spaces as shown in figures 7 and 11, respectively. With
 $\unicode[STIX]{x1D703}$
decreasing from
 $30^{\circ }$
to
 $0^{\circ }$
, the pumping effect increases, leading to the overall increase of evaporation rate. As a result, the total evaporation time with
 $\unicode[STIX]{x1D703}=0^{\circ }$
is reduced to around 93.5 % of that with
 $\unicode[STIX]{x1D703}=30^{\circ }$
in our 3D simulations.
Liquid configuration at two different time frames (
 $t=48.30~\text{s}$
and
 $t=128.84~\text{s}$
) with the zoom of films adjacent to plates and pillar corners. The contact angle is
 $\unicode[STIX]{x1D703}=0^{\circ }$
.

Overall, both 2D and 3D simulations capture the spiral evaporation route observed in the experiment. For quantitative results such as liquid mass and evaporation rate, the 3D simulation results are slightly better than the 2D results. In conclusion, 2D simulations are suitable for studying the evaporation pattern and rate in these quasi-2D micro-pillar cavities, while 3D simulations are more accurate in terms of quantitative analysis and simulated temperature field. The drawback of 3D simulation is that the computational cost is much higher compared to 2D. This means that 2D simulations can be used for a quicker exploration of different micro-pillar configurations, while 3D simulations can be used for a better prediction of the temperature field.
7 Conclusion
In this paper, non-isothermal liquid evaporation in specifically designed micro-pore structures is studied both experimentally and numerically. A hybrid T-EMRT-MP LBM is implemented and validated with droplet evaporation experiments to demonstrate the capability of simulating non-isothermal liquid evaporation. Then liquid evaporation in two micro-pore structures, i.e. SMS and GMS, is simulated. In SMS, the main evaporation front follows a spiral route, while in GMS it moves layer by layer from large pillar distances to smaller ones, and both of them agree well with experiments. From the temperature field obtained from our T-EMRT-MP LBM simulation, we observed and explained latent heat effects at the liquid–vapour interface (evaporative cooling) as well as heat conduction in liquid and vapour. Quantitatively, in both SMS and GMS the change of liquid mass with time coincides with experimental measurements. The evaporation rate is found to decrease with time mainly because of the reduction in liquid–vapour interface. In SMS, small peaks are observed in evaporation rate in both simulation and experiment, which are caused by evaporation of liquid film formed among pillars when the main evaporation front passes the corner of the cavity. In GMS, the evaporation fluctuates reflecting the consecutive de-pinning of menisci at the evaporation front. The analysis of non-dimensional numbers such as Reynolds, capillary and Péclet numbers shows that the internal liquid flow is in the laminar flow regime and capillary forces are dominant over viscous forces leading to pinning of the menisci to the pillars. The simulation results demonstrate that our T-EMRT-MP LBM is able to capture the non-isothermal evaporation phenomena observed in the experiments. Based on our numerical and experimental study, we find it is possible to control the evaporation route in pore structures at relatively high evaporation rate.
Acknowledgements
The Swiss National Science Foundation (SNF, project no. 160189) is acknowledged for financial support. Q.K. acknowledges the support from LANL’s LDRD Program and Institutional Computing Program. A.M.M. acknowledges the support from the computational resources at the Swiss National Super Computing Center CSCS (project no. s823).
Supplementary movies
Supplementary movies are available at https://doi.org/10.1017/jfm.2019.69.
Appendix A. How diffusive evaporation is considered in our model
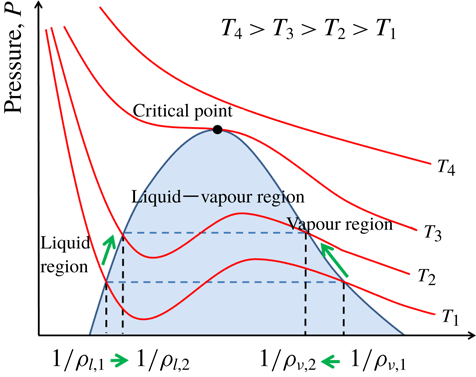
We use a single-component (specie) two-phase model (liquid and vapour) to model the evaporation process. In our coupling model, we do not have an explicit equation for vapour diffusion (evaporation). The evaporation (mass transport) is induced by vapour pressure difference, which is controlled by temperature difference through equation of state. Under equilibrium state with saturation temperature
 $T_{sat}$
and saturation pressure
 $P_{sat}$
, there is no phase change between liquid and vapour. Once there is a temperature variation, the liquid and vapour tend to reach a new equilibrium state with different densities under new temperature. For example, if we heat the liquid from
 $T_{1}$
to
 $T_{2}$
shown in figure 17, liquid density decreases from
 $\unicode[STIX]{x1D70C}_{l,1}$
to
 $\unicode[STIX]{x1D70C}_{l,2}$
while vapour density increases from
 $\unicode[STIX]{x1D70C}_{v,1}$
to
 $\unicode[STIX]{x1D70C}_{v,2}$
at the interface. The fluid pressure at
 $T_{2}$
is higher than that at
 $T_{1}$
, i.e.
 $P(T_{2})>P(T_{1})$
. In this way, the vapour at the interface has a higher pressure (density) than that at the boundary. The pressure (density) difference drives the motion of vapour molecules. This process can be analogized to diffusion driven by concentration gradient, where pressure can be analogized to vapour partial pressure, while the vapour density can be analogized to vapour concentration. According to Fick’s law
 $J=D_{v}(\text{d}\unicode[STIX]{x1D711}_{v}/\text{d}L_{v})$
, where
 $J$
is the diffusion flux with units of
 $\text{mol}~\text{m}^{-2}~\text{s}^{-1}$
while
 $\unicode[STIX]{x1D711}_{v}$
is the vapour concentration with units of
 $\text{mol}~\text{m}^{-3}$
. Since we are concerned about the mass flux
 $q$
with units of
 $\text{kg}~\text{m}^{-2}~\text{s}^{-1}$
, Fick’s law is modified to be
 $q=D_{v}(\text{d}\unicode[STIX]{x1D70C}_{v}/\text{d}L_{v})$
with
 $\unicode[STIX]{x1D70C}_{v}$
representing the vapour density with units of
 $\text{kg}~\text{m}^{-3}$
. The modified Fick’s law is used to calculate the vapour mass diffusion coefficient in our simulations shown in §§ 5 and 6. We also mention that Cueto-felgueroso, Fu & Juanes (Reference Cueto-felgueroso, Fu and Juanes2018) applied the same equation (
 $q=D_{v}(\text{d}\unicode[STIX]{x1D70C}_{v}/\text{d}L_{v})$
) in their isothermal phase change model. In the future, we will improve our model to a two-component, two-phase model allowing also the incorporation of air (modelling partial pressure, convection).
The relation between pressure and volume of two-phase flow under different temperatures.

Appendix B. Single-droplet evaporation in a closed cavity
Snapshots of a droplet evaporating in a closed cavity at different normalized times
 $t^{\ast }$
.

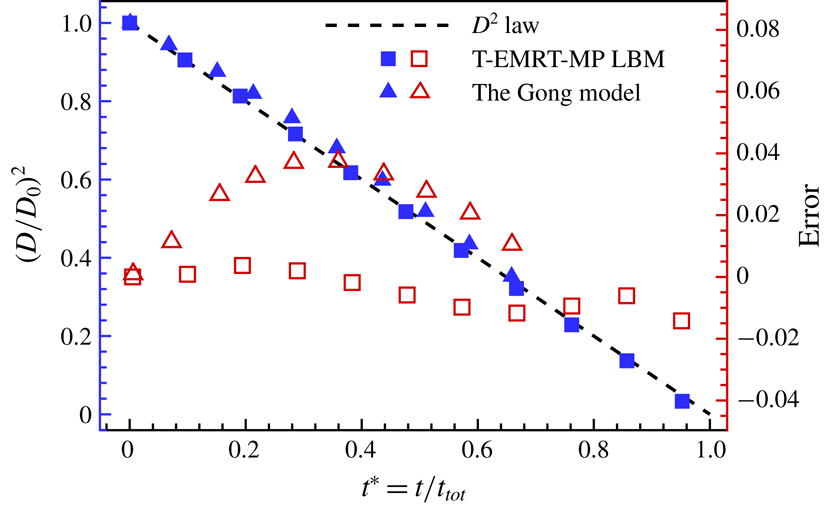
Comparison of normalized diameter squared and error versus normalized time for T-EMRT-MP LBM results, LBM (Gong et al. Reference Gong, Yan, Chen and Wright2018) results and the diameter square law.

A single droplet evaporating in a closed cavity is simulated and the results are compared with the diameter square law, as well as the results from Gong et al. (Reference Gong, Yan, Chen and Wright2018). As in Gong et al. (Reference Gong, Yan, Chen and Wright2018), the droplet size is 65 lattices and located in the middle of a 2D square domain with
 $N_{x}\times N_{y}=245\times 245$
. In our simulation, the density ratio of liquid and vapour is
 $\unicode[STIX]{x1D70C}_{l}/\unicode[STIX]{x1D70C}_{v}\approx 30$
with temperature ratio of
 $T/T_{c}=0.75$
, where
 $T_{c}$
is the critical temperature. The droplet temperature is initially set as
 $T_{d}/T_{c}=0.75$
and the surrounding vapour is
 $T_{v}/T_{c}=0.86$
. All the surfaces of the domain are non-slip walls, and the wall temperature is set as
 $T_{w}/T_{c}=0.86$
during the entire process. In this simulation, the thermal conductivity and heat capacity of liquid and vapour are both set as
 $\unicode[STIX]{x1D706}=0.4$
and
 $C_{V}=120$
. To compare our results with those of the Gong model (Gong et al.
Reference Gong, Yan, Chen and Wright2018), we use normalized time
 $t^{\ast }=t/t_{tot}$
and diameter square
 $D^{2}(t)/D_{0}^{2}$
. The drying process in our simulation at different times is shown in figure 18, while the comparison is shown in figure 19. The error is calculated by simulated value minus analytical value of normalized diameter square, i.e.
 $\text{error}=(D/D_{0})^{2}(\text{Sim.})-(D/D_{0})^{2}(\text{Ana.})$
. From figure 19 we can see that the error of our T-EMRT-MP LBM is always smaller than 0.014, while it can reach 0.040 for the Gong model. It is obvious that the agreement between our T-EMRT-MP LBM simulation and diameter square law is better than the Gong model.
Appendix C. Liquid evaporation in a capillary tube
Schematic illustration of liquid drying in a capillary tube.

Comparison of meniscus position of liquid drying in a capillary tube between analytical solution and T-EMRT-MP LBM simulation.

To check the accuracy of our model for quasi-isothermal evaporation, we simulate the evaporation in a capillary tube and compare the result with the analytical solution. We assume a capillary tube with a length of 3.2 mm and a width of 0.32 mm, and the left side is open for evaporation as shown in figure 20. According to Cueto-felgueroso et al. (Reference Cueto-felgueroso, Fu and Juanes2018), the analytical solution of the meniscus distance from outlet boundary with time is written as
 $x_{m}(t)=(2D_{v}(\unicode[STIX]{x1D70C}_{v}^{\ast }-\unicode[STIX]{x1D70C}_{v}^{out})/(\unicode[STIX]{x1D70C}_{l}^{\ast }-\unicode[STIX]{x1D70C}_{v}^{\ast }))^{1/2}t^{1/2}$
, where
 $\unicode[STIX]{x1D70C}_{l}^{\ast },\unicode[STIX]{x1D70C}_{v}^{\ast }$
and
 $\unicode[STIX]{x1D70C}_{v}^{out}$
represent the liquid density and vapour density at meniscus and outlet boundary. The evaporation is under a temperature of
 $55\,^{\circ }\text{C}$
, with a contact angle of
 $\unicode[STIX]{x1D703}=90^{\circ }$
, and the environment temperature is
 $22\,^{\circ }\text{C}$
with relative humidity of 36 %. Then we obtain:
 $D_{v}=3.05\times 10^{-5}~\text{m}^{2}~\text{s}^{-1}$
,
 $\unicode[STIX]{x1D70C}_{l}^{\ast }=985.7~\text{kg}~\text{m}^{-3}$
,
 $\unicode[STIX]{x1D70C}_{v}^{\ast }=0.126~\text{kg}~\text{m}^{-3}$
and
 $\unicode[STIX]{x1D70C}_{v}^{out}=0.0454~\text{kg}~\text{m}^{-3}$
, or
 $x_{m}(t)=6.63\times 10^{-5}\times t^{1/2}~\text{m}$
with a total evaporation time and average velocity of meniscus
 $t_{tot}=2328.9~\text{s}$
and
 $\overline{u}_{m}=1.37\times 10^{-6}~\text{m}~\text{s}^{-1}$
.
In our simulation, we set liquid and vapour outlet temperatures as
 $T_{l}=0.80T_{c}$
and
 $T_{v}^{out}=0.75T_{c}$
in order to keep the same temperature difference as in the above case, i.e.
 $(T_{l}-T_{v}^{out})/T_{c}=0.80-0.75=(55-22)/647=0.05$
. We simulate the evaporation with a contact angle of
 $\unicode[STIX]{x1D703}=90^{\circ }$
, the same as in the analytical solution. Our simulations are done with hybrid LBM, which is a mesoscopic numerical model with the units being lattice units instead of physical units. To compare the numerical modelling with experiments, we convert the lattice units (length and time) to physical ones. For the time unit conversion, we use non-dimensional time
 $t^{\ast }=(u_{0}\times t)/L_{tube}$
, where
 $u_{0}$
is the characteristic velocity of the meniscus and
 $L_{tube}$
is the length of the tube. The non-dimensional times for physical and lattice units are
 $t_{p}^{\ast }=(u_{0,p}\times t_{p})/L_{tube,p}$
and
 $t_{l}^{\ast }=(u_{0,l}\times t_{l})/L_{tube,l}$
, respectively. In physical units, the characteristic velocity is derived as
 $u_{0,p}=D_{v}(\unicode[STIX]{x1D70C}_{v}^{\ast }-\unicode[STIX]{x1D70C}_{v}^{out})/(\unicode[STIX]{x1D70C}_{l}^{\ast }-\unicode[STIX]{x1D70C}_{v}^{\ast })(1/\unicode[STIX]{x0394}x)$
. If we consider the average velocity as the characteristic velocity, then
 $\unicode[STIX]{x0394}x=L_{tube,p}/2$
. Thus the characteristic velocity is
 $u_{0,p}=D_{v}(\unicode[STIX]{x1D70C}_{v}^{\ast }-\unicode[STIX]{x1D70C}_{v}^{out})/(\unicode[STIX]{x1D70C}_{l}^{\ast }-\unicode[STIX]{x1D70C}_{v}^{\ast })2/L_{tube,p}$
. In lattice units, the characteristic velocity derived from fluid flow is
 $u_{0,l}=\sqrt{(2(p_{v}^{\ast }-p_{v}^{out}))/\unicode[STIX]{x1D70C}_{v}^{\ast }}(\unicode[STIX]{x1D70C}_{v}^{out}/\unicode[STIX]{x1D70C}_{l}^{\ast })$
. In simulations and experiments, the non-dimensional time for each should be identical, i.e.
 $t_{l}^{\ast }=t_{p}^{\ast }$
. Then the dimensional time in physical units becomes
 $t_{p}=(u_{0,l}L_{tube,p})/(u_{0,p}L_{tube,l})t_{l}$
. For the non-dimensional length, we use length of tube
 $x^{\ast }=x/L_{tube}$
. Then the non-dimensional lengths in lattice and physical units are
 $x_{l}^{\ast }=x_{l}/L_{tube,l}$
and
 $x_{p}^{\ast }=x_{p}/L_{tube,p}$
. Similarly, with the equality of the non-dimensional lengths
 $x_{l}^{\ast }=x_{p}^{\ast }$
, we get
 $x_{p}=(L_{tube,p}/L_{tube,l})x_{l}$
.
Then we can plot the relation between
 $x_{p}$
and
 $t_{p}$
to compare with the analytical solution
 $x_{m}(t)=(2D_{v}(\unicode[STIX]{x1D70C}_{v}^{\ast }-\unicode[STIX]{x1D70C}_{v}^{out})/(\unicode[STIX]{x1D70C}_{l}^{\ast }-\unicode[STIX]{x1D70C}_{v}^{\ast }))^{1/2}t^{1/2}$
mentioned above. From figure 21 we can see that our simulation result agrees reasonably well with the analytical solution. The drying time with a contact angle of
 $\unicode[STIX]{x1D703}=90^{\circ }$
is 2340 s, with a small relative error of only 0.52 %.
Appendix D. Conversion from lattice to physical units
To better compare our simulation results with experimental ones, we convert from lattice units to physical ones similar to that in appendix C. We compare the liquid mass, evaporation rate and interface area with time. Then the dimensional time in physical units is calculated as
 $t_{p}=(\overline{u_{m,l}}L_{p}/\overline{u_{m,p}}L_{l})t_{l}$
, where
 $\overline{u_{m,l}}$
and
 $\overline{u_{m,p}}$
are the average velocities of the main liquid–vapour meniscus, and
 $L_{l}$
and
 $L_{p}$
(figure 4) are the characteristic moving distances of the main liquid–vapour meniscus in simulation and experiment. For the liquid mass left in the micro-pore structures, the corresponding conversion is
 $m_{p}=(m_{0,p}/m_{0,l})m_{l}$
with
 $m_{l}=\unicode[STIX]{x1D70C}_{l,l}A_{l,l}H_{l}$
,
 $m_{0,l}=\unicode[STIX]{x1D70C}_{l,l}A_{0,l}H_{l}$
and
 $m_{0,p}=\unicode[STIX]{x1D70C}_{l,p}A_{0,p}H_{p}$
, where
 $m_{p},m_{0,p},\unicode[STIX]{x1D70C}_{l,p},A_{0,p}$
and
 $m_{l},m_{0,l},\unicode[STIX]{x1D70C}_{l,l},A_{0,l}$
are liquid mass during drying, initial liquid mass, liquid density, initial liquid area in physical and lattice units. Here
 $A_{l,l}$
is liquid area in lattice units during drying. Parameters
 $H_{p}$
and
 $H_{l}$
are the heights of liquid in the micro-pore structure in physical and lattice units, and we assume
 $H_{l}=(L_{l}/L_{p})H_{p}$
. With the converted liquid mass and time in physical units, we can calculate the evaporation rate in physical units as
 $Ep_{p}=|\unicode[STIX]{x0394}m_{p}/\unicode[STIX]{x0394}t_{p}|$
. Similarly, we can convert the interfacial area from lattice units
 $I_{l}$
to physical units
 $I_{p}$
with
 $I_{l}=(I_{0,l}/I_{0,p})I_{p}$
, where
 $I_{0,l}$
and
 $I_{0,l}$
are initial interfacial area in lattice and physical units. We also determine the conversion from lattice to physical units for the temperature. The critical temperature in simulation and experiment is
 $Tc_{l}=0.0943$
and
 $Tc_{p}=647$
K. The ratio of temperature variation to critical temperature should be the same in both physical and lattice units, namely
 $\unicode[STIX]{x0394}T_{p}/Tc_{p}=\unicode[STIX]{x0394}T_{l}/Tc_{l}$
. Thus the temperature variation in physical units can be given as
 $\unicode[STIX]{x0394}T_{p}=Tc_{p}\times \unicode[STIX]{x0394}T_{l}/Tc_{l}$
, in which
 $\unicode[STIX]{x0394}T_{l}=T_{l}-T_{l,0}$
and
 $T_{l,0}$
is the initial temperature in simulations. The liquid mass, evaporation rate, liquid–vapour interface and temperature with converted units are compared in §§ 5 and 6.