Implications
In humans and pigs, intrauterine growth restriction (IUGR) leads to higher perinatal mortality. To adapt, IUGR foetuses alter their metabolic and endocrine pathways. Ghrelin, the ‘hunger’ hormone, is mainly expressed in the gastrointestinal tract and forms a possible link between nutrition and development. This study compared the ghrelin expression in the gastrointestinal tract and blood circulation of small-for-gestational age piglets with normal littermates. Together with the results of the growth of the gastric pars fundica, these findings may improve our understanding of the impact of IUGR on endocrine appetite control and gastric development in the perinatal piglets.
Introduction
The high morbidity associated with IUGR in humans and animals can be attributed to an impaired development of various organs, such as those of the gastrointestinal system (D’Inca et al., Reference D’Inca, Kloareg, Gras-Le Guen and Le Huerou-Luron2010b). Consequently, IUGR neonates are prone to food intolerance, decreased fat absorption and digestive diseases during early postnatal life (Xu et al., Reference Xu, Mellor, Birtles, Reynolds and Simpson1994; Lee et al., Reference Lee, Conner, Charafeddine, Woods and Del Priore2001). In addition, the developmental changes caused by poor foetal growth permanently affect the physiology and metabolism of the offspring, thereby predisposing these individuals to endocrine and metabolic disorders in adult life (Hales and Barker, Reference Hales and Barker1992; Barker, Reference Barker1998).
Ghrelin, the 28 amino acid growth hormone-releasing appetite regulator, was first discovered in the rat and human stomachs (Kojima et al., Reference Kojima, Hosoda, Date, Nakazato, Matsuo and Kangawa1999). As an endocrine hormone, it is also present in the circulatory system and high ghrelin levels can also be detected in colostrum (Aydin et al., Reference Aydin, Ozkan and Kumru2006). Ghrelin immunoreactive (IR) epithelial cells have been observed from the stomach to the colon in perinatal rodents (Sakata et al., Reference Sakata, Nakamura, Yamazaki, Matsubara, Hayashi, Kangawa and Sakai2002a), humans (Rindi et al., Reference Rindi, Necchi, Savio, Torsello, Zoli, Locatelli, Raimondo, Cocchi and Solcia2002) and postnatal cattle, such as sheep, pigs and horses (Hayashida et al., Reference Hayashida, Murakami, Mogi, Nishihara, Nakazato, Mondal, Horii, Kojima, Kangawa and Murakami2001; Vitari et al., Reference Vitari, Di Giancamillo, Deponti, Carollo and Domeneghini2012). In the gastric mucosa of rodents, the ghrelin cells (GCs) get distributed from the glandular base to the glandular neck when rat pups grow older (Sakata et al., Reference Sakata, Tanaka, Matsubara, Yamazaki, Tani, Hayashi, Kangawa and Sakai2002b). Its perinatal presence and important physiological and endocrine functions indicate that ghrelin might play a role in the gastrointestinal development and possibly also in its IUGR-associated adaptations (Wang et al., Reference Wang, Huo, Shi, Xu and Hutz2005). Only a few studies describe the role of ghrelin in the development of the gastrointestinal system of newborn and suckling animals (Kotunia and Zabielski, Reference Kotunia and Zabielski2006). This absence of knowledge, together with the important role of feed intake regulating postnatal growth, contributed to the focus on the perinatal period in this study. As the gastrointestinal system develops differently in rodents and humans (Sangild, Reference Sangild2006), it is highly relevant to examine the distribution of GCs in the perinatal gastrointestinal tract of the pig as a closer-to-human model. Indeed, not only is the naturally occurring small-for-gestational age (SGA) pig thought to be a suitable model for IUGR (Cooper, Reference Cooper1975), the gut of the pig is more comparable to the human gastrointestinal tract than that of rodents with regard to development, physiology and morphology (Sangild, Reference Sangild2006). The porcine model represents most of the symptoms associated with the metabolic syndrome in adult life seen in the IUGR children, such as increased adiposity (Poore and Fowden, Reference Poore and Fowden2004) and glucose intolerance (Poore and Fowden, Reference Poore and Fowden2002). In addition, the IUGR alters gastrointestinal morphology in the postnatal piglets (Xu et al., Reference Xu, Mellor, Birtles, Reynolds and Simpson1994; Wang et al., Reference Wang, Huo, Shi, Xu and Hutz2005; D’Inca et al., Reference D’Inca, Kloareg, Gras-Le Guen and Le Huerou-Luron2010b). However, it is not known whether these alterations persist until weaning.
As the metabolic and endocrine processes are disturbed in IUGR, normal feeding behaviour is crucial for both IUGR children and SGA piglets to achieve a normal postnatal growth rate. Therefore, we first investigated whether the distribution of the orexigenic GCs is altered both qualitatively and quantitatively in the gastrointestinal system of the porcine IUGR animal model during perinatal development. Next, we determined whether the amount of the gastrointestinal GCs expressing active ghrelin was related to the serum concentration of total ghrelin. We hypothesize that the immature gastrointestinal system of the SGA piglets is reflected by an altered gastric morphology, thereby contributing to lower growth rates.
Material and methods
Animals and experimental design
Perinatal piglets with BW ranging within 0.5 standard deviation (s.d.) of the mean litter BW were considered as normal weight (NW) piglets, whereas piglets with BW lower than 1.5 s.d. of the mean litter BW were defined as SGA piglets. Foetal pigs from the third trimester of gestation were obtained from a local slaughterhouse. The age of the pig foetuses (PF) was estimated by measuring the crown-rump length (Evans and Sack, Reference Evans and Sack1973). Postnatal pigs from different days of age (0 day, 3 days, 10 days and 28 days) were collected at a commercial farm from multiparous sows (Finnish Yorkshire×Belgian Landrace) and transferred within 30 min to the laboratory of Applied Veterinary Morphology. In general, piglets on commercial Belgian farms are weaned at the age of 4 weeks. In this study, piglets were not weaned sensu stricto, but immediately removed from the sow. All piglets were euthanized by severing the common carotid arteries under deep barbiturate anaesthesia (sodium pentobarbital, 200 mg/kg, Kela Laboratoria, Hoogstraten, Belgium) immediately upon arrival. Age- and gender-matched pairs consisting of foetal and postnatal NW and SGA piglets were selected. This resulted in five pairs of piglets per age group. The sample collection was organized as such that the paired NW and SGA piglets were processed simultaneously. This study was approved by the Ethical Committee on Animal Experimentation from the University of Antwerp.
Sample collection
Blood from postnatal piglets was collected during exsanguination. Serum specimens were allowed to clot for 20 min at room temperature (RT) and were subsequently centrifuged at 4°C at 1500×g. The gastrointestinal tract was immediately removed after euthanasia and processed on ice. The empty weight of the stomach was recorded and only the pars fundica was retained for further sampling. The length of the small intestine was measured and divided into three equal-length segments corresponding with the proximal, middle and distal small intestine. The colon was divided into a proximal and distal part. After rinsing in 0.01 M phosphate-buffered saline (PBS) (pH 7.4), samples were fixated for 2 h in 4% (w/v) paraformaldehyde (PFA) in distilled water at RT. The fixative was subsequently washed out overnight with PBS. From each sample a full-thickness biopsy was taken (8 mm biopsy punch, Miltex, Plainsboro, New Jersey, USA) and processed to paraffin blocks of which 4 µm vertical sections were made. The gastric pars fundica was stereologically analysed using systematic randomly retained (i.e. every fifth section after trimming the tissue block in a random position) sections that were processed for immunohistochemical analysis.
Immunohistochemistry
After rehydration, the sections were incubated in Tris-EDTA (pH 9) (Dako, Glostrup, Denmark) and heated in a microwave oven (15 min, 90 W) to retrieve antigenicity. Sections were allowed to cool down for 15 min (RT). After rinsing three times for 5 min with 0.05 M Tris-buffered saline (TBS) (pH 7.4), endogenous peroxidase activity was depleted by incubating the sections in 3% (v/v) H2O2 in methanol (10 min; RT). Non-specific staining was blocked with normal goat serum (NGS) (1 : 5, Dako, Glostrup, Denmark), diluted in TBS enriched with 0.3% Triton X-100 (v/v) and 1% (w/v) bovine serum albumin (BSA) for 30 min at RT. Subsequently, sections were incubated for 2 h at RT with purified polyclonal rabbit IgG against a human peptide from the N-terminus of acyl ghrelin, diluted with the same buffer as NGS (1 : 300, Alpha diagnostic International, San Antonio, USA). Following three TBS wash steps for 5 min, the sections were incubated for 1 h at RT with anti-rabbit Envision® (Dako). After two wash steps for 5 min with TBS and one wash step for 5 min with distilled water, positive reactions were revealed by incubating the sections with the chromogen 3,3′-diaminobenzidine (Dako). The sections were counterstained with Carazzi’s haematoxylin (Klinipath, Olen, Belgium), dehydrated and mounted with glycerol.
Qualitative analysis
Immunostained sections from the small (proximal, middle and distal parts) and large intestines (proximal and distal parts) were qualitatively analysed and scored for the presence (+) or absence (−) of closed- and opened-type GC with an Olympus BX41 microscope (Olympus Belgium, Aartselaar, Belgium). The data are presented as percentage of positive intestinal samples.
Quantitative analysis – stereology
For the quantitative analysis, an Olympus BX50 microscope connected to a computer running the software program Cast 2 (Olympus Belgium) was used. One single investigator performed the analysis blinded to the age or BW of the pigs from which the samples were collected.
The volume densities of the tunica mucosa, tela submucosa, tunica muscularis and ghrelin IR cells were estimated by using a point grid at magnification 400×. The different volume densities (V V) were calculated using the following stereological equation:
 $$V_{V} \left( {Y,\,{\rm reference} \ {\rm volume}} \right)=[\Sigma P\left( Y \right)/\Sigma P\left( {{\rm reference} \ {\rm volume}} \right)]$$
ΣP(Y) refers to the number of points hitting the region of interest and ΣP(reference volume) refers to the number of points hitting the reference volume. The entire gastric wall was used as the reference volume of the tunica mucosa, tela submucosa and tunica muscularis. The reference volume of the ghrelin IR epithelial cells was the tunica mucosa. To determine the distribution of the ghrelin IR cells, the reference volume of the tunica mucosa associated with the fundic glands was divided into three equal parts: base, middle and neck of the glands. In addition to the volume density related to the entire tunica mucosa, the volume densities of the ghrelin IR cells were also determined in these three different parts of the fundic glands.
The optimal density of the stereological grid (number of points), the number of sections and the number of fields were estimated as described previously (Gundersen and Jensen, Reference Gundersen and Jensen1987) and resulted in analysing ~30 fields of vision in at least 15 systematic random sections of each tissue block.
The following equation was used to estimate the weight of the different fundic layers and GC:
 $$W\left( {est} \right)=V_{v} \left( Y \right){\times}W\left( {{\rm weight}\,{\rm reference}\,{\rm volume}} \right)$$
W(est) represents the estimated weight of the region of interest, V v(Y) is the volume density of the region of interest and W(weight reference volume) is the estimated weight of the reference volume. The weight of the pars fundica was used as reference weight for the fundic layers. The latter weight was determined by dividing the weight of the empty whole stomach by four (Frappier, Reference Frappier2006). Next, the weight of the GC was estimated by multiplying the weight of the pars fundica tunica mucosa by the volume density of the GC.
Serological analysis
Total serum ghrelin levels were measured with a porcine ghrelin RIA kit (Phoenix Pharmaceuticals, Belmont, California, USA). The protocol was performed on a MULTIGAMMA 1261 gammacounter and analysed with the software program MultiCalc 1224 (Perkin Elmer, Zaventem, Belgium). As the active form of ghrelin is highly unstable in blood, the predominant form in serum is unacylated ghrelin. Therefore, this study focused on total (active and unacylated) ghrelin serum concentrations. Some observations had values lower than the detection limit of the kit. Treating these observations as missing values would cause bias as it would selectively remove observations with low values. Thus, the values below the detection limit were set equal to the detection limit itself (100 pg/ml).
Statistical analysis
The effects of BW and age on the volume, weight and distribution in the fundic glands (base, middle and neck) of the GC; the weight and volume of the fundic layers together with the serum ghrelin concentrations were studied by fitting linear mixed models with BW and age as predictors. Age was entered as a categorical variable in most analyses, unless a clear linear trend was found upon visual inspection. In case the distribution of the residuals after regression was non-normal, regressions were performed on the logarithm of the outcome. To take into account the relatedness between observations within the same litter, a random intercept term for litter was added to the model. Adding a random slope term for weight did not lead to a significant improvement in the model fit for any of the variables tested. To fit the regression model for the fixed effects, a stepwise backward model-building strategy was applied, starting with the model that includes age, BW and their interaction, whereby the interaction term was first tested for significance. In case the interaction term was not significant, this term was removed from the model and a model including only the main effects for age and BW was fitted. Significance of the fixed effect terms in the equation was tested using the F-test with a Kenward–Roger correction for the numbers of degrees of freedom. In case one of the factors (age or region) was significant, a post hoc test was conducted with a Tukey correction for multiple testing. A P-value below 0.05 was considered significant.
All statistical calculations were carried out in the software package R version 2.13.1 (www.r-project.org). Mixed models were fit using the lme4 package. The F-test with Kenward–Roger correction was conducted using the package pbkrtest, and the posthoc test with Tukey correction was carried out as implemented in the multcomp package. Graphs were generated using the lattice package or Excel.
Results
Distribution of the GCs along the gastrointestinal tract
In general, the ghrelin IR cells were distributed throughout the gastrointestinal tract both prenatally and postnatally in the NW and SGA piglets. The ghrelin endocrine cells were abundant in the fundic mucosa, but were less numerous in the intestinal mucosa. Moreover, the presence of GCs diminished from the small to the large intestine in both the NW and SGA piglets (Supplementary Figure S1). The ghrelin endocrine cells were scattered in the epithelia of the intestinal crypts and villi. Both opened- and closed-type cells were observed in the porcine intestine (Supplementary Figure S2), whereas in the porcine gastric fundic glands only closed-type GC were present.
The volume densities of the GCs in the three different regions (base, middle and neck) of the fundic glands were significantly different from each other (P<1E−10), with the highest volume density in the base, followed by the middle and the top regions. However, the differences in distribution did not differ significantly across the different age and BW groups (P>0.05 for interaction between region: BW and region: age) (Supplementary Figure S3).
Ghrelin in the perinatal gastric mucosa and circulation of SGA and normal piglets: stereological and serological analyses
The volume density of the ghrelin IR epithelial cells in the perinatal gastric mucosa was similar between the different SGA age groups (P=0.47). Remarkably, a significant interaction was found between age (categorical) and BW (P=0.006), implying that age-related differences in the volume density of the ghrelin IR cells were not uniform across the low and NW piglets. A separate analysis showed that in NW piglets the volume density of ghrelin IR epithelial cells of the neonates was significantly higher compared with the other NW age groups (P=0.0019) (Supplementary Figures S4 and S5).
The estimated weight of the ghrelin IR epithelial cells increased exponentially with age in both NW and SGA piglets. Therefore, age was entered as an ordinal variable into the linear regression model. The increase in weight was highly significant (P=0.007), but the rate of increase was not significantly different between the normal and SGA piglets (P=0.52 for the interaction between weight and age). However, piglets from the NW group had, on average, a significantly higher weight of GC compared with their SGA littermates (P=0.03) (Supplementary Figure S5).
In contrast to the stereological analysis of GCs expressing active ghrelin, total ghrelin serum concentrations did not show an age (P=0.96) or a BW (P=0.41) effect (Supplementary Figure S6).
Volume densities and weights of the pars fundica and its layers: tunica mucosa, tela submucosa and tunica muscularis
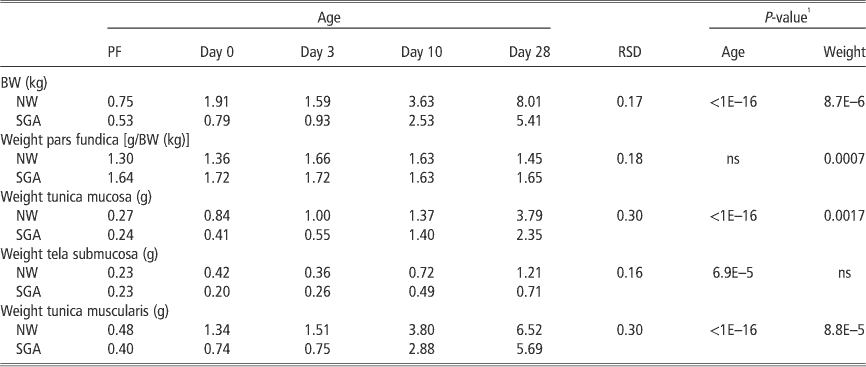
The relative weights of the pars fundica (g/kg BW) did not show an age effect, but a significant difference between the NW and SGA piglets was found. The SGA piglets had on average higher relative fundic weights compared with their normal littermates (Table 1). Although the volume density of the tunica mucosa remained more or less constant during development, the weight of the tunica mucosa significantly increased during postnatal development, with the most pronounced increase from day 10 onwards. The log (weight) increased linearly with age. On average, the NW piglets had higher tunica mucosa weights compared with their SGA littermates. However, the increase in the tunica mucosa weight during development was not different between the normal and low weight piglets (Table 1).
Effects of age on the weight of the gastric pars fundica and its distinct layers (estimated by volume density) in NW and SGA piglets

NW=normal weight; SGA=small-for-gestational age; ns=not significant; PF=pig foetus; RSD=residual standard deviation.
1 No significant interaction was found between age and BW for all variables, implying that the increase in weight according to age is not different between NW and SGA piglets.
No significant effect on BW was seen in the volume density of the tunica muscularis, but a difference according to the age was found (P=0.02). Age groups of day 10 and day 28 differed significantly from the foetal and the day 3 age groups (Supplementary Figure S7). The weight of the tunica muscularis mimicked the changes seen in the tunica mucosa: an increase postnatally in both SGA and NW piglets. This age effect was highly significant with the log of the weight increasing linearly with age. Like the weight of the tunica mucosa, the most pronounced increase was found from day 10 onwards. Moreover, a significant effect of BW was observed, with the NW piglets showing significantly higher values compared with their SGA littermates. However, the age-related differences in the tunica muscularis weight were not significantly different between the NW and SGA piglets (Table 1).
A significant difference in the volume density of the tela submucosa was present between age categories (P=9E–5), with foetal pigs having significantly higher volume densities compared with all other age categories (Supplementary Figure S7). No BW-related differences were observed and the differences between age groups were not different between NW and SGA littermates. Similar to the other layers of the fundic gastric wall, the weight of the tela submucosa increased during postnatal development in both SGA and NW piglets, with the day 10 and day 28 piglets being significantly different from the other age groups. The mean weight of the tela submucosa was higher in the NW piglets compared with the SGA littermates. Similar to the other fundic layers, the increase in the tela submucosa weight during development did not differ between normal and low BW littermates (Table 1).
Discussion
In this study, the SGA piglets have, on average, higher relative fundal weights compared with their NW littermates. This observation corresponds with previously published data (D’Inca et al., Reference D’Inca, Che, Thymann, Sangild and Le Huerou-Luron2010a). The weights of the different fundic layers are, in general, higher in NW animals compared with their SGA littermates. This accords with a previous study, which demonstrated similar differences in the thickness of the gastric layers between normal and growth-restricted piglets (Xu et al., Reference Xu, Mellor, Birtles, Reynolds and Simpson1994). However, the developmental growth pattern, that is, the age-related increase in the mucosal weight, did not differ between the normal and low weight piglets. The mucosal weights were estimated from the tissues that had been fixated in PFA and later embedded in paraffin. These procedures can induce tissue type-dependent shrinkage and compression. Therefore, the weights of the fundic layers determined by this stereological approach probably underestimate the real in vivo weights. However, the scope of this study was to compare these quantities among the different piglet groups from which the tissues had been similarly prepared. As it was expected that the shrinkage and compression be the same in all groups, we concluded that the various layers of the porcine gastric pars fundica do not show BW-dependent morphological diversification during development. These results provide valuable information about the developmental changes in the gastric morphology, which will assist in the interpretation of the maturation of gastric functioning in both normal and SGA piglets.
This study shows that the GCs populate the entire gastrointestinal tract of the pig during the perinatal period. As in humans, most of the ghrelin-expressing cells are located in the piglet’s stomach (Rindi et al., Reference Rindi, Necchi, Savio, Torsello, Zoli, Locatelli, Raimondo, Cocchi and Solcia2002). Similar as in foetal and adult man and adult pig, the density of GCs gradually decreases from the small intestine to the colon (Rindi et al., Reference Rindi, Necchi, Savio, Torsello, Zoli, Locatelli, Raimondo, Cocchi and Solcia2002; Wierup et al., Reference Wierup, Bjorkqvist, Westrom, Pierzynowski, Sundler and Sjolund2007). Similar to rats, the GCs of the porcine intestinal tract exist as two cell types, that is, round-shaped closed-type cells and triangular-shaped cells that are open into the lumen. Opened-type cells react to luminal information such as pH and nutrients, whereas closed-type cells are stimulated by hormones, neuronal stimulation or mechanical distension (Sakata et al., Reference Sakata, Nakamura, Yamazaki, Matsubara, Hayashi, Kangawa and Sakai2002a; Vitari et al., Reference Vitari, Di Giancamillo, Deponti, Carollo and Domeneghini2012).
Although closed-type GCs are present along the entire length of the fundic glands, the majority remains located at the glandular base, even when the pigs reach the weaning age. These results contrast with a study on rodents, in which the GCs spread from the base to the neck of the gastric glands with increasing age (Sakata et al., Reference Sakata, Tanaka, Matsubara, Yamazaki, Tani, Hayashi, Kangawa and Sakai2002b). Nonetheless, a recent study did observe this spreading in the oxyntic mucosa in older pigs (from 28 days to 7 months of age) (Vitari et al., Reference Vitari, Di Giancamillo, Deponti, Carollo and Domeneghini2012). Altogether, this pinpoints species-dependent timing of gastrointestinal maturation. In most rodents, the maturational changes are rather late and quick and occur mostly around weaning. In contrast, in humans, gastrointestinal maturation occurs rather early and progresses relatively slow. In large domestic animals such as pigs, the gastrointestinal maturation timing is intermediate and takes place both prenatally and postnatally, shortly after weaning (Sangild, Reference Sangild2006). It is possible that the quick maturation process in rats highlights the difference in GC distribution during the weaning period, and hence this altered distribution is only visible in pigs after weaning.
During ‘neonursing’, colostrum is continuously available for a period of 11 h after the start of farrowing (Lewis and Hurnik, Reference Lewis and Hurnik1986). The higher weight of the epithelial ghrelin IR cells that we found in NW day 0 piglets can be possibly attributed to this phase of nursing. Specifically, this larger number of GCs might implicate higher ghrelin secretion, which stimulates milk intake. However, this hypothesis is not supported by our serological analysis. This discrepancy might be explained by the fact that the immunohistochemical analysis determined the amount of GCs expressing the acylated, active form of ghrelin, whereas the serological analysis measured both active and unacylated ghrelin levels. Unacylated ghrelin is, in contrast to its acylated form, not able to bind the ghrelin receptor and, because of this, was initially considered as being physiologically inactive. Today, accumulating evidence indicates that unacylated ghrelin is also involved in metabolic processes via a separate signaling system (Toshinai et al., Reference Toshinai, Yamaguchi, Sun, Smith, Yamanaka, Sakurai, Date, Mondal, Shimbara and Kawagoe2006). The present study demonstrated comparable serum ghrelin levels in both SGA and normal piglets at all time points studied. This accords with human data, which failed to show any difference between IUGR and normal infants (Kyriakakou et al., Reference Kyriakakou, Malamitsi-Puchner, Mastorakos, Boutsikou, Hassiakos, Papassotiriou and Kanaka-Gantenbein2009). Others, however, demonstrated higher ghrelin levels in SGA neonates (Farquhar et al., Reference Farquhar, Heiman, Wong, Wach, Chessex and Chanoine2003). Hence, the specific role of ghrelin in perinatal growth remains unclear. Further studies determining both circulating active and unacylated ghrelin levels are necessary to define the specific roles of these two ghrelin forms in intrauterine growth retardation.
The lower weight of GCs expressing active ghrelin in the SGA piglets can further complicate sufficient milk consumption. This accords with previous studies that emphasize that birth weight is an important factor regulating milk intake (Milligan et al., Reference Milligan, Fraser and Kramer2001; Devillers et al., Reference D’Inca, Che, Thymann, Sangild and Le Huerou-Luron2007). On the other hand, appropriate milk intake may contribute to the maturation process of the gastrointestinal system and may thereby influence the amount of GCs. Because of their low birth weight, SGA piglets are not able to compete with larger siblings for colostrum (Hendrix et al., Reference Hendrix, Kelley, Gaskins and Hinrichs1978). Although most piglets establish to own a particular teat, many SGA piglets presumably fail, resulting in lower and insufficient intake of high-quality colostrum (Depassille et al., Reference Depassille, Rushen and Hartsock1988). However, the present study has shown that the growth pattern of the fundic layers is not disturbed in the perinatal SGA piglets. Therefore, it can be assumed that the developing stomach of SGA piglets has the same structural morphology as in NW piglets, and hence possesses the same necessary components for mature functioning.
Weaning is considered one of the most stressful periods that has a negative impact on feed intake and BW control, hence influencing ghrelin secretion (Salfen et al., Reference Salfen, Carroll, Keissler and Strauch2004). Our results did not show an effect at 28 days of age (age of weaning) on the amount of gastric GCs nor total ghrelin serum concentrations. Hence, in our study, the impact of weaning on ghrelin homeostasis in the gastrointestinal system is not evaluated. However, research of Du et al. (Reference Du, Shi, Wei, Liu, Zhang and Zhao2007) indicates that changes only appear 10 days after weaning. Interestingly, exogenous ghrelin induces weight gain in weaning piglets (Salfen et al., Reference Salfen, Carroll, Keissler and Strauch2004). Therefore, further research is needed on GC development and ghrelin secretion in piglets within the weaning period.
One limitation might be that the ghrelin levels are not measured after a fasting period. To circumvent this, each NW–SGA pair has been collected and processed simultaneously. Moreover, the statistical analysis takes the relatedness of observations within litters, hence within the NW–SGA pairs, into account.
Another issue of this study might be that the samples were collected from an uncontrolled environment, more specifically a commercial farm. As significant differences in the gastric distribution of the ghrelin endocrine cells can be observed in this uncontrolled environment, the sample collection in the commercial farm does not confound or complicate the interpretation of our results. Moreover, these results might provide an insight into both human and (domestic) piglets’ physiology. Interestingly, a recent study has shown that enteral administration of ghrelin in neonatal piglets influenced both intestinal growth and intestinal epithelial cell turnover (Slupecka et al., Reference Slupecka, Wolinski and Pierzynowski2012). As IUGR induces intestinal growth impairment (D’Inca et al., Reference D’Inca, Kloareg, Gras-Le Guen and Le Huerou-Luron2010b), the knowledge of an altered gastric GC distribution in the SGA piglets may be used for the preparation of milk formulas for neonates suffering from an insufficient development of the gastrointestinal system.
Conclusions
To the best of our knowledge, this is the first study investigating gastrointestinal and circulating ghrelin in IUGR piglets by comparing the serum levels of total ghrelin and the number of GCs expressing active ghrelin in the gastrointestinal tract in perinatal SGA piglets and normal littermates. Accordingly, it was demonstrated that NW newborns have higher number of gastric GCs compared with their SGA littermates. These results emphasize the importance of further research to circumvent the vicious circle of insufficient perinatal nutrition and gastrointestinal development in the pathology of IUGR, thereby having a permanent effect on the physiology and growth of both IUGR infants and SGA piglets.
Acknowledgements
The authors thank Katty Huybrechts and Gunther Vrolix for their technical assistance, and Walter Bleys and his team from the department Clinical Chemistry from the Antwerp University Hospital (UZA) for the assistance and use of equipment for radioactive immunoassays. This work was supported by a special research fund of the University of Antwerp (grant number 3978).