As evidence that conspiracy beliefs hinder pro-social behaviors while promoting anti-social ones has stockpiled (van der Linden, Reference van der Linden2015; Jolley et al., Reference Jolley, Douglas, Leite and Schrader2019; Imhoff and Lamberty, Reference Imhoff and Lamberty2020), understanding why individuals believe in conspiracy theories has increasingly become a priority for scholars across disciplines (e.g., Butter and Knight, Reference Butter and Knight2020). While many researchers employ surveys to measure beliefs in various conspiracy theories (e.g., Oliver and Wood, Reference Oliver and Wood2014; Cassino, Reference Cassino2016; Miller et al., Reference Miller, Saunders and Farhart2016),Footnote 1 some are beginning to question the various ways in which surveys may generate biased estimates of such beliefs (Berinsky, Reference Berinsky2018; Enders and Smallpage, Reference Enders and Smallpage2018a; Lopez and Hillygus, Reference Lopez and Hillygus2018). Should systematic measurement error exist, it would distort not only academic attempts at understanding the causes and consequences of conspiracy beliefs, but also disrupt the official communications, informational campaigns, and efforts at belief correction that rely on survey research (Berinsky, Reference Berinsky2015; Roozenbeek et al., Reference Roozenbeek, van Der Linden and Nygren2020).
Measurement issues are always complicated when scholars try to understand individuals' beliefs, but they are especially so when trying to measure beliefs in ideas that (1) appear ridiculous to some respondents (Lopez and Hillygus, Reference Lopez and Hillygus2018), (2) allow respondents to express a broader attitude, despite not agreeing with the specific proposition (Schaffner and Luks, Reference Schaffner and Luks2018), or (3) address ideas or behaviors the respondent may want to conceal (Clifford and Jerit, Reference Clifford and Jerit2015). This third instance, the primary concern of this study, is often referred to as social desirability bias. Social desirability bias is a type of response bias whereby subjects systematically alter their responses to certain stimuli because they do not want to admit to holding a belief (or engaging in conduct) that would clash with social norms or otherwise cause others (e.g., interviewers) to judge them negatively (Holbrook et al., Reference Holbrook, Green and Krosnick2003; Gonzalez-Ocantos et al., Reference Gonzalez-Ocantos, de Jonge, Meléndez, Osorio and Nickerson2012).
Social desirability bias is a particularly critical concern when it comes to conspiracy theories, which are habitually—even definitionally, in some cases—treated as fringe and oftentimes widely stigmatized (Lantian et al., Reference Lantian, Muller, Nurra, Klein, Berjot and Pantazi2018). This negative view of conspiracy theories is likely reinforced by media coverage, which frequently focuses on both the eccentricity and potential danger of conspiracy theories. Thus, the measurement of conspiracy beliefs is likely quite susceptible to social desirability bias, though only a few studies have examined this proposition, and in fairly limited ways (Wood, Reference Wood2016; Berinsky, Reference Berinsky2018).
We examine the effect of social desirability bias on the measurement of conspiracy beliefs using a survey administered to 8290 respondents across seven countries: Great Britain, Germany, Sweden, Portugal, Italy, Poland, and Argentina. Examining social desirability bias using a cross-comparative design is crucial, as what is socially acceptable is completely contingent on cultural norms. There can be no bias without social pressure, and which beliefs people feel social pressure to suppress is likely to vary across contexts. Thus, a complete examination of the impact of social desirability bias on the measurement of conspiracy beliefs—i.e., one that can generalize beyond the confines of one society—requires testing across different social and political contexts.
We estimate the extent of social desirability bias using an experimental design similar in structure to list experiments. In the control group, respondents were asked to reveal which of eight conspiratorial sentiments they agree with; in the treatment group, they were asked only how many of the eight sentiments they agreed with. While many respondents, across contexts, express general conspiratorial sentiments about concentrated power and secret government plots, far fewer respondents openly endorse specific conspiracy theories regarding the intentional spread of the AIDS virus or Holocaust denial, for example. Most importantly, we find—across these political and cultural contexts—that respondents systematically underreport their agreement with our list of specific conspiracy theories and more general conspiratorial propositions.
Our findings have multiple implications, both substantive and empirical. That public opinion polls appear to be systematically undercounting beliefs in conspiracy theories suggests, on the one hand, that the scope of the social problem posed by such beliefs may be greater than previously understood. On the other hand, that social desirability concerns are biasing our estimates also suggests that conspiracy theories are still perceived to be fringe, socially unacceptable beliefs. In other words, even though conspiracy beliefs are being underestimated, they are still far from “mainstream.” Our results also have implications for the measurement of conspiracy beliefs and the development of strategies for correcting such beliefs. Simply put, if surveys are systematically undercounting conspiracy beliefs, the efficacy of strategies to correct beliefs in conspiracy theories and even some misinformation—which rely on exposing people to precisely the kind of conspiratorial information that triggers social desirability bias—may be questionable. We further elaborate on these and additional implications below.
Measuring conspiracy beliefs
Before a researcher can decide how to measure something, they are first required to answer a theoretical question about what, exactly, they intend to measure. In this vein, measuring conspiracy beliefs requires researchers to determine what counts both as a “conspiracy theory” and as “belief” before they can measure such beliefs. In this way, measurement difficulties are not independent from theoretical ones, but intimately related: “measurement is theory-testing” (Jacoby, Reference Jacoby1999). If researchers are measuring conspiracy beliefs incorrectly, or if they are not properly accounting for potential biases, then our theoretical understanding will also be skewed.
Many researchers understand conspiracy theories—explanations of past, present, or future events or circumstances that cite as the primary cause a small group of powerful people working in secret, for their own benefit, against the common good, and in a way that undermines societal norms or laws (Uscinski, 2020)—to be precisely the kind of ideas that are prone to “social desirability bias” (Wood, Reference Wood2016; Lantian et al., Reference Lantian, Muller, Nurra, Klein, Berjot and Pantazi2018; Orr and Husting, Reference Orr, Husting and Uscinski2018; Thalmann, Reference Thalmann2019). Early studies conceptualized conspiracy theories as marginalized or stigmatized ideas (e.g., Hofstadter, Reference Hofstadter1964; Pipes, Reference Pipes1997) and some definitions of the term explicitly incorporate the criterion that very few people believe them (e.g., Freeman and Bentall, Reference Freeman and Bentall2017). Of course, such understandings have driven the theoretical understanding of conspiracy theories to be something concentrated on the fringes, with social scientists therefore focusing on finding them among the marginalized and less powerful (Goertzel, Reference Goertzel1994; Waters, Reference Waters1997; Bird and Bogart, Reference Bird and Bogart2003; Simmons and Parsons, Reference Simmons and Parsons2005; Avery, Reference Avery2006; Rousseau and Jamil, Reference Rousseau and Jamil2008; Mattocks et al., Reference Mattocks, Gibert, Fiellin, Fiellin, Jamison, Brown and Justice2017).
However, as polling data have continually demonstrated, conspiracy beliefs are widely held in numerous countries (Oliver and Wood, Reference Oliver and Wood2014; Hogg et al., Reference Hogg, Nkala, Dietrich, Collins, Closson, Cui, Kanters, Chia, Barhafuma, Palmer, Kaida, Gray and Miller2017; Nyhan and Zeitzoff, Reference Nyhan and Zeitzoff2018; Soral et al., Reference Soral, Cichocka, Bilewicz, Marchlewska and Uscinski2018), even by majorities in some instances (e.g., Drochon, Reference Drochon and Uscinski2018; Enders and Smallpage, Reference Enders, Smallpage and Uscinski2018b). This has shifted researchers' views of conspiracy theories over time, with beliefs in such theories now being recognized as “commonplace” (Miller and Saunders, Reference Miller and Saunders2016, see also Barkun, Reference Barkun2016). Furthermore, the conceptualization of conspiracy theories as the province of the marginalized, powerless, and socially excluded has been deeply criticized (e.g., Nyhan and Zeitzoff, Reference Nyhan and Zeitzoff2018). This is not to say, however, that social desirability biases do not play a role in researchers' measurements of these beliefs in surveys. Indeed, recent research suggests that while “conspiracy theory,” as a general concept, may carry less social stigma than one might expect (Wood, Reference Wood2016), specific conspiracy theories may carry enough stigma to encourage people to conceal related beliefs (Lantian et al., Reference Lantian, Muller, Nurra, Klein, Berjot and Pantazi2018).
The impact of social desirability
Regardless of a changing scientific consensus on who believes in conspiracy theories and why, popular narratives frequently describe conspiracy theories and theorists as irrational, fringe, and extreme (Thalmann, Reference Thalmann2019; Bratich, Reference Bratich2008; Coady, Reference Coady2018; Orr and Husting, Reference Orr, Husting and Uscinski2018). Studies show that people who believe conspiracy theories “actively resist their stigmatization” by framing their theories in other ways (Harambam and Aupers, Reference Harambam and Aupers2017), likely because they expect to “be socially excluded when they express endorsement” of specific theories (Lantian et al., Reference Lantian, Muller, Nurra, Klein, Berjot and Pantazi2018). This explains why, when espousing conspiracy theories, many people opt for a “just asking questions” style of argumentation, rather than directly expressing their theories (Wood, Reference Wood2018, see also Wood and Douglas, Reference Wood and Douglas2013). The stigmatization encouraging this behavior may not just be perceived: for example, “conspiracy theorists,” as a group, are rated on surveys more negatively than other groups, such as members of the out-party (Smallpage, Reference Smallpage and Uscinski2018). Moreover, there seems to be little public tolerance for the advocation of certain conspiracy theories, such as those regarding school shootings (Smallpage, Reference Smallpage and Uscinski2018).
Outside of the popular usage of the term, conspiracy theories have even been pathologized in the scholarly literature (Butter and Knight, Reference Butter, Knight and Uscinski2018). Social scientists and philosophers have, historically, dismissed conspiracy theories outright (Popper, Reference Popper1972), treating them as “irrational” (Harambam and Aupers, Reference Harambam and Aupers2015) or reducing them to “vices” (Cassam, Reference Cassam2016). Some scholars have even proposed that we combat conspiracy beliefs with ridicule (Orosz et al., Reference Orosz, Krekó, Paskuj, Tóth-Király, Bőthe and Roland-Lévy2016) or by sending undercover government agents into chat rooms to engage in “cognitive infiltration” (Sunstein and Vermeule, Reference Sunstein and Vermeule2009). All this is to further demonstrate the scope of the stigmatization of conspiracy beliefs: even scholars who better understand the rational political, psychological, and social ingredients of conspiracy beliefs now, nevertheless once chalked them up to the bizarre beliefs of an irrational few (and a minority continue to do so).
Despite ample reason to anticipate social desirability bias, there exists limited empirical evidence that conspiracy beliefs are being underestimated on surveys in this way. Survey respondents are more likely than not to register belief in at least one conspiracy theory when queried about several (Goertzel, Reference Goertzel1994; Oliver and Wood, Reference Oliver and Wood2014), they are no less likely to register belief in a proposition when it is called a “conspiracy theory” rather than a mere “idea” (Wood, Reference Wood2016), and when social scientists broaden the types of questions asked—seeking to measure general conspiratorial orientations—positive response rates become quite high (Drinkwater et al., Reference Drinkwater, Dagnall, Denovan and Neave2020; Miller, Reference Miller2020).
Thus, we are left with a conflicted literature. On the one hand, there is evidence showing that people do not want to label their beliefs as conspiracy theories (Wood and Douglas, Reference Wood and Douglas2013), do not want to express conspiracy theories publicly (Lantian et al., Reference Lantian, Muller, Nurra, Klein, Berjot and Pantazi2018), and stigmatize conspiracy theorists in society (Smallpage, Reference Smallpage and Uscinski2018). On the other hand, people are no less likely to express belief in ideas labeled as conspiracy theories (Wood, Reference Wood2016) and many respondents—sometimes majorities—express belief in specific conspiracy theories and general conspiratorial views on surveys (Uscinski et al., Reference Uscinski, Klofstad and Atkinson2016, Enders and Smallpage, Reference Enders, Smallpage and Uscinski2018b). It is, therefore, imperative that survey researchers address the question of whether social desirability bias matters in the context of conspiracy beliefs or not. Attempting to integrate the disparate findings, we might surmise from the literature that people may not have an aversion to believing in conspiracy theories in general but may not want to admit to those beliefs in some circumstances, perhaps because they may want to avoid the stigma attached to being labeled a conspiracy theorist for expressing belief in a specific idea. The literature, therefore, leads us to a testable hypothesis:
H1: People systematically underreport their conspiracy beliefs when they have to explicitly denote which theories they believe in.
Testing social desirability across contexts
The basic nature and scope of social desirability bias are rooted in culture: people are dissuaded from revealing beliefs (or behaviors) because of social norms about what is (not) acceptable (Keillor et al., Reference Keillor, Owens and Pettijohn2001; Johnson and Van de Vijver, Reference Johnson and Van de Vijver2003; Bou Malham and Saucier, Reference Bou Malham and Saucier2016). For example, in Argentina, there is a prominent OVNI (objeto volador no identificado, or “unidentified flying object”) culture regarding alien sightings that might make UFO conspiracy theories more socially acceptable than other ones (Sheinin, Reference Sheinin2018). Moreover, some countries may have histories littered with more instances of actual conspiracies than others—this, too, may result in conspiracy theories being more acceptable explanations for salient phenomena. In this light, we might expect that the impact of social desirability bias on conspiracy belief estimation can vary across cultural contexts based on the acceptance of conspiracy theories in each culture. The level of conspiracy stigmatization in a given culture can find roots in factors such as societal norms regarding interest and involvement in politics, as well as norms concerning political discourse. It may also be influenced by the shape and form of political and economic institutions, the performance of those institutions, and both recent and past events and circumstances.
With an eye toward this potential impact of cultural variability, we test our hypothesis across seven countries: Great Britain, Germany, Sweden, Portugal, Italy, Poland, and Argentina (Drochon, Reference Drochon and Uscinski2018). This sampling of countries provides variation along numerous dimensions. For example, our sample incudes European countries that geographically span the continent, as well as a South American state (Argentina). These states also vary considerably in nominal gross domestic product (e.g., Germany at $3.6 trillion versus Poland at $0.5 trillion), population size (e.g., Germany at 84 million versus Sweden at 10 million), and income inequality according to the GINI index (e.g., Argentina at 41 versus Sweden at 29). Finally, these countries vary in their political systems, levels of civic engagement, and other cultural norms that may impact how conspiratorial ideas are generally treated in society.
While we do not construct specific hypotheses linking these many factors to the expression of conspiracy beliefs, our intention is to provide for the possibility that political, social, and cultural norms—which vary across countries—may impact the nature and scope of social desirability bias. Moreover, allowing for cross-national variation in the social desirability dynamic will result in our empirical test, which we describe in the next section, resting on firmer grounds than the majority of conspiracy belief research, most of which is examined in the context of a single or very few countries.
Data and method
In order to test our hypothesis, we use an experimental design similar to a list experiment (e.g., Lax et al., Reference Lax, Phillips and Stollwerk2016). Within each of the seven country-samples listed above, respondents were randomly assigned to either a control or treatment condition. Those in the control group selected which of eight distinct statements they believed; this was done via radio buttons whereby respondents simply checked a box next to the beliefs they hold. The specific question was, “Which, if any, of the following statements would you say are true? (Please select all that apply).” The treatment group was instructed to read the entire list of eight statements and indicate only how many of the statements they believed, but not which ones. If social desirability bias causes people to conceal conspiracy beliefs, we should observe that the number of conspiracy beliefs reported by the treatment group exceeds that reported by the control group. The statements, which appear identically across all seven countries, are as follows (labels in parentheses):
1. Even though we live in what's called a democracy, a few people will always run things in this country anyway (Elite Control).
2. Secret plots that harm the nation are more common in this country than in other countries (Secret Plots).
3. Humans have made contact with aliens and this fact has been deliberately hidden from the public (Alien Contact).
4. The AIDS virus was created and spread around the world on purpose by a secret group or organization (AIDS Virus).
5. Regardless of who is officially in charge of governments and other organizations, there is a single group of people who secretly control events and rule the world together (Control World).
6. The official account of the Nazi Holocaust is a lie and the number of Jews killed by the Nazis during World War II has been exaggerated on purpose (Holocaust Denial).Footnote 2
7. The idea of man-made global warming is a hoax that was invented to deceive people (Global Warming).
8. The Government is deliberately hiding the truth about how many immigrants really live in this country (Hide Immigrants).
This is, of course, an inexhaustive list of conspiracy theories—an unavoidable feature of conspiracy belief scholarship given the seemingly infinite number of conspiracy theories (Uscinski, 2020). That said, this list includes a broad range of conspiratorial ideas. Some are specific conspiracy theories (Alien Contact, AIDS Virus, Holocaust Denial, Global Warming, Hide Immigrants), while others are more general conspiratorial sentiments (Elite Control, Secret Plots, Control World). Furthermore, these statements address a range of topical domains around which conspiracy theories are oftentimes constructed, including the paranormal (Alien Contact), immigrants and minority groups (Hide Immigrants, Holocaust Denial), and scientific and medical issues (AIDS Virus, Global Warming). As our hypothesis does not specify, and our empirical test does not require, people in each country to report the same number of beliefs about the same conspiracy theories and conspiratorial propositions, this variability in the conspiracy theories we employ is a virtue of the study.
All surveys were conducted in March 2016 using an online interview administered to members of panels that YouGov constructed and maintains. Emails were sent to panelists selected at random from the base sample. The responding sample was then weighted on age, gender, and region to reflect the composition of each country's population using available census data.Footnote 3 Sample sizes and fielding dates for each country are as follows: Great Britain (n = 1742; 3/11/2016–3/14/2016), Germany (n = 2039; 3/9/2016–3/11/2016), Sweden (n = 1007; 3/11/2016–3/14/2016), Portugal (n = 500; 3/8/2016–3/29/2016), Italy (n = 1001; 3/8/2016–3/21/2016), Poland (n = 1000; 3/8/2016–3/21/2016), and Argentina (n = 1001; 3/8/2016–3/21/2016). The survey was originally written in English and translated into the other languages by either the YouGov offices in those countries (in the case of Germany, Poland, Italy, Sweden) or certified partners (in the case of Argentina and Portugal). We include a table of substantive and sociodemographic characteristics of each sample in the Appendix.
Results
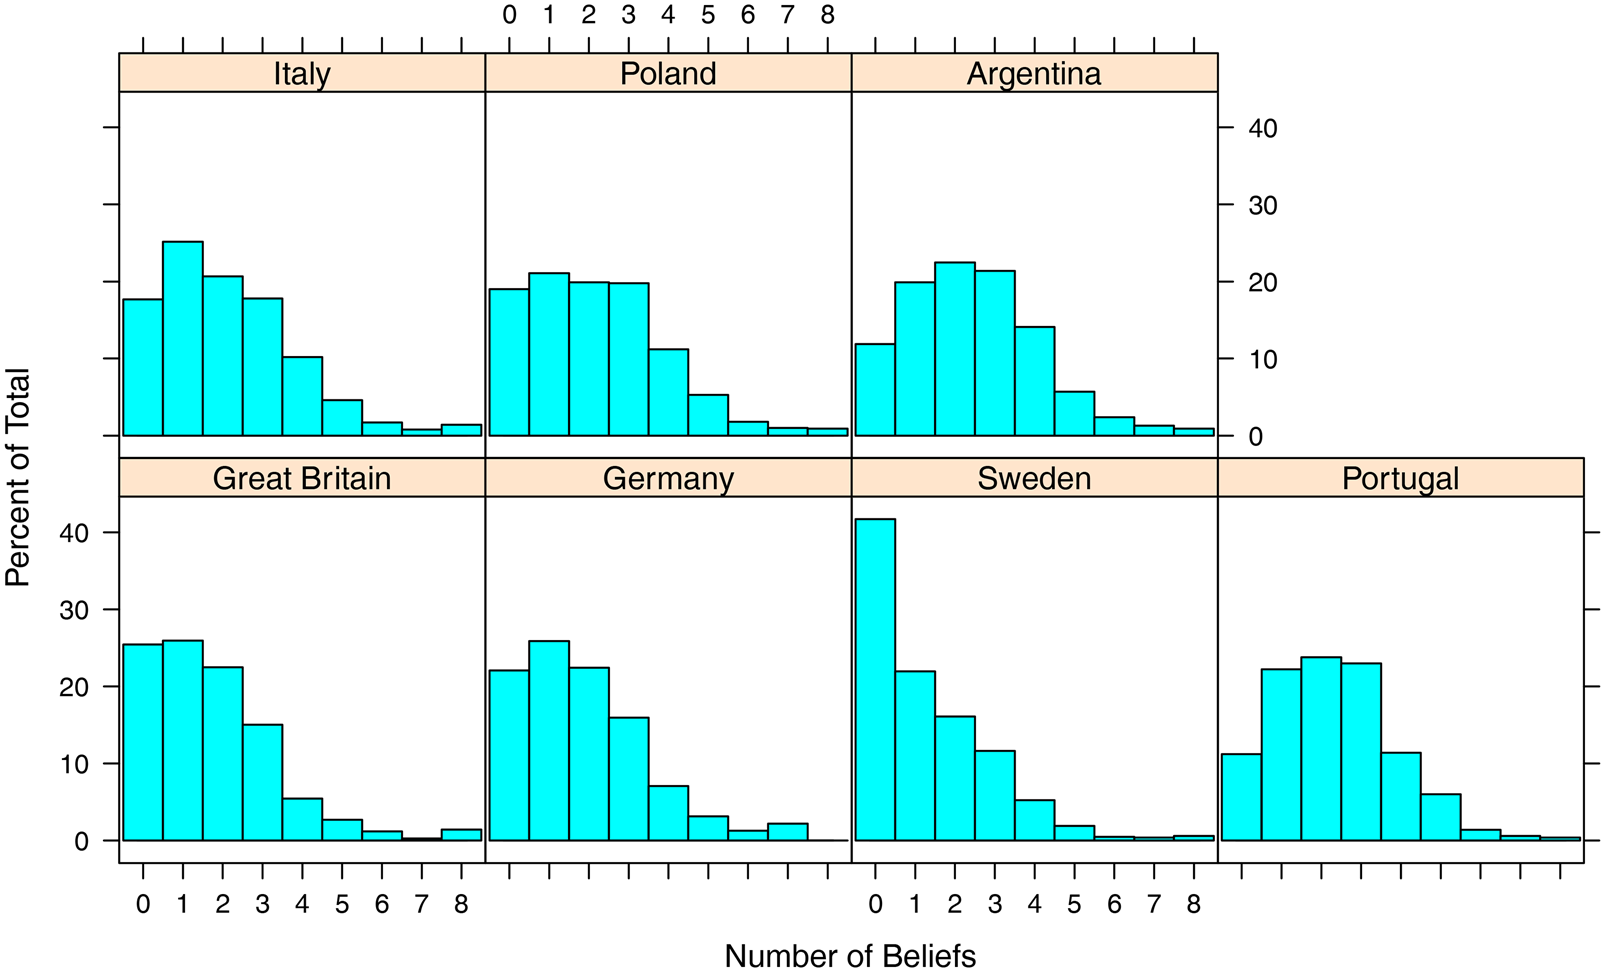
We begin our analysis by simply examining the distribution of a count of the conspiracy beliefs respondents hold—across experimental conditions—by country. This appears in Figure 1. In each instance, the distribution of conspiracy beliefs is positively skewed such that most respondents express very few, if any, conspiracy beliefs. The median number of conspiracy beliefs is 2 for all countries but Great Britain and Sweden, for which it is 1. Sweden, exhibiting the greatest skew, is the only country with a modal value of 0 conspiracy beliefs. These distributions leave us with a somewhat mixed picture of conspiracy beliefs across countries: on the one hand, there is visible cross-comparative variability in the number of conspiracy beliefs people report; on the other, most people appear to believe in 0–2 of the conspiracy theories we polled, with very few believing more than 3.
Distribution of conspiracy belief count in each country.

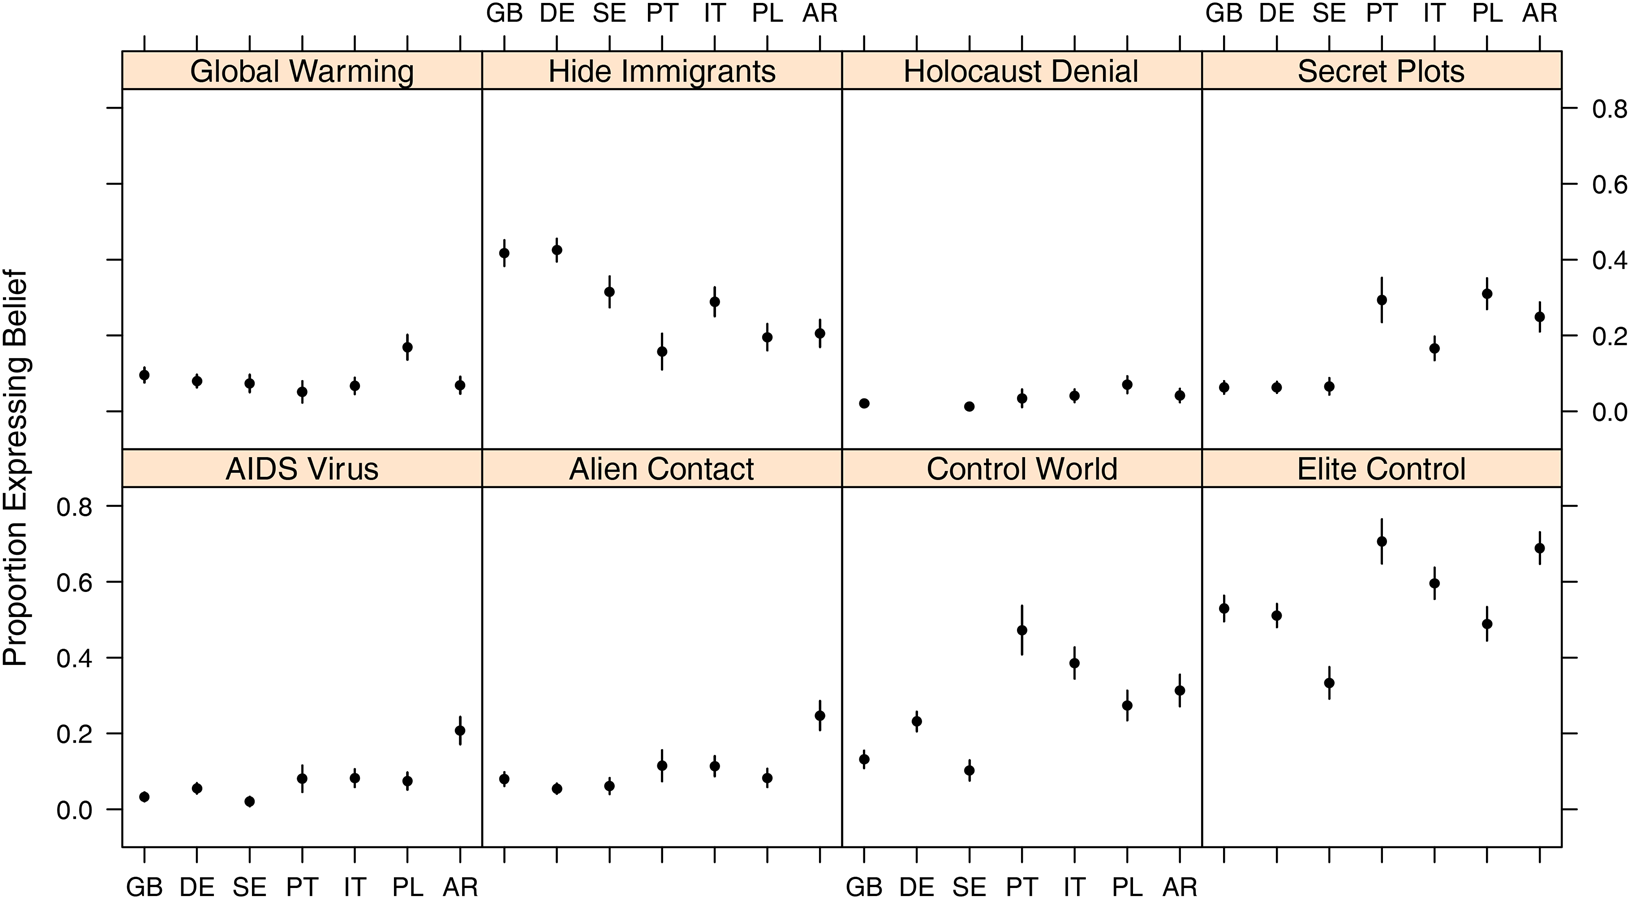
In order to better understand how conspiracy beliefs vary across political and cultural contexts, we next plot the proportion of individuals in each country subscribing to each conspiracy theory in Figure 2.Footnote 4 The Holocaust Denial belief receives the lowest levels of support across countries (3 percent, on average), followed by AIDS Virus (7 percent), Global Warming (9 percent), and Alien Contact (10 percent). Note, however, that a significantly higher proportion of Argentines believe the AIDS Virus (21 percent) and Alien Contact (25 percent) conspiracy theories, and a significantly greater number of Poles believe the Global Warming theory (17 percent).
Proportion of individuals who believe each conspiracy theory, by country. Vertical bars represent 95 percent confidence intervals.

There is even greater variability in the more general conspiracy theories, though they tend to find more support, on average: Elite Control (53 percent across countries), Hide Immigrants (32 percent), Control World (24 percent), and Secret Plots (14 percent). For example, more Britons and Germans express belief in the Hide Immigrants theory (42 and 43 percent, respectively). This is also the only theory for which Sweden does not exhibit the lowest proportion of believers (either statistically lower or tied for lowest). The Elite Control, Control World, and Secret Plots theories all receive the most support among the Portuguese, with high or middling numbers among Poles, Italians, and Argentines.
This analysis establishes that there is considerable variability in which conspiracy theories find support in each of the seven countries we examine. Recall that we welcome this variability. If what is “acceptable” or “unacceptable” in a given culture—which surely plays some important part in causing the observed variability in Figure 2—determines the nature and magnitude of social desirability bias, it is critical for any complete investigation of the impact of social desirability bias to consider multiple contexts. Even though examination of more South American, African, and Asian cultures—where inadequate census records, hostile political climates, unsuitable communication technology, and other issues frequently prevent high-quality polling—would surely strengthen our analysis, we are nevertheless capturing considerable cross-national variability in both socio-political characteristics and specific observed conspiracy beliefs.
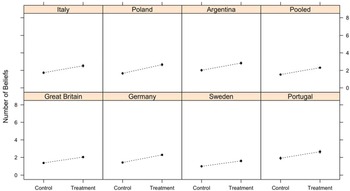
Turning to our examination of experimental results, we first plot the average count of conspiracy beliefs, by experimental condition and country, in Figure 3; we also include an eighth panel with the control and treatment group means pooled across all countries. The pattern is remarkably consistent across countries: in every case, the treatment group—in which respondents only listed the number of conspiracy theories they believe—exhibits a statistically greater number of conspiracy beliefs (p < 0.001 in each case, Bonferroni-corrected).Footnote 5 This difference is 0.78 beliefs on average, ranging from a low of 0.61 in Sweden to a high of 1.00 in Poland. Cohen's d, a standardized measure of effect size, are as follows for each country: Great Britain (d = 0.42, 95 percent CI 0.33–0.51), Germany (d = 0.56, 95 percent CI 0.48–0.64), Sweden (d = 0.41, 95 percent CI 0.29–0.54), Portugal (d = 0.50, 95 percent CI 0.32–0.68), Italy (d = 0.48, 95 percent CI 0.35–0.60), Poland (d = 0.61, 95 percent CI 0.50–0.72), and Argentina (d = 0.50, 95 percent CI 0.38–0.63). In other words, the count of conspiracy beliefs in the treatment group is, on average, 0.50 standard deviations higher than the count in the control group. According to conventional rules of thumb, these represent medium–large effect sizes.
Average count of conspiracy beliefs, by experimental condition and country. Vertical bars represent 95 percent confidence intervals. The “Pooled” panel contains the average across all countries. Treatment effect is significant at p < 0.001 in each case (Bonferroni-corrected).

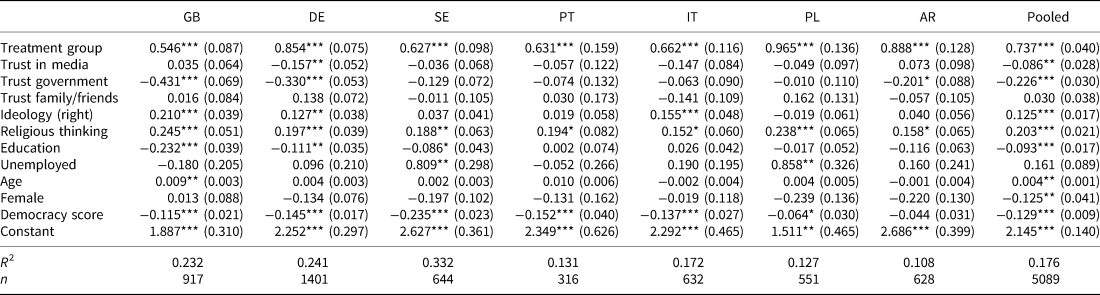
Even though random assignment to the two experimental conditions appears to be balanced (see the Appendix for a randomization check), we opted to provide a conservative assessment of the treatment effects in the context of regression models. This allows us to control for a profile of covariates that might impact our estimate of the treatment effect and to check for potential heterogeneous treatment effects. In Table 1 we present the results from OLS regressions for each country, including controls for trust in the media, trust in government, trust in family and friends, political ideology, religious thinking, educational attainment, employment status, age, gender, and one's perception of how democratic their country is. Details about the measurement of these variables appear in the Appendix. The final column includes the estimates from a fixed-effects regression of the pooled dataset, which includes all countries.
Regressions of count of conspiracy beliefs on treatment indicator and controls, by country

Pooled model uses fixed effects.
Regression coefficients with standard errors in parentheses. Country codes are as follows: Great Britain (GB), Germany (DE), Sweden (SE), Portugal (PT), Italy (IT), Poland (PT), Argentina (AR). *p < 0.05, **p < 0.01, ***p < 0.001.
Despite statistically significant associations between some control variables and the count of conspiracy beliefs, the treatment effect is statistically significant across all models. Indeed, the treatment group variable is the only statistically significant one across all countries besides religious thinking. This makes good sense as previous studies conducted in different socio-political contexts have revealed that various operationalizations of religious thinking are consistently related to conspiracy beliefs (Drinkwater et al., Reference Drinkwater, Dagnall and Parker2012, Oliver and Wood, Reference Oliver and Wood2014). We also observe a significant negative relationship between democracy scores and conspiracy beliefs in six out of seven countries, signaling that the more democratic one perceives their country to be, the fewer conspiracy beliefs they harbor. The remaining controls are only idiosyncratically related conspiracy beliefs across countries.
We also re-estimated the pooled model with interactions between the treatment and each control variable, the full results of which appear in the Appendix.Footnote 6 We observed only one significant interaction, with the religious thinking variable. The treatment effect increases from 0.63 (95 percent CI: 0.52, 0.73) among those who say “none of what happens in my life is caused by a ‘higher force’, such as God, fate or destiny” to 0.98 (95 percent CI: 0.80, 1.16) among those who say “everything that happens in my life is caused by a ‘higher force’, such as God, fate or destiny.” This makes substantive sense in the context of the social desirability bias framework: those who believe that everything is caused by a higher force are likely to be more attuned and sensitive to social pressure regarding their beliefs, especially in Western European countries that exhibit very low levels of religiosity (Pew, 2020). In other words, people with high levels of religious thinking may be more likely to conceal additional beliefs that are stigmatized in their society.
Discussion
Our analysis shows that social desirability bias significantly impacts the reporting of conspiracy beliefs on surveys and does so systematically across political and cultural contexts where beliefs in conspiracy theories vary in content and number. Specifically, people underreport conspiracy beliefs by an average of between 0.61 and 1.00 beliefs across the seven countries we studied. This finding has several substantive and methodological implications.
First, it appears that peoples' conceptualization and psychological interaction with conspiracy theories is consistent across political and cultural contexts, regardless of their specific conspiracy beliefs. This finding comports with many of the findings generated by a slowly expanding strain of literature that looks cross-culturally at conspiracy beliefs (Bruder et al., Reference Bruder, Haffke, Neave, Nouripanah and Imhoff2013; van Prooijen et al., Reference van Prooijen, Krouwel and Pollet2015, Lantian et al., Reference Lantian, Muller, Nurra and Douglas2016, Drochon, Reference Drochon and Uscinski2018, Smallpage et al., Reference Smallpage, Drochon, Uscinski, Klofstad, Butter and Knight2020). For example, Walter and Drochon (Reference Walter and Drochon2020) find that the basic structure of conspiracy beliefs is fairly consistent across nine European and North American countries, as are many of the substantive correlates of conspiracy beliefs. While previous work such as this showcases that the basic psychology of conspiracy thinking is similar cross-culturally, our study clarifies one potential mechanism by which this is true: democratic societies may stigmatize conspiracy beliefs in similar ways.
Second, our findings show that people believe more conspiracy theories than survey results currently suggest. Even though previous research reports that many people believe in various conspiracy theories and endorse conspiratorial ideas of various sorts, the true number of believers may be significantly higher. This only underscores that conspiracy theories are hardly marginal ideas; rather, they are important and potentially consequential fixtures of politics and culture that must be taken seriously.
Still, one may wonder whether a biased estimate of approximately one belief is substantively meaningful. We believe it is. In Figure 1, we can see that the distribution of conspiracy beliefs in each country is noticeably positively skewed. Not many people believe most of the theories we polled on, which is congruent with the majority of previous work across contexts (Oliver and Wood, Reference Oliver and Wood2014, Miller et al., Reference Miller, Saunders and Farhart2016, Adam-Troian et al., Reference Adam-Troian, Wagner-Egger, Motyl, Arciszewski, Imhoff, Zimmer, Klein, Babinska, Bangerter, Bilewicz, Blanuša, Bovan, Bužarovska, Cichocka, Çelebi, Delouvée, Douglas, Dyrendal, Gjoneska, Graf, Gualda, Hirschberger, Kende, Krekó, Krouwel, Lamberty, Mari, Milosevic, Panasiti, Pantazi, Petkovski, Porciello, Prims, Rabelo, Schepisi, Sutton, Swami, Thórisdóttir, Turjačanin, Zezelj and van Prooijen2020). That said, about half of respondents still believe 1–3 conspiracy theories. If this is the effective range of conspiracy theories that most people believe in and people are consistently underreporting by approximately one belief, the extent of bias strikes us as substantively quite large.
This bias may be additionally underscored if there are differences in the implications of conspiracy beliefs being underreported. Take, for example, a scenario where one divulges that they believe in a conspiracy theory about UFOs but conceals a true belief that COVID-19 is a hoax. The UFO conspiracy theory is fairly innocuous in terms of societal implications. The COVID-19 conspiracy belief, however, might lead one to hoard goods or ignore public health practices, like social distancing (Imhoff and Lamberty, Reference Imhoff and Lamberty2020)—behaviors that can impact everyone. If beliefs in “dangerous” conspiracy theories are more likely to be concealed than relatively innocuous ones, the implications of our findings could be quite dire. Even though we cannot answer all of these questions yet, knowing that social desirability bias does appear to afflict the estimation of conspiracy beliefs across socio-political contexts in a similar way is an important first step in assessing the scope and nature of the problem.
Third, that people believe in more conspiracy theories than they indicate on surveys has methodological implications for research into conspiracy beliefs. While some previous studies have shown that conspiracy beliefs are being accurately estimated using surveys (Berinsky, Reference Berinsky2018), others argue that conspiracy beliefs are actually being overestimated (Lopez and Hillygus, Reference Lopez and Hillygus2018; Clifford et al., Reference Clifford, Kim and Sullivan2020, Sutton and Douglas, Reference Sutton and Douglas2020). We find that conspiracy beliefs may be underestimated. Biased estimation is never a welcome problem, though it may be an insurmountable one all the same. Considering our findings, researchers may attempt several steps to mitigate the impact of social desirability bias. For instance, they might emphasize, before respondents are exposed to conspiracy-related content, that all responses are anonymous, perhaps even highlighting how the anonymization process unfolds. They should certainly avoid leading content that cues respondents to the goal of measuring conspiracy beliefs, perhaps in the form of question introductions or other frames, as previous work demonstrates the measurable impact of such cues (Krosnick et al., Reference Krosnick, Malhotra and Mittal2014; Lyons et al., Reference Lyons, Merola and Reifler2018). Researchers might also consider allowing gradations of response—in the form of agreement or expressed likelihood—to conspiratorial propositions. That said, previous work finds that explicit choice formats that allow respondents to opt out, exactly as the items in the control group of our study operated, provide the most accurate estimates of conspiracy beliefs (Clifford et al., Reference Clifford, Kim and Sullivan2020).
Whereas the aforementioned strategies are aimed at preventing or reducing social desirability bias, perhaps researchers should also consider correcting estimates for social desirability bias after the fact. Our findings reveal a very stable effect of social desirability bias across socio-political contexts. If more testing reveals similarly stable effects, we may be able to devise formal or informal post hoc adjustments to our measurements of the level of conspiracy beliefs. One way to estimate the impact of social desirability bias on specific individual conspiracy beliefs is to undertake more traditional list experiments. These would allow us to determine the level of belief in a given conspiracy theory under a condition of strict anonymity. This level can be compared to the results of a more traditional question format where we explicitly ask respondents about their belief in the theory. The difference between the two strategies can serve as an estimate of the magnitude of bias introduced by social desirability concerns. This is but one example of a methodological strategy we can use to overcome social desirability bias once it is properly understood. We strongly encourage future work to pursue these and related avenues.
Finally, our results have implications for the expanding literature on the correction of beliefs in conspiracy theories and misinformation. The typical correction study randomly exposes some subjects to information designed to correct—reduce, weaken, or altogether eliminate—beliefs in ideas deemed to be factually incorrect, and perhaps even harmful. If subjects in the treatment group exhibit weaker or less beliefs in dubious ideas than those in the control group, the correction strategy is typically successful. Our findings pose a potential problem for this type of inference: Are corrective frames merely inducing social desirability bias, rather that truly reducing “problematic” beliefs? Such a scenario would result in the desirable treatment effect, but perhaps not a substantive, permanent change in beliefs—precisely the outcome we are interested in. Minimally, it seems reasonable to wonder whether treatment effects from dubious belief-correcting experiments are smaller than they appear to be (i.e., the correction strategies are less efficacious than we currently believe them to be). These possibilities must be explored more if we are to successfully limit the pernicious effects of beliefs in conspiracy theories and misinformation.
Even though much more investigation into the impact of social desirability bias is needed, we see reason for optimism. That the nature of the problem (i.e., underestimating conspiracy beliefs) is consistent across the contexts we studied simplifies the challenge posed. As long as conspiracy beliefs and their effects are being taken seriously by practitioners, as they appear to be, the impact of naturally occurring underestimates can be minimized by recognizing the bias and continuing to understand its shape and scope across contexts and particular conspiracy theories.
Of course, our study is not without limitations. While the seven countries we studied vary considerably along many political and cultural dimensions, more tests of our hypothesis in additional contexts will only sharpen our understanding of the structure of conspiracy belief. In particular, it would be illuminating to test for social desirability bias in countries under autocratic rule, where people are more likely to be regularly lied to by a government that actually conspires against its own people. Perhaps in these settings, conspiracy beliefs are more justified and, therefore, more commonplace. We also encourage future work to replicate our analysis with different conspiracy theories. As with the countries/samples, more is always better. Finally, we believe it is important to test for social desirability bias across different survey response formats, as alluded to above. Though previous work has conceptualized graded response formats (e.g., Likert-type response options) as overestimating conspiracy beliefs (Clifford et al., Reference Clifford, Kim and Sullivan2020), our results prompt some question as to whether that is the correct interpretation—perhaps those formats are accurately capturing conspiracy beliefs that would not be properly expressed under a forced choice format. How to measure conspiracy beliefs using surveys is a crucially important line of inquiry that needs to be further investigated.
Supplementary material
The supplementary material for this article can be found at https://doi.org/10.1017/psrm.2022.1. To obtain replication material for this article, please visit https://doi.org/10.7910/DVN/NUOE6Z
Data
All data and files will be posted publicly prior to publication.
Conflict of interest
None.