1. Introduction
The two Spanish copular verbs, ser and estar “to be”, have been the object of extensive debate because most descriptions of their distribution based on a single binary variable have met with important counter-examples (Leonetti, Reference Leonetti1994; Clements, Reference Clements, Clements and Yoon2005; Geeslin, Reference Geeslin2005). Additionally, the use of these verbs varies between groups and within individuals. Sociolinguists have documented variation for Spanish in the US (Silva-Corvalán, Reference Silva-Corvalán1994; Geeslin, Reference Geeslin2003; Salazar, Reference Salazar2007), Mexico (Gutiérrez, Reference Gutiérrez1992; Cortes-Torres, Reference Cortes-Torres2004), Puerto Rico (Ortiz-López, Reference Ortiz-López2000), and Venezuela (de Jonge, Reference de Jonge, Drijkoningen and Hengeveld1993; Díaz-Campos and Geeslin, Reference Díaz-Campos and Geeslin2004). In general, it has been shown that the extension of estar to new [copula + adjective] contexts continues in monolingual varieties of Spanish and is accelerated in bilingual contexts (Gutiérrez, Reference Gutiérrez1992; Silva-Corvalán, Reference Silva-Corvalán1994). Silva-Corvalán (Reference Silva-Corvalán1994) argues that change is internally-motivated but the causes of this acceleration are likely to be multiple. Among potential causes are lack of access to a formal standard, existence of a parallel structure in the contact language, and several factors related to the cognitive demands of bilingualism in general. Such factors include the simplification of alternatives, selective acquisition, and the freezing of competence at a certain age, all of which are related to the overall tendency of bilinguals to participate in processes of simplification as a result of the cognitive load of communicating in two languages (Silva-Corvalán, Reference Silva-Corvalán1994, p. 115). Thus, some of these causes are related to the nature of bilingualism in general, some are extralinguistic factors connected to particular bilingual situations, and some are a consequence of features of the language with which Spanish is in contact. These potential correlates of language use point to unanswered questions. For example, researchers have only recently begun to explore the effects of contact on Spanish by languages that possess a copula contrast (Guijarro-Fuentes and Geeslin, Reference Guijarro-Fuentes and Geeslin2006a, Reference Guijarro-Fuentes and Geeslinb). Secondly, in the case of US Spanish, the lack of access to formal Spanish is assumed to be an important explanation of the effects found for contact with English, but lack of research on other contact situations, where speakers have access to formal Spanish, has made confirmation of this hypothesis impossible. Finally, the mere fact of speakers being bilingual may prove to be a significant predictor of the rate of change, leading us to hypothesize that language change is accelerated wherever language contact takes place. In light of these questions, the current study further explores the frequency and the linguistic predictors of the selection of estar among bilinguals. Specifically, we examine four regions on the Iberian Peninsula where Spanish is in contact with a regional language (Catalan, Galician, Valencian and Basque).
Our approach to copula contrast is different from previous work because we do not assess tokens as “(not) innovative”. Thus, we do not seek to assess whether or not estar is being used in “novel” contexts. Instead, we compare the frequency with which each copula is selected by different groups and the degree to which speakers within a single group respond unanimously, and we identify the linguistic factors that predict the selection of the copulas for each group. Our rationale for this approach is based on recent studies that have shown copula choice to be the result of multiple linguistic and extralinguistic factors, all of which simultaneously influence copula selection (Clements, Reference Clements, Clements and Yoon2005; Geeslin, Reference Geeslin2005; Salazar, Reference Salazar2007). Those influences can be described as separate independent variables and the categories of each variable can combine in (nearly) any combination. This means that a context can no longer be defined as a group of lexical items (sentence-level) because semantic and pragmatic factors are also at work (discourse-level). A context must therefore be described as the combination of categories of each variable. This means that methods of analysis based on frequency and predictors of selection are appropriate for the study of the copula contrast.
By collecting data from four contact situations and by using methods based on frequency and predictors of use, our study provides more information about several issues raised by previous research on language in contact. Firstly, we examine whether or not bilingualism with Spanish and another language necessarily leads to more frequent estar selection than is found in monolingual Spanish. Secondly, through an item analysis we investigate whether some groups exhibited greater or lesser degrees of variation (as indicated by the number of unanimous responses) and whether unanimous responses are linked to a given combination of linguistic features. Finally, by examining the linguistic predictors of estar in a single predictive model we assess the degree to which such predictors have consistent or different effects across groups. In contrasting our study with earlier research, we note that our participants have greater access to standard written Spanish and are speakers of languages that also possess a copula contrast. Our analyses provide greater detail of copula selection for each group and will enable us to broaden our understanding of the effects of bilingualism in general.
2. The research context
2.1 Copula choice
Spanish has two verbs that mean “to be” and each can be paired with adjectives depending on the context. The rules for selecting between ser “to be” and estar “to be” may occasionally be based on the adjective alone, as in (1) and (2), where ser and estar are obligatorily paired with china “Chinese” and descalzo “barefoot”, respectively.
(1)

“Magdalena is Chinese.”
(2)
“Mario is barefoot.”

Nevertheless, approximately eighty percent of all adjectives are grammatical with both ser and estar, and the additional linguistic and extralinguistic features of the context influence copula selection. For example, the features of the referent and of the adjective, and the relationship between the two, as well as the sentence-level and discourse-level context all influence copula choice (see section 3.3 for detail on these variables). This was described in the definition of “context” in the introduction and is shown in (3), where both copulas can appear with alegre “happy” depending on the speaker's intended meaning.
(3)
“The president is not happy (not a happy person/not in a happy mood).”
Given the sociolinguistic variation documented for Spanish, we begin our description of copulas in the four languages in contact with Spanish in our study by noting that we know of only one sociolinguistic study on this topic in any of those languages: Sanz and González (Reference Sanz and González1995) documented patterns of extension of the equivalent of estar in Catalan similar to those found by Silva-Corvalán (Reference Silva-Corvalán1986) for US Spanish. Aside from that study, little is known about copula contrast beyond what is found in traditional grammars. Those grammars tell us that a copula contrast similar to the one in Spanish exists in Basque, Galician, Catalan and Valencian (Vañó-Cerdá, Reference Vañó-Cerdá2002).Footnote 1 In other words, all four languages contain a dual-copula system in which both copulas are allowed into some [copula + adjective] structures. However, Hengeveld (Reference Hengeveld1991) notes that Catalan is more restricted in its use of predicate adjectives with estar, especially when the referent is inanimate. Examples (1)–(3) for Spanish are repeated below in (4)–(6) alongside examples from each of the contact languages relevant to the current study to demonstrate the similarities in copula contrast across all four. It will be recalled that the examples in (4) require ser or its equivalent, the examples in (5) require estar or its equivalent and the examples in (6) allow both copulas.
(4)
(5)
(6)
2.2 The extension of estar in contact situations
Although the extension of estar is found in texts dating back to the twelfth century (Vañó-Cerdá, Reference Vañó-Cerdá1982), one of the first sociolinguistic studies was conducted in Los Angeles with Mexican and Mexican-American speakers of Spanish (Silva-Corvalán, Reference Silva-Corvalán1986, Reference Silva-Corvalán1994). Silva-Corvalán (Reference Silva-Corvalán1986) analyzed interviews with 33 speakers in three generational groups: those born in Mexico, those born in the US to parents born in Mexico and those whose parents were born in the US. She showed that estar was being used in a wider range of contexts (i.e., less restricted use) across generations. Such research established that the extension of estar was accelerated in bilingual contexts where Spanish was in contact with English, and the many possible causes of such acceleration which we mentioned in the introduction resulted from this research.
To determine whether copula extension was also taking place in monolingual Spanish, Gutiérrez (Reference Gutiérrez1992) conducted an investigation in Michoacán, Mexico. Through an analysis of interviews and a fill-in questionnaire, he showed that the same changes found in bilingual Spanish were present in monolingual Spanish, where change was simply moving more slowly. An important factor in making this comparison was to control for social class in order to ensure that the monolingual and bilingual groups were comparable. Gutiérrez (Reference Gutiérrez2003) has also compared these findings to the Spanish spoken by Mexican Americans in Houston, Texas. He found similar changes in Houston and Los Angeles, thereby confirming earlier findings.
A more recent study on the extension of estar in Puerto Rican Spanish in contact with English was based on data from a written questionnaire completed by 122 participants and a conversation completed by 20 of those participants (Ortiz-López, Reference Ortiz-López2000). In addition to detailing the extension of estar in that variety of Spanish (e.g., with adjectives denoting age and size), Ortiz-López found that monolinguals in Puerto Rico, rather than bilinguals, used estar in a greater number of innovative contexts. He suggests that this is because bilingualism in Puerto Rico generally accompanies a higher level of formal education. Thus, this study found the opposite result for contact with English from that of Silva-Corvalán (Reference Silva-Corvalán1986) and Gutiérrez (Reference Gutiérrez2003), but the very same extralinguistic variable – level of education – may explain these opposing results.
The contrast between the outcomes of these studies raises several questions. Aside from our own work, and the early study by Sanz and González (Reference Sanz and González1995), research on the extension of estar and its relationship to bilingualism has been conducted exclusively in contexts where Spanish is in contact with English.Footnote 2 Silva-Corvalán (Reference Silva-Corvalán1994) suggests many potential reasons for the acceleration of this change in progress; from research to date, it is not clear whether the mere fact of being bilingual, features of the contact situation such as access to the written standard, or the relationship between English and Spanish are most relevant.
2.3 The extension of estar in Spain
Given the questions raised in the research cited, we investigated copula selection on the Iberian Peninsula. Our data were collected from monolingual Spanish speakers and from four groups of speakers in regions where Spanish is in contact with another language. Two of these groups have been described in earlier publications and a brief description of these findings is provided here in order to demonstrate the need for a single large-scale comparison across regions. More detail about the participants, the elicitation techniques, and analysis is provided in later sections. In Guijarro-Fuentes and Geeslin (Reference Guijarro-Fuentes and Geeslin2006a) we provide a preliminary analysis of data collected using a Contextualized Preference Task (CPT) from speakers in Galicia (N = 37), who favored Spanish or Galician to varying degrees, and from Spanish speakers in monolingual regions of Spain (N = 19). We found that speakers in Galicia selected estar significantly more often (48.7% of the time vs. 44.9%) than the monolingual group outside Galicia and, likewise, selected ser significantly less often than the monolingual comparison group (48.6% vs. 50%).Footnote 3 In addition, using regression analyses, we showed that the same linguistic variables (predicate type, susceptibility to change, adjective class, and copulas allowed) significantly predicted copula choice for the monolingual and bilingual groups. Finally, we found that the age of the participants and the first language (L1) of the participants' mother were significant predictors of copula choice but that these results were the consequence of small numbers of participants in some of the groups. Therefore, it was concluded that the linguistic variables were better predictors of estar and that the extralinguistic factors needed to be studied more closely.
In a follow-up study (Geeslin and Guijarro-Fuentes, Reference Geeslin and Guijarro-Fuentes2007a) we expanded the participant pool to include a larger and more diverse population so that we might further explore the role played by individual characteristics, such as language use profiles and language learning histories, in the frequency and prediction of estar selection. This second study included 73 speakers who varied in their degree of bilingualism in Galician and Spanish. As with our previous analysis of data from Galicia, we found that the same linguistic predictors of estar were significant. In addition to the two extralinguistic factors – age and the L1 of the participants' mother, which were significant in the first analysis – gender, occupation, and the language normally used by the participants were also significant. An analysis of copula selection within the categories of each of these variables showed that greater use of Galician was related to greater estar selection. For example, those who used Galician more at work or selected Galician as the language they normally used were more likely to select estar than other participants. Consequently, our findings are similar to those found for bilingual contexts where Spanish is in contact with English because estar was used more often among those with “less-monolingual” experience with Spanish. More frequent use of estar was not associated with lower levels of education, but our population was relatively well educated.
The second group from our larger corpus analyzed individually was comprised of 141 speakers from Catalonia (Guijarro-Fuentes and Geeslin, Reference Guijarro-Fuentes and Geeslin2006b). As with the Galicians, these speakers favored Catalan and Spanish to varying degrees. The frequency and predictors of estar selection were compared to those for an expanded monolingual group (N = 83). Unlike the Galicians, these speakers selected estar significantly less often than the monolinguals (43.8% vs. 44.9%) and ser significantly more often than the monolinguals (52.5% vs. 50%). As for the predictors of estar selection, while the linguistic variables predicate type, dependence on experience, susceptibility to change, adjective class, and copulas allowed were significant for both groups, animacy was also significant for the monolinguals but not for the Catalan group. Regarding extralinguistic variables, gender was a significant predictor of estar for both groups. Occupation, the participants' father's L1 and the language used for socializing were also significant predictors of estar for the Catalan bilinguals. In this regard, the Catalan group is similar to the Galician group in that the linguistic predictors of estar are similar to those of the monolingual groups, but additional extralinguistic factors were also identified that contribute to the prediction of copula choice. What is noticeably different is the fact that bilingualism appears to have the opposite effect in Catalonia from that reported in previous studies: bilingualism corresponds to less frequent estar selection. Clearly, further research on this population and on the effects of bilingualism in general is warranted.
3. The current study
The purpose of our large-scale project was to address estar selection in situations of language contact in Spain, extending the body of research on the topic beyond contact situations between Spanish and English. Our two preliminary reports cited above demonstrate that the issue of language contact and copula selection is quite complex. In the current study, we provide the first large-scale, multi-group comparison of copula selection in contact situations. We add two previously unanalyzed participant groups, those living in the Basque region and those living in the region of Valencia, and we compare four unique contact situations with each other and with a monolingual group. Our research was guided by the following questions:
1. How are copulas selected in each of the five regions?
a. With what frequency is estar selected?
b. To what degree are speakers within a single group unanimous in their estar selection? What are the characteristics of unanimous and variable items?
c. What are the linguistic predictors of estar?
2. Are there differences between the monolingual comparison group and each of the four bilingual groups?
3.1 Participants
Our investigation includes data from speakers in four bilingual regions of Spain: Galicia (N = 73), Valencia (N = 66), Catalonia (N = 141), and the Basque Country (N = 17). For the sake of comparison, we also include Spanish speakers living in regions that have only Spanish as their official language (N = 83).Footnote 4 Speakers in all five groups represent both genders and a wide range of age groups (15–79 years). In the entire sample, only one Valencian had not completed secondary education and a full two-thirds of the participants were in the process of completing or had completed some higher education. These speakers represent a range of language learning experiences and current patterns of language use. While some speakers were formally educated only in Spanish and reported nearly exclusive use of Spanish at the time of the study, others have more extensive experience with the regional language, including some who received all formal education in that language. These characteristics may be the result of changing government policies (e.g., in Galicia there has been a recent push to provide public education in Galician) or of individual circumstances (e.g., marriage to a speaker who is dominant in Valencian).
3.2 Data elicitation
Each participant completed a background questionnaire that elicited information about social characteristics, their language learning histories, and current patterns of language use. This instrument allowed us to include several individual characteristics in our analysis. Each participant also completed a CPT (see Appendix A). This task contains 28 items, each of which is preceded by a paragraph-length description of a context. The context allows for each item to be analyzed according to the discourse-level and sentence-level variables found to be useful in predicting copula choice (see section 3.3 below). The entire instrument reads as a single story. Each item takes the form of a question followed by two responses, differing only in the copula contained in each. The order in which ser and estar are presented in each sentence varies throughout the instrument. Participants select the sentence they prefer or indicate that they like both.
3.3 Coding and analysis
Each item on the CPT was analyzed as a single token, such that each participant supplied 28 tokens. The dependent variable was the copula selected: ser or estar, or both. The data were also coded for several independent variables, reflecting the discourse context and the background profile of each participant. The linguistic contextual variables used to code each token come from the literature devoted to describing the copula contrast. Within the generative theory, the variable identified as the best predictor of copula choice is predicate type. This variable distinguishes between stage-level predicates, which are limited in time, and individual-level predicates which have no such limit and, as such, apply to the individual as a whole (Carlson, Reference Carlson, Chierchia, Partee and Turner1989; Leonetti, Reference Leonetti1994; Fernández Leborans, Reference Fernández Leborans, Bosque and Demonte1999). This contrast is illustrated in (7) and (8) below.
(7)
Elena is (ser: 3sg) nice.fem
“Elena is nice.”
(8)
today Elena is (estar: 3sg) sick.fem
“Today, Elena is sick.”
We agree that this variable is relevant for the prediction of copula contrast but also acknowledge that there are several other factors that play a role in the copula contrast. For example, frame of reference, which indicates whether the referent is compared to itself at another point in time or to a group of like items (class frame of reference) also corresponds to copula choice (Falk, Reference Falk1979; Delbecque, Reference Delbecque, Cerspoor, Dong and Sweetser1997; Clements, Reference Clements1988, Reference Clements, Clements and Yoon2005). The individual (comparative) frame of reference is generally paired with estar whereas the class frame of reference appears with ser, as in (9) and (10).
(9)
det.masc boy.masc is (estar: 3sg)
alto. (individual frame)
tall.masc
“The boy is (has grown) tall.” [i.e., since the last time I saw him]
(10)
det.masc boy.masc is (ser: 3sg) tall.masc
“The boy is tall.”
To explain those contexts where surprise or direct contact with a referent leads the speaker to use estar, Guitart (Reference Guitart2002) employs a variable called “experience with the referent”. Returning to examples (9) and (10), a potential context for (9) might be a situation where a relative has not seen a young child for a while and remarks in surprise about how tall the child is. In example (10), the choice of ser is appropriate in contexts where the speaker has ongoing contact with the referent and describes the child as “tall” with respect to a class of children who possess the attribute of being tall. Experience with the referent and frame of reference provide two possible explanations for the contrast shown in (9) and (10). In the case where a context contains an individual frame of reference and the speaker has immediate contact with the referent, the choice of estar could be due to either one or both of these factors. A comparison with a case where the variables did not agree, such as an individual frame of reference with ongoing experience, would provide further information about the relative importance of each for a given speaker at a given moment in time. While the relationship between these two variables serves to illustrate the manner in which we analyze each context, there are more than just two factors that can influence copula choice and, thus, any context must be described in terms of all of the relevant variables and their relative strength of prediction to each other.
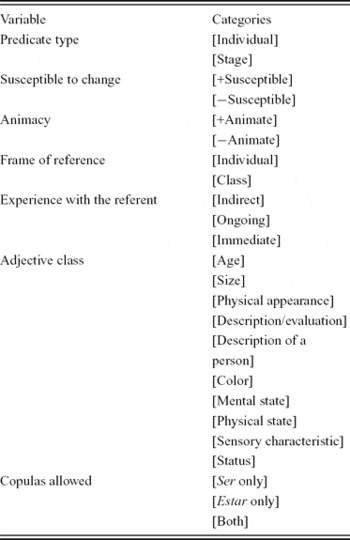
Several features of the referent and the adjective have also been shown to play a role in the selection between ser and estar. One such factor is whether or not the referent is animate. This variable explains differences such as describing the physical appearance of an object in contrast with that of a person (Clements, Reference Clements1988). In general, it is predicted that inanimate objects are more likely to appear with ser, but previous research has shown that this variable does not always yield consistent effects (Geeslin, Reference Geeslin2005). A variable that describes the relationship between the referent and the adjective is susceptibility to change. This variable has been widely used in sociolinguistic research (Silva-Corvalán, Reference Silva-Corvalán1986; Sanz and González, Reference Sanz and González1995) and distinguishes between characteristics that are changeable, such as the size of a child, and traits that are not, such as the size of a car. Finally, there are two variables that describe adjectives themselves. The first, adjective class, was identified as an exclusive predictor of the distribution of ser and estar in earlier accounts (Vaño-Cerdá, Reference Vañó-Cerdá1982) and has since been used in sociolinguistic research as one of the many factors predicting the extension of estar (Silva-Corvalán, Reference Silva-Corvalán1986; Gutiérrez, Reference Gutiérrez1992; Ortiz-López, Reference Ortiz-López2000). Examples of some of the categories of this variable are size, age, mental states, physical states, description of a person(ality), and description/evaluation (of objects). Our final variable, called copulas allowed, distinguishes those adjectives that regularly appear with both copulas from those that do not (Díaz-Campos and Geeslin, Reference Díaz-Campos and Geeslin2004; Geeslin, Reference Geeslin2005). This variable was designed to account for the examples in (1)–(3), given in our initial discussion of the copula contrast.Footnote 5 These variables are summarized in Table 1.
Summary of the linguistic variables.

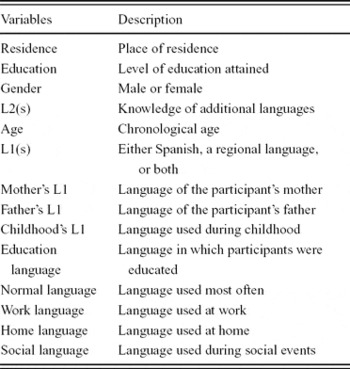
The extralinguistic variables included in the current study, shown in Table 2, are limited to those features that are measurable by self-report and include social variables, characteristics of language use, and language learning experiences. Although the variable occupation had been included in previous analyses, we chose not to include it in the current study because of the extremely high number of participants linked to academic settings in some way. The variable age was divided into categories in ten-year increments in order to capture the wide range of age groups.Footnote 6
Extralinguistic variables under investigation.

Three sets of analyses were performed, two accompanied by statistical tests, in order to address the research questions posed. First, a chi-square (χ2) test was used to determine whether the frequency of estar selection was different for each bilingual group as compared to the monolinguals. Secondly, a cross-tabulation of response type for each item was conducted for each population; this serves to identify those responses where members of a particular group are unanimous and those where variation within a single group occurs. These results were compared to the coding scheme for each item in order to assess the degree to which combinations of the categories of each variable were linked to unanimous or variable responses. Next, a binary logistic regression analysis was performed for each group. This test determines which factors (linguistic and/or extralinguistic) are the best predictors of estar selection when considered in a single model.
4. Results
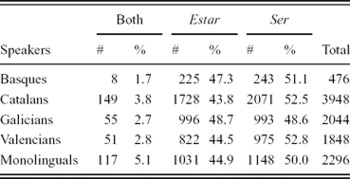
We begin this section with a summary of the results for frequency of selection for all three response choices for all five participant groups, shown in Table 3.
Summary of rates of estar selection.

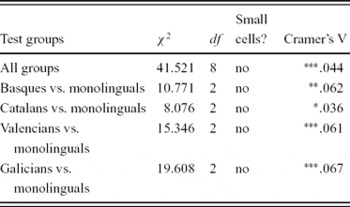
Given that each participant saw the same items on the CPT, there are noticeable differences in the frequencies with which each response type was selected. While speakers in Catalonia and Valencia had lower rates of estar selection than the monolinguals, the speakers from the Basque region and from Galicia showed higher rates of selection than the monolinguals. Several χ2 tests were run to determine whether these differences were statistically significant. First a test comparing all five groups to each other was run and, subsequently, individual tests comparing each group to the monolingual group were conducted. The results of this analysis are summarized in Table 4.Footnote 7 The table demonstrates that each participant group was significantly different from the monolingual comparison group. Even in cases where the difference appears to be relatively small, the large number of participants made such differences statistically significant.
Results of chi-square tests comparing participant groups.

*p < .05, **p < .01, ***p < .001.
A second way to describe copula choice is to identify those items where copula selection is unanimous and those where variation occurs. The number of unanimous items found for each group is important in demonstrating the degree to which variation in copula choice exists within a single community. Because we analyze each context as a group of linguistic factors, rather than a group of lexical items, the description of a context, unanimous or otherwise, will take the form of a combination of one category from each of the linguistic variables included in the study. By looking to see how the categories of these variables cluster in the unanimous items as compared to the variable ones, we can explore whether or not any combination of features guarantees the use of a single copula. Responses for all five groups by item and the linguistic features associated with each item eill be found in Appendix B.
In all groups, about half of the items produced nearly unanimous responses (i.e., fewer than 5% were different). There were 12 unanimous responses for the Basques, 17 for the Catalan group, 13 for the Galician group, 14 for the Valencian group, and 14 for the monolingual group. This result alone is important because it shows that all groups demonstrate variation in copula selection. In comparing results across groups, only four of the 28 items produced (nearly) unanimous estar responses for all groups and these items all contained stage-level predicates, an individual frame of reference and referent + adjective combinations that were susceptible to change. All but one referent was animate and all but one context denoted immediate experience with the referent. Two of the adjectives included tend to appear only with estar (enojado “angry” and acostumbrado “used to”) and two appear regularly with both copulas (frío “cold” and enfermo “sick”). Six of the 28 items produced (nearly) unanimous ser responses for all groups and all but one of these included individual-level predicates and class frames of reference. The experience with the referent was ongoing in four of the cases, the referent + adjective combination was not susceptible to change in four of the cases and the referent was animate in four of the cases (these characteristics do not all appear in the same four cases). The adjectives included in these items were evenly split between those that tend to appear with ser and those that appear regularly with both copular verbs. Thus, the unanimous responses do not correspond to a single combination of features.
In addition to the (nearly) unanimous responses, there were two additional items that elicited a unanimous estar response for at least one group. On item 4, for example, although only 77 percent of the Basques selected estar the other groups were nearly unanimous in their selection of estar. Like the unanimous items for estar for all groups, this item includes a stage-level predicate, an individual frame of reference and a referent + adjective combination that is susceptible to change, along with an adjective that regularly appears with either copular verb depending on contextual conditions. In contrast, another item (No. 27) contains a unanimous response for one group but not for the others; this item contains features generally associated with ser (individual-level predicate, class frame of reference, ongoing experience with the referent, etc.), but an adjective that generally only appears with estar. Again, it was the Basque group that differed from the others on this item, but in this case the Basques were unanimous in selecting estar while the others were not.
There were four items (11, 13, 17, 25) on which at least one group selected ser unanimously while other groups showed more variability. In examining the differences across groups, it is clear that no single group is responsible for this variation. Thus, while the Basque group was generally unlike the others on the two items for which estar was unanimous for one but not all groups, this was not the case for the corresponding items where a ser response was unanimous for at least one, but not all groups. In addition, the categories of the linguistic variables that comprise each of the contexts in these four items are equally represented and all but one of the adjectives regularly allow both copulas.
On the remaining twelve CPT items there was greater variation both within and between groups. This does not mean, however, that the differences across groups were necessarily large. For example, rates of estar selection on item 16 ranged from 81 percent to 90 percent. Thus, all groups demonstrated a preference for estar while also indicating that ser may be possible for some speakers. Item 16 contains several features that generally prompt estar, such as a stage-level predicate, an individual frame of reference, immediate experience with the referent and a referent + adjective combination that is susceptible to change. One reason this item may not be unanimous in estar-selection is that the adjective describes physical appearance for an inanimate referent.
Some items, however, such as 9, 14, 15, 26 and 28, demonstrate a wider range of responses across groups. On item 9, 47 percent of the Basque participants selected estar but no more than 12 percent of the participants in any other group selected estar. This item contains an individual-level predicate, a class frame of reference, both traditionally associated with ser and immediate experience with the referent and a referent + adjective combination that is susceptible to change, both of which are associated with estar. The adjective on item 9, which denotes age, can appear with either copula, but traditionally appeared with ser (see de Jonge, Reference de Jonge, Drijkoningen and Hengeveld1993). One feature that makes this item unique is that it contains an exclamation. This type of sentence is at the heart of Guitart's (Reference Guitart2002) “experience with the referent” variable, where immediate experience is indicated through the exclamation and is also what led Delbecque (Reference Delbecque, Cerspoor, Dong and Sweetser1997) to extend the comparative (individual) frame of reference to situations where a comparison is made between the referent and the speaker's preconceived expectations of that referent. In other words, the comparison is not necessarily between two points in time, but rather between one's expectations and what one actually finds in a given situation. It is interesting to compare this item with item 17, which elicited very low rates of estar from all groups, and which contains the very same features with the exception that item 17 presents ongoing experience with the referent, rather than immediate. If the fact that this item is not an exclamation is the source of these differences, this would highlight the importance of the “experience with the referent” variable. What we see in this case is that the Basque group responds to the immediate experience variable in combination with this set of linguistic features differently from the other groups.
The Basque responses were not always sharply different from the other groups. Item 28, for example, shows the Basque group selecting estar 71 percent of the time, which is higher than the rates of selection for the Valencian group (68%) and the monolingual group (59%) but lower than the Catalan (72%) and the Galician (84%) groups. What is interesting about this item in particular is that the Catalan and Galician groups both show higher rates of selection, even though in comparison to the monolinguals the Galicians selected estar with greater frequency overall and the Catalan group selected estar with lower frequency overall. Because this item includes an adjective that denotes physical appearance (delgado “thin”) it is interesting to compare the results to those for item 16, discussed earlier in this section. In contrast with item 16, item 28 contains mostly features that are associated with ser (individual-level predicate, class frame of reference, and ongoing experience with the referent), so aside from being an attribute that is susceptible to change, there are no contextual “triggers” for estar and this explains why the rates of selection of estar are lower for all groups than they were on item 16. Nevertheless, more than half of the speakers in all groups selected estar, demonstrating the widespread selection of estar with such adjectives even in contexts without the features associated with estar. One particularly interesting result for item 28 is that 59 percent of the monolingual participants selected estar, whereas the percentages for all bilingual groups were higher (Basque: 71%, Catalan: 72%, Galician: 84%, Valencian: 68%). This is one of only three items (see also 17 and 26) where the monolingual group demonstrates less frequent selection of estar than all bilingual groups.
While space limitations prevent an exhaustive discussion of each item, there are several general results we wish to highlight. Firstly, variability exists for all five groups and more items on the questionnaire produced variation than not. Secondly, there is no given variable or combination of variables that can predict the unanimous selection of estar or of ser even though certain categories of the linguistic variables are generally associated with the use of one copula or the other. In fact, even the groups of features most often associated with the unanimous responses also appear together in variable items (for example, the many stage-level predicates with individual frame of reference and adjectives that are susceptible to change in the items that elicited variable responses for all groups; see Appendix B). The implications of this analysis will be discussed in the next section.
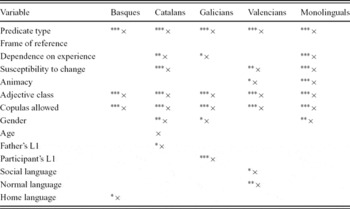
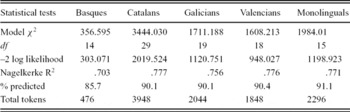
The third basis for comparison between groups is the identification of the linguistic variables predicting estar selection, using a regression analysis. Although extralinguistic variables were included in this analysis and are therefore reported, they are not the focus of the current paper. The results of these tests and their statistical details are summarized in Tables 5 and 6.
Results for regression analyses.

***p < .001, **p < .01, *p < .05.
Details of the regression analyses.

p < .001.
Table 5 shows that three linguistic predictors were the same for all groups: predicate type, adjective class, and copulas allowed. Additionally, susceptibility to change was a significant predictor of estar for the Catalans, Valencians and monolinguals, and dependence on experience was a significant predictor of estar selection for the Catalans, Galicians and monolinguals. Frame of reference was not a significant predictor for any group. This last result is due to the fact that the variable predicate type rarely is in conflict with frame of reference so both are not needed in the same regression equation. The smaller number of factors found to be significant for the Basque group is likely due to the inclusion of fewer participants in that group (N = 17). Our previous research shows that factors like dependence on experience are only significant with a large number of tokens (Geeslin and Guijarro-Fuentes, Reference Geeslin and Guijarro-Fuentes2007a). What is perhaps most striking is that, with the exception of the frame of reference variable, all linguistic factors were significant predictors of estar for the monolinguals but not for all other groups.
Although the focus of this paper is the linguistic predictors of estar, there is one additional result that is relevant to the discussion that follows.Footnote 8 For the Galician group, the variable L1 of the participant was a significant predictor of estar selection. This variable distinguishes between those who describe themselves to be bilingual, dominant in one language or the other, or L1 speakers of one language and L2 learners of the other. In the order from those who most favor Galician to those who most favor Spanish, the groups and their percentage of estar selection are: Galician speakers (52.4%), Galician speakers with Spanish as an L2 (56.8%), bilinguals who favor Galician (50.3%), bilinguals who favor Spanish (50.7%), and Spanish speakers (50.9%). These ratings reflect speakers' perception of their competence in both languages. The entire research study was carried out in Spanish, so no group was monolingual in Galician. The results indicate a tendency among those who speak more Galician to select estar at higher rates in Spanish.
5. Discussion
Our first research question asked how copulas were selected in each of the five regions, and the second sought to compare each bilingual group to the others and to the monolingual comparison group. Three different types of comparisons were made across groups. Firstly, rates of selection of estar were calculated for each group. It was found that there were significant differences in frequency of selection of estar between each of the bilingual groups and the monolingual comparison group, but the direction of these differences was not the same for all groups. The Basque and Galician groups selected estar with greater frequency than the monolingual group whereas the Catalan and Valencian groups selected estar less often. Thus, bilingualism does not have the uniform effect of increasing the frequency with which estar is selected. Because previous research has indicated that the extension of estar is an internally-motivated process of simplification, we would expect that simplification would lead to greater use of estar for all groups. Thus, the hypothesis that the cognitive demands of bilingualism alone lead to simplification of the copular system in Spanish as demonstrated by increased use of estar is not supported by all contact situations.
We also compared copula selection across groups to examine the degree to which responses were unanimous or variable on each item on the CPT. We found that each group, including the monolinguals, demonstrated variability on about half of the CPT items. In looking at unanimous responses, we found that there were only 10 items that received nearly unanimous responses for all groups, four for estar and six for ser. An analysis of the characteristics of these items showed that while stage-level predicates, individual frames of reference, characteristics that were susceptible to change and immediate experience with the referent were often associated with use of estar, no single variable or combination of variables guaranteed a unanimous response. Because variation occurs in the monolingual group, just as it does in the other groups, we can conclude that bilingualism is not the only source of variable rates of copula selection.
Finally, we compared copula selection across groups to determine the best predictors of estar selection. The linguistic variables predicate type, adjective class and copulas allowed were highly significant predictors for all groups. As with previous research, animacy seems to have irregular effects across groups and dependence on experience appears to be linked to the size of the participant group where larger groups show a statistically significant effect and smaller groups do not. The grammatical similarities across groups are demonstrated by the fact that many of the same linguistic predictors were significant for four contact varieties of Spanish and the monolingual group. Even though the rates of selection of estar are quite variable, what we know from this last comparison is that speakers are responding to the same linguistic features, they are simply doing so to differing degrees. A study that merely examined rates of selection of estar would miss this insight. This result is similar to Cameron's (Reference Cameron1993, Reference Cameron1995) findings for subject expression in Puerto Rican and Madrid Spanish. Although these two populations showed different frequencies of overt subject expression, the relative importance of linguistic predictors such as switch reference and verbal morphology was the same. The consistency demonstrated across varieties using this methodology and the ability to connect it to research on other linguistic structures are both benefits of defining context as the sum of the categories of several predictive variables.
It was suggested that this project would enable us to connect our findings to previous research claiming that more frequent use of estar among bilinguals might be related to lack of access to the formal written standard or to specific features of the languages in contact with Spanish. All of our participants were literate in Spanish and a full two-thirds had or were completing higher education. Thus, it is not likely that the differing frequencies across groups are a result of differing levels of access to the formal written standard. Nevertheless, in Galicia a tendency on the part of the participants to favor Galician is associated with higher rates of estar selection. Interestingly, the group that showed the greatest difference from the monolinguals, the Galician group, was also the group for whom language dominance was most important. Thus, although all of the Galician participants likely had access to the written standard (all had completed secondary education) the degree to which they felt comfortable in Spanish was related to copula selection. Although we cannot directly corroborate Ortiz-López's (Reference Ortiz-López2000) assertion that level of education is related to copula choice, we have shown that one facet of language learning experience (i.e., the depth of knowledge of Spanish and the contact language) is relevant.
It has also been hypothesized that the existence of a parallel structure in the contact language, such as the dual-copula contrast found in all four of our contact languages, might increase the pace of language change (Silva-Corvalán, Reference Silva-Corvalán1994). The trouble in identifying this influence is that there are no sociolinguistic studies on these other languages that are comparable to the current one that would demonstrate whether there is an increased use of estar in adjectival contexts as compared to Spanish. Thus, precisely the type of information we need to determine the effect of the contact language on Spanish is unavailable. As a result, we take this opportunity to hypothesize about those other languages so that future studies might confirm these ideas with sociolinguistic research conducted in the contact languages themselves.
Of the four contact languages included in our study, only research on Catalan (Sanz and González, Reference Sanz and González1995) has demonstrated a process of extension of estar similar to that in Spanish. Even so, Hengeveld (Reference Hengeveld1991) describes Catalan as being more restricted in its use of estar with predicate adjectives. Taking Hengeveld's insight in combination with the finding that our Catalan–Spanish bilinguals showed lower frequencies of selection of estar than the monolingual group, we can hypothesize that if language contact is indeed responsible for our finding, the extension of estar is moving more slowly in Catalan and consequently, bilingualism in Spanish and Catalan has the effect of slowing the extension of estar in Spanish. Given the statistically identical frequencies of selection for Valencian and Catalan, we extend this hypothesis to Valencian as well.
In contrast with the Catalan and Valencian group, the rates of selection of estar were highest for the Galician group. Recent sociolinguistic research in Galicia has identified a movement that favors a standard Galician based on Portuguese, rather than Spanish, thereby allowing speakers to distinguish Galician further from Spanish (Loureiro-Rodríguez, Reference Loureiro-Rodríguez2007). Although research on copula selection in Galician is unavailable, we do know that native speakers of Portuguese select estar more often on a translated version of this very same instrument (Geeslin and Guijarro-Fuentes, Reference Geeslin and Guijarro-Fuentes2006). Given these facts, we hypothesize that if language contact is responsible for our findings, the use of estar is more frequent in Galician than it is in Spanish, thus favoring a higher rate of use of estar in Spanish by Galician–Spanish bilinguals.
Finally, the Basque group selected estar more often than the monolingual group but less often than the Galician group. Thus, contact with a typologically dissimilar language does not appear to lead to higher or lower rates of estar selection than contact with a similar one. In examining the rates of estar selection on individual items, the Basque group did pattern quite differently from the other groups on two items (4 and 27), but more frequently the Basques demonstrated similar rates of selection to the other groups. In addition, the variables predicate type, adjective class and copulas allowed were significant predictors of estar selection, just as they were for other groups. If our hypotheses about rates of estar selection in Galician, Catalan and Valencian are accurate, and influence of the contact language on Spanish is indeed at least one source of the differences found for each group, we would hypothesize that the effect of Basque on bilingual Spanish is similar. Thus, we would expect to find similar predictors of estar selection and higher rates of use of estar in Basque than in Spanish. Our hypotheses for Basque are more tentative than for the other contact languages because we do not have information about language attitudes or language change in Basque to corroborate these predictions and because the results for contact with English, also typologically dissimilar, do not provide direct evidence of effects on Spanish by the contact language (i.e., increased knowledge of English accelerated language change in Los Angeles and slowed change in Puerto Rico; cf. Silva-Corvalán, Reference Silva-Corvalán1994; Ortiz López, Reference Ortiz-López2000).
6. Conclusions and directions for future research
The goal of the current paper was to explore copula choice in Spanish in contact with four regional languages. We have shown that while some bilingual populations select estar more frequently than monolingual Spanish speakers, others select estar less frequently. Thus, bilingualism does not categorically lead to simplification in the form of more frequent use of estar. Likewise, we have demonstrated that all groups exhibit similar degrees of variation when the number of unanimous responses is considered. Furthermore, we have demonstrated that no single variable or combination of variables can distinguish variable contexts from categorical ones. This means that additional factors, or simply individual variation, are likely relevant in further predicting copula selection. Finally, we have shown that the linguistic predictors of copula choice are relatively stable across populations, even though the frequency of selection of these copulas varies.
While much greater generalizability has been gained through our research, which included four new contact languages and participants that were relatively well educated, there is still work to be done. We recognize the need for extensive research into copula selection in each of the languages with which Spanish is in contact in our study so that more might be known about the relationship of one language to the other. In contrast with the many future projects that are possible, however, we hope to have demonstrated the benefits of analyzing contexts for copula contrast as a combination of the categories of several linguistic variables such that future research in Spanish as well as contact languages might also measure frequency, degree of unanimity, and the predictors of copula choice.
Appendix A. Translation of questionnaire (originally in Spanish)
Note: All responses appeared twice, once with ser and once with estar, and participants indicated preference for one or the other or both.
1. Paula and Raúl are planning to go out to dinner. Paula is yelling from the bedroom while she gets ready in order to make plans with Raúl. As she comes out of her room she asks:
Paula: Do you want to go in my car?
Raúl: ¡Ay! ¡Qué bonita estás / eres! [How pretty you are!]
2. Paula says thank you and asks if their friend Pablo will be joining them for dinner. Paula wants to talk to him about their math class. Raúl says that Pablo isn't coming and Paula wants to know why:
Paula: Why isn't Pablo coming?
Raúl: Porque no le llamé antes y ahora está / es enojado. [Because I didn't call him and now he is mad.]
3. Paula is surprised by this since Raúl and Alejandro are good friends. Paula knows that Raúl intended to call Pablo and she asks what happened:
Paula: Why didn't you call your best friend?
Raúl: Porque este año no es / está amable conmigo. [Because this year he isn't friendly to me.]
4. Paula is curious because Raúl does not seem too upset by Pablo's behavior. Paula wants to know if Alejandro usually acts this way:
Paula: Does Pablo act like this often?
Raúl: No, me trata bien cuando está / es alegre. [No, he treats me well when he is happy.]
5. Paula and Raúl leave the apartment and go to a local restaurant. They eat there frequently and the people who work there are always very nice. This time, Raúl has ordered something new on the menu and Paula is curious about what Raúl thinks of the food:
Paula: Raúl, do you like your food?
Raúl: Sí, la cena es / está buena. [Yes, dinner is good.]
6. During the meal, Paula and Raúl have a chance to talk about some of the things that have been going on in their lives. They both like the apartment they live in but since the rent is so high they've been discussing moving to another place. Paula wants to know how Raúl feels about the apartment:
Paula: Do you like our apartment?
Raúl: Sí, nuestro apartamento es / está grande. [Yes, our apartment is very big.]
7. Paula would like to live close to the university. She asks Raúl about an apartment they visited yesterday:
Paula: What do you think of the apartment we saw yesterday?
Raúl: No me gustó el dueño del apartamento, está / es desagradable. [I didn't like the owner of the apartment, he is unpleasant.]
8. Paula agrees and she also reacted poorly to the owner. She doesn't understand why the owner treated them badly.
Paula: Do you think that he treated us poorly because of our lack of money?
Raúl: No, no somos / estamos pobres. [No, we're not poor.]
9. Raúl thinks the owner treated them badly because of their age. Paula does not agree and explains to him that she doesn't look as young because she is a few years older than other students.
Paula: It can't be because of that, I'm going to be 23 tomorrow.
Raúl: Ah, ¡qué vieja estás / eres! [Oh, how old you are!]
10. Paula knows that Raúl is doing poorly in school. Raúl's father is working very hard to pay for school and Raúl is afraid to tell him how he's doing. Paula wonders if he can keep his grades a secret:
Paula: Do you have to talk with your father?
Raúl: Sí, claro, mi papá no está / es estúpido. [Yes, of course, my father isn't stupid.]
11. Paula questions Raúl further about what is causing him to do poorly in school:
Paula: Raúl, Why are you getting such bad grades?
Raúl: Mis profesores dicen que en comparación con el año pasado mis ensayos son / están peores. [My professors say that in comparison with last year my essays are bad.]
12. Paula has a theory about the difficulties Raúl has this year. She suggests that it might be difficult for him to adapt to the new professors.
Paula: Do you think the difficulties result from the change in format of the class:
Raúl: No, soy / estoy acostumbrado a la metodología. [No, I am used to the methodology.]
13. Paula and Raúl have been having trouble coordinating their schedules. Since only Paula has a car, Raúl has to know which days he has to take the bus. During the day, Paula has come up with a suggestion that will save him some bus fare:
Paula: You can come with me in the morning and go with Juan in the afternoon.
Raúl: ¡Ay! ¡Qué inteligente estás / eres! [How intelligent you are!]
14. Even though Raúl likes Paula's idea she realizes there might be a problem. Sometimes Juan has trouble with the police because he drives too fast. Raúl says he doesn't mind that but he does mind Juan's way of dressing. Paula is curious about what he means:
Paula: Why don't you like his way of dressing?
Raúl: ¡Esta semana su pelo es / está azul! [This week his hair is blue!]
15. This comment seems funny to Paula. She didn't know that Raúl had such traditional ideas. She shows him her fingernails, which she just painted.
Paula: Well then, what do you think of my fingernails?
Raúl: ¡Las uñas están / son azules también! [Your fingernails are blue too!]
16. Paula sees that Raúl doesn't react as strongly as she expected. She decides to ask him again what he thinks about her fingernails.
Paula: Seriously Raúl, what do you think about my fingernails?
Raúl: La verdad es que hoy tus uñas son / están bonitas. [The truth is that today your fingernails are pretty.]
17. Paula and Raúl also get a chance to catch up on the events of the day. Raúl mentions that his sister called and said she might like to come visit and stay at the apartment for a while. Paula didn't know Raúl had a sister so she asks how old she is:
Paula: How old is your sister?
Raúl: Como nosotros, ella está / es bastante joven. [Like us, she is young.]
18. Paula recalls that Raúl did not have class today. Since she can't remember why she asks him:
Paula: Raúl, Why aren't you going to science class today?
Raúl: Porque el profesor es / está enfermo. [Because the professor is sick.]
19. During dinner Raúl notices that Paula looks a bit different. Paula sees him looking at her and asks what is wrong:
Paula: Raúl, What's bothering you?
Raúl: No sé por qué, pero tus ojos son / están azules esta noche. [I don't know why, but your eyes are blue tonight.]
20. Paula tells Raúl that she thought he had just noticed that her boyfriend had just given her a new ring. She is very proud and she shows it to Raúl:
Paula: What do you think of my new ring?
Raúl: ¡Qué bonito está / es! [How beautiful it is!]
21. Since Raúl is curious about Paula's boyfriend, they discuss the possibility of a wedding. Paula is not sure about marrying her boyfriend because she is Catholic and her boyfriend is Protestant. She knows Raúl had a friend who married a man with a different religion and she asks what happened with her:
Paula: What religion does your friend practice now?
Raúl: Ahora ella es / está católica también. [Now she is Catholic too.]
22. As the waiter is clearing the plates, Paula notices that Raúl has not touched his soup. Since Raúl always eats everything he orders, Paula is curious:
Paula: Raúl, Why aren't you eating your soup?
Raúl: La sopa es / está muy fría. [The soup is cold.]
23. Paula laughs because Raúl had ordered Gazpacho and it is supposed to be cold. She asks again what is wrong:
Paula: Why aren't you eating the soup?
Raúl: Los tomates están / son verdes. [The tomatoes are unripe.]
24. Paula just got a new job at the university. When the bill comes, Raúl says she should pay for dinner. Paula objects:
Paula: Why do you think I should pay the bill?
Raúl: Porque ahora estás / eres rica. [Because now you are rich.]
25. Leaving the restaurant, Paula and Raúl run into four friends on their way to a movie. They ask Paula and Raúl to give them a ride. The car is very crowded and Paula says:
Paula: There are a lot of people in my car.
Raúl: Sí, ahora tu coche no es / está muy grande. [Yes, now your car is not very big.]
26. After saying good-bye to their friends at the movie theater, Raúl tells Paula he is glad she did not agree to go with their friends to see the film. Paula asks Raúl why he didn't want to go and Raúl explains that he does not like Alicia:
Paula: Why don't you get along with Alicia?
Raúl: Alicia está / es muy triste. [Alicia is very sad.]
27. Paula tells Raúl that his reaction surprises her. She didn't realize he had already met Alicia. Raúl starts to laugh at Paula because Paula has not realized that Alicia and Raúl are from the same hometown. Paula doesn't understand:
Paula: Why are you laughing?
Raúl: ¡Nunca eres / estás despierta! [You are never aware of things!]
28. Paula and Raúl arrive at the apartment again. Paula comments that she ate a lot and she will have to eat less tomorrow.
Paula: I ate so much that I am going to start to gain weight.
Raúl: Pero Paula, tú estás / eres muy delgada. [But Paula, you are so thin.]