Introduction
Limitation in autografts and allografts has triggered the use of synthetic biomaterials as a bone substitute by virtue of using it as part of tissue-engineered scaffold [Reference Wei and Ma1]. The successful engineering of damaged bone tissue depends on control of interactions between cells and scaffolds. That is why properties of developed scaffolds will ultimately govern the desirable cell response.
Bone tissue engineering has primarily been focussing on the use of bio-ceramics and biopolymers to prepare ideal scaffold to facilitate bone healing at the damaged or diseased site [Reference Suchanek and Yoshimura2]. Bone is composed of hierarchial arrangement of collagen fibril embedded with nano HAp crystals, giving a significantly porous architecture [Reference Groeneveld, van den Bergh, Holzmann, ten Bruggenkate, Tuinzing and Burger3, Reference Meinel, Karageorgiou, Fajardo, Snyder, Shinde-Patil, Zichner, Kaplan, Langer and Vunjak-Novakovic4]. Thus, combination of biopolymer matrix and nano-bioceramics particles can ideally mimic the extracellular matrix (ECM) of bone. The nature of biomaterial and fabrication processes can influence the properties of prepared scaffold [Reference Mitragotri and Lahann5]. Nature of biomaterials has been extensively studied in different forms such as metal, ceramics, glass, chemically synthesized polymer, and composites in combination of these [Reference Williams6].
Among the bone substitute materials, calcium phosphate-based ceramics occupy a special position because of their excellent bioactivity, bio-resorbability and osteoconductivity [Reference Samavedi, Whittington and Goldstein7]. HAp has been extensively studied as a bone substitute material because of its excellent bioactivity and osteoconductivity and sometimes reported to induce differentiation of osteoblast [Reference Tsuruga, Takita, Itoh, Wakisaka and Kuboki8]. Sintered HAp with stoichiometric composition possesses high crystallinity in contrast to biological apatite which is generally calcium (Ca2+) deficient in nature. As a result, the in vivo resorption rate for synthetic HAp is longer than most of other Ca-orthophosphates. On the other hand, β-TCP has been found to be resorbable and possess osteoconductivity suitable for its application as bone void filler in orthopedic and dental application. Similarly, 58 s bioactive glass has attracted much attention as bone substitute material because of its enhanced bioactivity and resorbability. The better in vivo biomineralization ability of 58 s bioactive glass has further promoted its use in bone tissue engineering (BTE) application [Reference Bielby, Pryce, Hench and Polak9].
On the other hand, natural polymer has found widespread application in BTE because of its excellent bio-activity and nonimmunogenicity [Reference Rezwan, Chen, Blaker and Boccaccini10, Reference Sionkowska11]. Gelatin, the partially hydrolyzed product of collagen is a viable candidate to construct bone scaffold. Unlike collagen, it is soluble in water and ideally be processed in aqueous environment to prepare porous 3D bone scaffold through lyophilization or freeze-drying. Chitosan has found widespread application in BTE because of its wound healing and antimicrobial property. It can mimic the structure of glycosaminoglycans (GAGs) in bone ECM, which provides spongyness and shock-absorbing capacity to the developed bone [Reference Suh and Matthew12, Reference Chandy and Sharma13]. A wide variety of gelatin-based composites has already been developed for application in BTE, such as β-TCP/chitosan/gelatin [Reference Yin, Ye, Cui, Zhang, Li and Yao14], chitosan–gelatin–alginate–hydroxyapatite [Reference Sharma, Dinda, Potdar, Chou and Mishra15, Reference Kim, Kim and Salih16], gelatin–chitosan–nanobioglass [Reference Maji, Dasgupta, Pramanik and Bissoyi17] and hybrid macroporous gelatin/bioactive-glass/nanosilver scaffolds [Reference Yazdimamaghani, Vashaee, Assefa, Walker, Madihally, Köhler and Tayebi18, Reference Peter, Binulal, Nair, Selvamurugan, Tamura and Jayakumar19, Reference Mozafari, Rabiee, Azami and Maleknia20].
Here, we have chosen a combination of chitosan–gelatin (GC) as matrix phase in the scaffold, where three different mineral phases such as HAp, β-TCP and 58 s bioactive glass in nanoparticulate form were uniformly dispersed. Depending on the bioceramic phase in GC matrix, the mineralization behavior of the scaffold to regenerate bone extracellular matrix under physiological condition may vary and ultimately govern differentiation of stem cell or osteoprogenitor cell into bone lining matured osteoblast cell to regenerate new bone tissue. Thus, the nature of bioceramic phase may play a role in controlling osteogenic potential of the prepared scaffold materials. The objective of the study was to find the effect of 58 s bioactive glass, β-TCP and HAp on mesenchyma stem cell’s (MSC’s) adhesion, proliferation and differentiation into osteoblast. In addition to its bioactivity, psychochemical and mechanical properties of prepared scaffolds were also studied with variation in mineral phases such as 58 s bioactive glass, β-TCP and HAp.
Physicochemical and biological characterization
Studies on microstructure and chemical composition
The phase composition of the as-developed GCH30, GCB30, and GCT30 scaffolds was investigated by X-ray diffraction analysis (Panalytical, Malvern Panalytical Ltd., Royston, U.K.) in the 2θ range of 20–60° at a scan rate of 0.02°, operated at 40 kV and 40 mA using Cu Kα radiation. The functional groups present in the scaffolds were identified by an attenuated total reflectance Fourier transform infrared (ATR-FTIR) spectrometer (PerkinElmer Spectrum, PerkinElmer, Inc., Waltham, Massachusetts). The spectra in the range of 600–4000 cm−1 were collected in 16 scans at 4 cm−1 resolution. Microstructure of the fabricated GCH30, GCB30, and GCT30 scaffolds was observed by a Field emission scanning electron microscope (FEI Nova Nano, Hillsboro, Oregon, Nederland) operated at an accelerating voltage of 15 kV.
Micro-architectural analysis of composite scaffold
A custom-built micro-computed tomography (micro-CT) was used, as described previously [Reference Agrawal, Singh, Kashyap, Shukla, Sarkar and Sinha21]. The detector was placed 450 mm away from the sample stage. The sample was rotated in steps of (0.2) and was exposed to a beam energy (E = 28 keV) for a duration of 5 s for all the samples. The scanned images were acquired at a pixel size of 11.4 μm for approximately 20 min and 900 2-D images were recorded for each sample. The images of 3D microstructures were produced with suitable software. The pore size, porosity, total volume, and density of the scaffolds were measured.
Degradation of scaffolds
Degradability of GCH30, GCB30, and GCT30 scaffolds was studied from weight loss after placing them in phosphate buffer saline (PBS) at 37 °C for up to 28 days. Scaffolds were immersed in 100 mL PBS buffer solution that was changed after every 3 days interval without disturbing the scaffold [Reference Huang, Onyeri, Siewe, Moshfeghian and Madihally22].
BSA protein adsorption on GCH30, GCB30, and GCT30 composite scaffold
Bovine serum albumin (BSA) was used as a model protein for studying efficacy of the prepared scaffolds to adsorb protein. The amount of adsorbed protein on the scaffolds was determined with the help of Bicinchoninic acid (BCA) assay kits. Small pieces of composite scaffolds of 12 mm in height and 5 mm in diameter were sliced down by steel blade and immersed in 10 mL BSA solution having 5 mg/mL of initial concentration and placed in an incubator at 37 °C for different time intervals from 6 to 144 h. The supernatant solutions were collected after centrifugation of individual solution at 1000 rpm at room temperature. 0.1 mL of supernatant solution from each specimen was taken and mixed with 2 mL of BCA solution (Thermo Pierce, Bicinchoninic acid protein assay kit, Pierce Biotechnology, Rockford, Illinois) to determine protein concentration in the supernatant, and thus after subtracting from initial protein concentration, the adsorbed amount of BSA onto the scaffolds was determined. The absorbance peak and hence the protein concentration in the supernatant from predetermined standard BSA concentration versus intensity calibration curve was measured with the help of UV-vis spectrophotometer (PerkinElmer, Lambada 35, PerkinElmer, Inc., Waltham, Massachusetts) at 562 nm. The estimated concentrations of protein were the average of protein concentrations from three wells of different samples from the same scaffold.
In vitro cell culture
Human umbilical cord blood (UCB)-derived MSCs were supplied by Department of Biotechnology and Biomedical science, NIT Rourkela [Reference Bissoyi and Pramanik23] after approval by the Institutional Ethical Board of National Institute of Technology, Rourkela, India. Prior to cell seeding, scaffolds were sterilized by soaking in 70% ethanol and 10 U/mL penicillin solution for 2 h followed by washing with phosphate buffer solution (PBS). Cell seeding was performed on sterilized scaffolds after 4th passage with a seeding density of 5 × 10⁶ cells/mL by static method. Mesenchymal stem cells (MSCs) were cultured and grown for up to 14 days in a Dulbecco’s modified Eagle’s medium (DMEM; Sigma-Aldrich, U.K.) supplemented with 10% fetal bovine serum (FBS; Sigma-Aldrich, U.K.) and 100 U/mL penicillin–streptomycin.
Proliferation assays
Viability of MSCs cultured onto the GCH30, GCB30, and GCT30 were determined after performing [3-(4,5-dimethylthiazol-2-yl)-2,5-diphenyltetrazolium bromide] (MTT) assay with the MSCs. After definite cell culture period, fresh media was supplemented to the cells consisting of 100 μL MTT solution (diluted in 1:10 PBS) followed by incubation of the cells at 37 °C for 4 h. DMSO to the extent of 0.5 mL was added to the incubated cells to solubilize formazan crystals followed by centrifugation of the solution at 1000 rpm for 5 min. The optical density (O.D) of intense pink-colored formazan derivative was measured using a spectrophotometric plate reader (2030 multi label reader Victor X3, PerklinElmer) at 595 nm.
Expression of osteogenic specific genes
Semiquantitative RT-PCR was carried out to assess the expression of osteoblast-related markers at mRNA level for cells cultured up to 14 days. Table SI shows the primer sequences used for the study. For RT-PCR analysis, total cellular RNA from osteoblasts, differentiated from hMSCs, was extracted by TRIzol. cDNA synthesis was carried out using first strand cDNA synthesis kit following the manufacturer’s protocol. The synthesized cDNA was used as a template for the semiquantitative RT-PCR following the procedure described elsewhere [Reference Marone, Mozzetti, de Ritis, Pierelli and Scambia24]. For normalizing mRNA level of Col-1, RUNX2, OCN, OPN gene, the GAPDH gene was used as a housekeeping gene. The PCR reaction mixture consisted of 1× PCR buffer, 50 mM MgCl2, 10 mM dNTPs, 0.2 μM of each primer, 1 U Taq polymerase and autoclaved water. PCR chain reactions were carried out at 94 °C for 2 min, 35 cycles at 96 °C for 30 s, 55–63 °C for 45 s, and 72 °C for 45 s and 72 °C for 10 min. Finally, the PCR products, amplified DNA fragments, were subjected to electrophoresis (BioRad, Hercules, California) on 1.5% agarose gel and the band intensity was analyzed using ImageJ software (National Institute of Mental Health, Bethesda, Maryland) for evaluating the relative expression of selected genes.
Statistical analysis
All data were represented as a mean ± standard deviation and statistical analysis was carried out using one-way ANOVA with 95% confidence interval. Post hoc analysis was performed using Tukey’s pairwise comparison method between two concerned groups. All the data with P < 0.05 were considered statistically significant.
Results and discussion
X-ray diffraction analysis
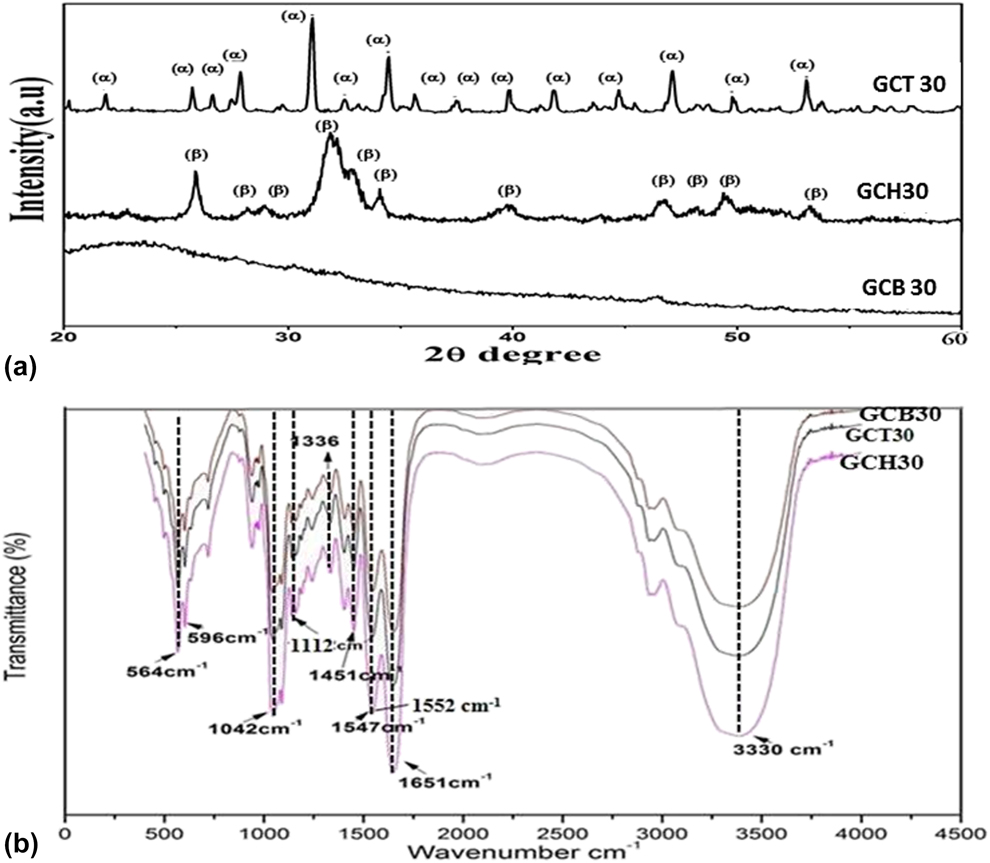
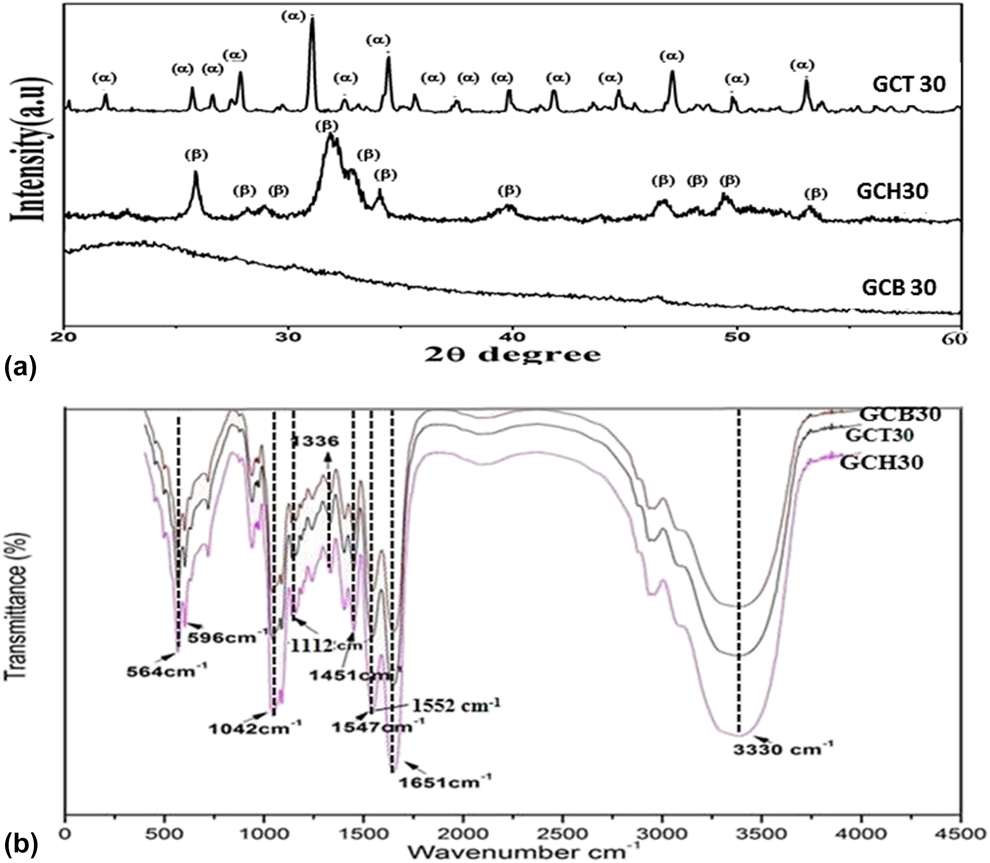
Figure 1(a) shows XRD analysis of the prepared scaffold to identify different phases present in the scaffold. The semi crystalline peaks of gelatin and chitosan in all the scaffolds were subdued due to predominant signals coming from nano bioceramic crystalline phases. Sharp peaks of (002) and (112) plane of HAp was observed in GCH30 scaffold. GCT30 showed only the characteristic peaks of β-TCP with no other calcium phosphate (CaP) phases, indicating that the synthesized powder was phase pure β-TCP. On the other hand, GCB30 was marked by broad amorphous hump of 58 s bioactive glass due to the predominant amorphous nature of the ceramic phase. In all the prepared scaffolds, characteristic diffraction peaks due to the presence of respective bio-ceramic phases were observed, which suggest that during processing of the scaffolds, no phase change occurred in the respective ceramic phase.
(a) XRD pattern of GCB30, GCT30, and GCH30 scaffold prepared using freeze-drying technique. (b) FTIR-ATR analysis of GCB30, GCT30, and GCH30 scaffold, analyzed in the 500–4000 cm−1 regions.
FTIR analysis
FTIR spectra of GCB30, GCT30, and GCH30 scaffolds are shown in Fig. 1(b), from which different functional groups present in prepared scaffolds could be determined. Peaks at 564 and 594 cm−1 were assigned to phosphate stretching and 1042 cm−1, 1112 cm−1 were ascribed to phosphate bending vibration, that was present in the bio-ceramic phase present in all the composite scaffold [Reference Raynaud, Champion, Bernache-Assollant and Thomas25]. Bands at 1336 cm−1 were attributed to Ca2+–COO− electrostatic interaction through which nanoparticles of bio-ceramic phases were anchored to biopolymer matrix of gelatin [Reference Maji, Dasgupta, Kundu and Bissoyi26]. The presence of C=O stretching vibration due to secondary amide in chitosan was detected at 1451 cm−1 [Reference Toledo, Bellato, Souza, Domingues, dSilva, Reis, Maurício and Fontes27]. The red shift in amide II from 1558 to 1547 cm−1 in gelatin in all prepared scaffold was due to electrostatic interaction between gelatin and other bio-ceramic phase. Similar red shift in amide I (C–O) vibration was observed in appearance of 1664 cm−1 band at 1651 cm−1 in gelatin. The presence of C=N bond at 1652 cm−1 was merged with amide I stretching vibration in gelatin in all the scaffolds, which detects successful crosslinking between intergelatin and gelatin–chitosan using glutaraldehyde as crosslinking agent [Reference Maji, Dasgupta, Pramanik and Bissoyi17]. The presence of labile –OH group in chitosan was detected in all scaffolds from band at 3330 cm−1. The intensity of the band was higher in GCH30 because of the presence of –OH of HAp along with that of chitosan.
SEM analysis of GCH30, GCB30, and GCT30 composite scaffold
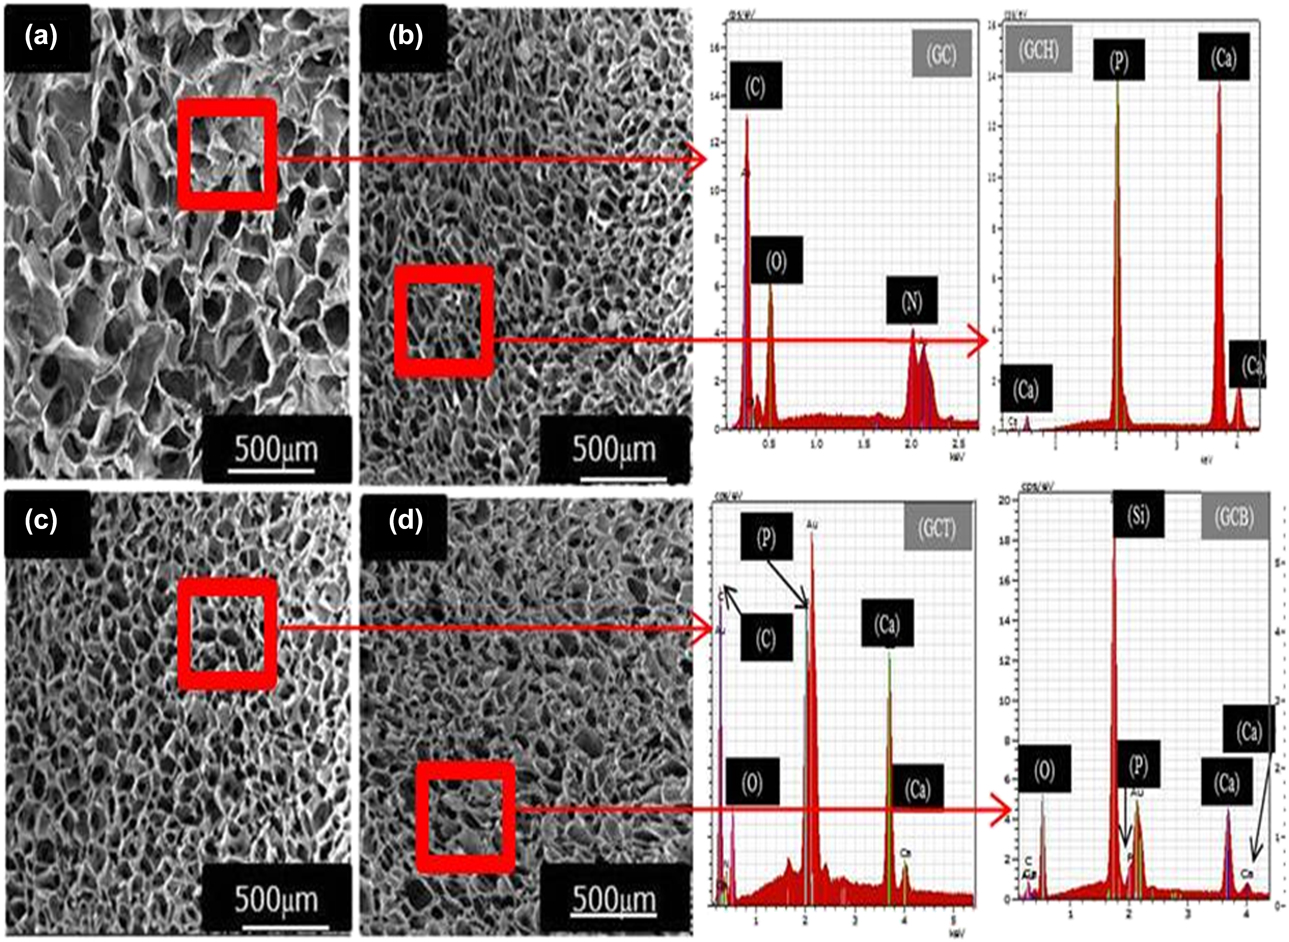
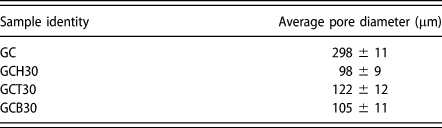
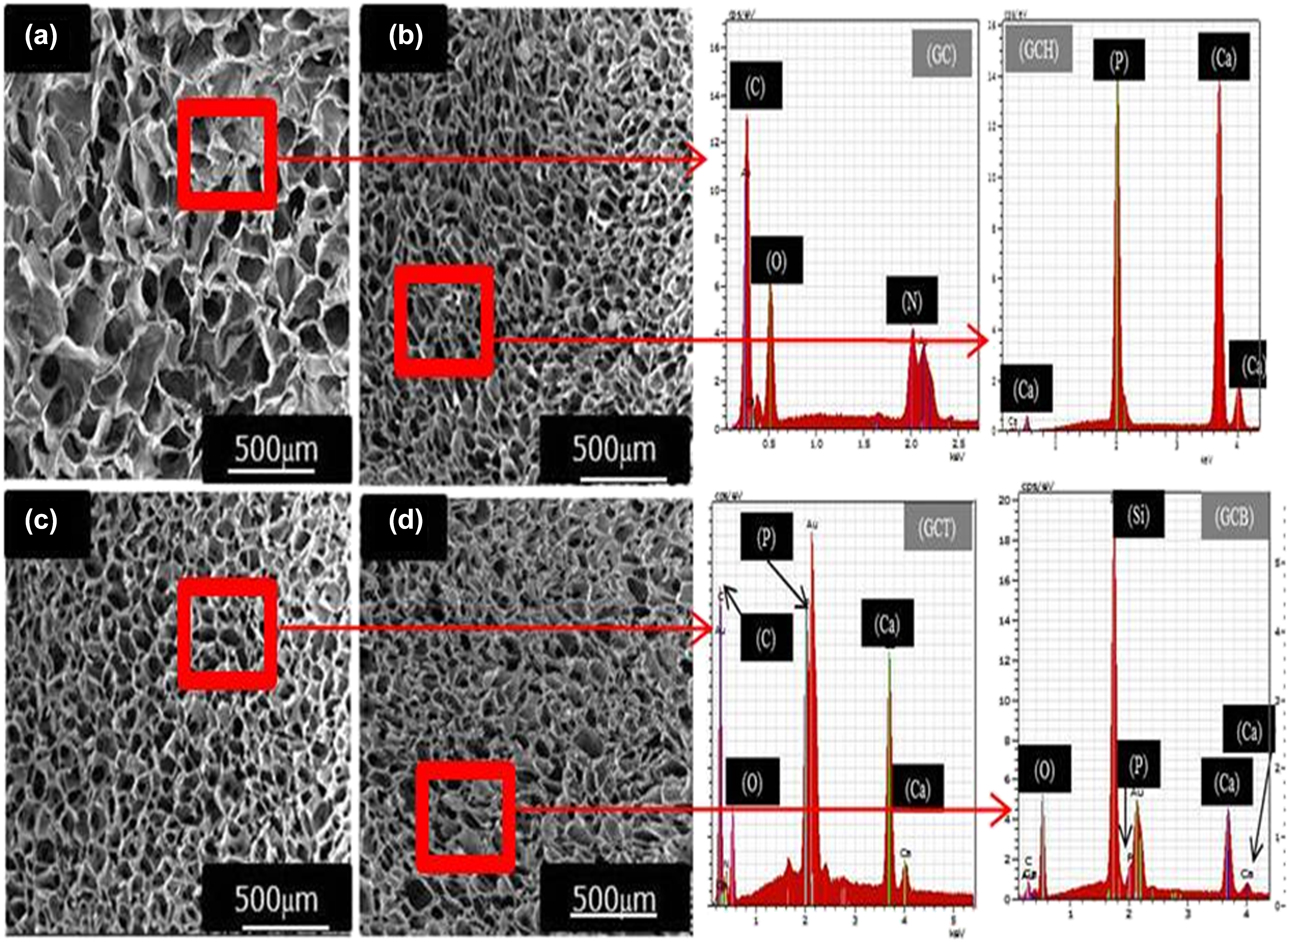
Highly porous microstructure in all the prepared scaffolds was observed from scanning electron microscopic (FESEM) images in Fig. 2. The interconnectivity of the pores and its size range varying between 90 and 120 μm in all the prepared composite scaffolds rendered them suitable for exhibiting osteoinduction. The average pore size in the entire composite scaffolds was less than that in the pure GC scaffold, which was in the range of 298 ± 11 μm. This explains that presence of bio-ceramic phase increased the elasticity of the pore wall and decreased the size of trapped ice crystal in the pores during the process of lyophilisation. Among the composite scaffolds, GCH30 exhibited the lowest average pore size of 98 ± 9 μm, whereas that of GCT30 was the highest of 122 ± 12 μm, as shown in Table I. The corresponding EDS analysis shows the presence of gelatin, chitosan only in pure GC scaffold [Fig. 2(a) EDS]. EDS analysis shows the peaks of C, N, O in GCH30 & GCT30 along with that of Ca and P in different atomic ratio such as 1.63:1 for GCH30 and 1.5:1 for GCT30, respectively [Figs. 2(b) and 2(c)]. In GCB30, the EDS peaks of Si, Ca, P were observed, indicating the composition of 58 s bioactive glass [Fig. 2(d)] in the scaffold.
FESEM micrographs of cross-section of scaffolds (a) GC (b) GCH30 (c) GCT30 (d) GCB30. EDX analysis of respective prepared scaffold.
Average pore diameter of prepared scaffolds using SEM analysis.

Micro-CT scanning of GCH30, GCB30, and GCT30 composite scaffold
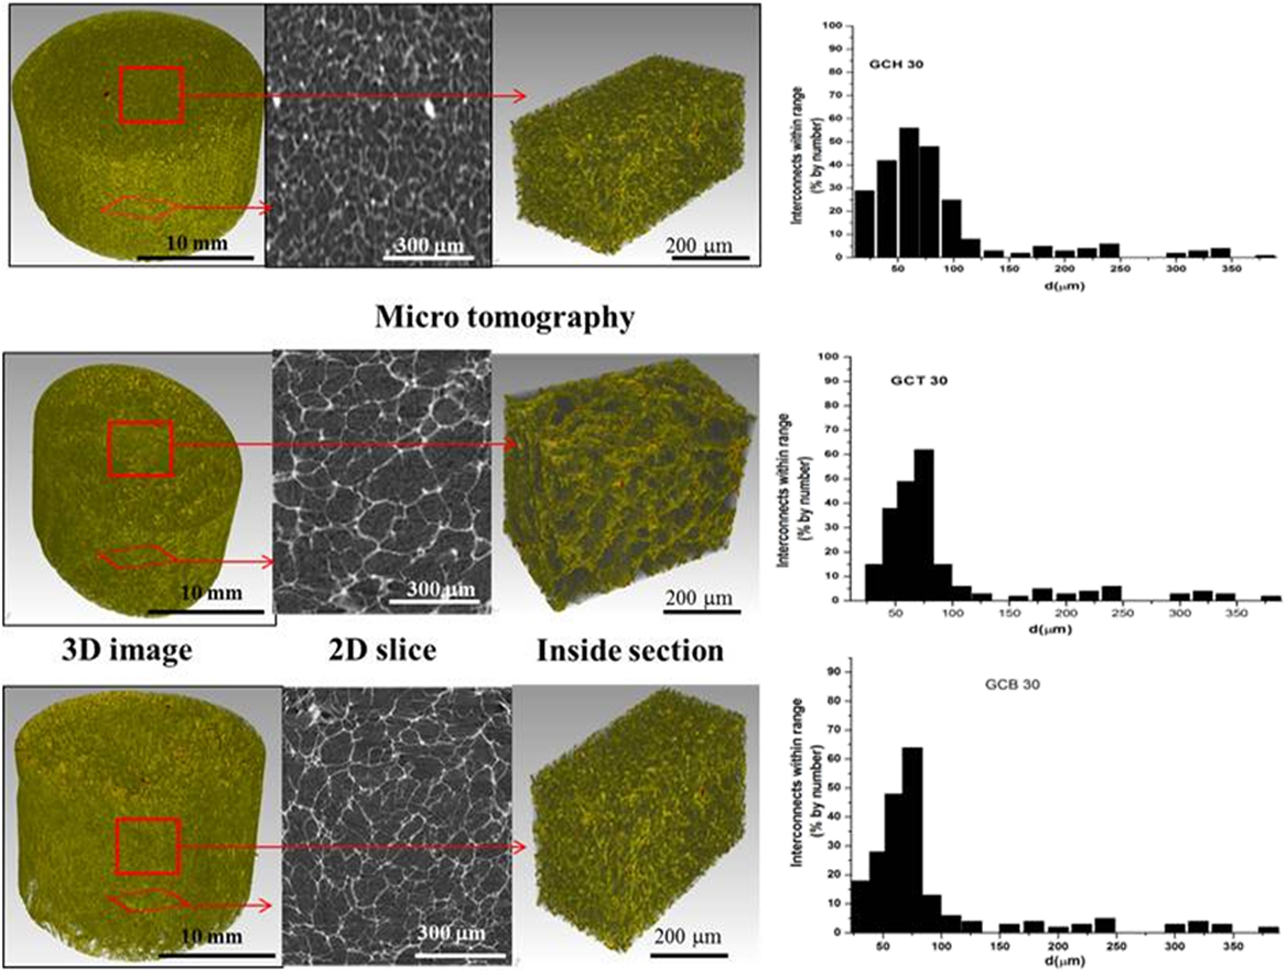
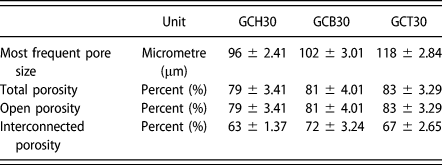
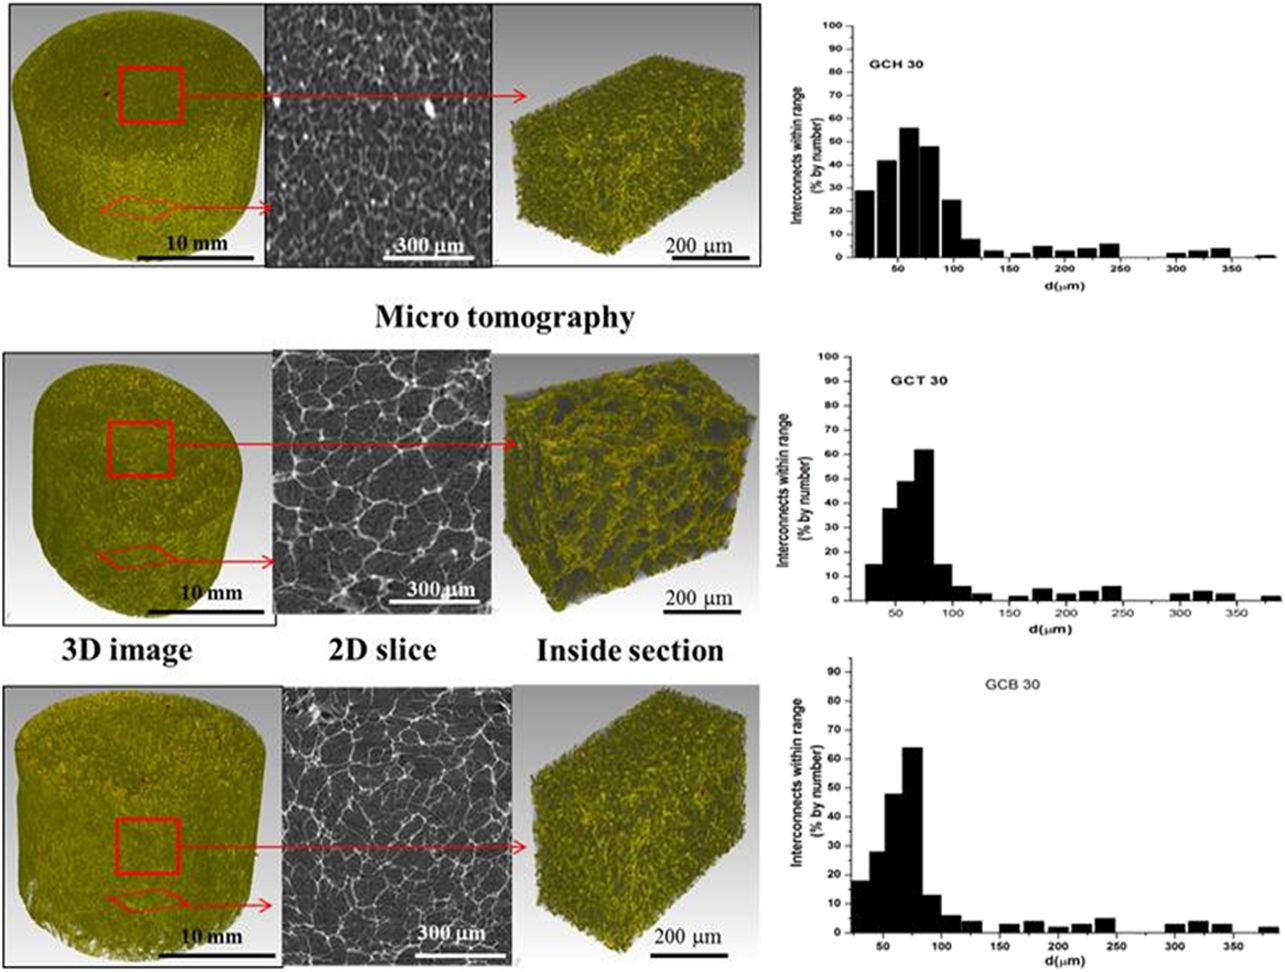
Micro-CT scanning on the prepared scaffold was conducted to quantify the pore size, porosity and interconnected porosity. Figure 3 depicts 2D cross-sectional and 3D reconstructional images of the scaffolds with interconnected pore diameter distribution plot of the prepared scaffolds. All GCH30, GCT30, and GCB30 scaffolds presented roughly homogenous porous structures, with high degree of interconnected and open porosity (Table I). The relative interconnected diameter distribution lies on the limit of 20–350 μm with a peak centered between 50 and 100 μm. The measured interconnected porosities of most frequent pores in GCH30, GCB30, and GCT30 were 63 ± 1.37%, 72 ± 3.24, 67 ± 2.65%, respectively (Table II), indicating that the interconnected porosities of the prepared composite scaffolds could be well controlled and GCB30 showed the highest interconnected porosity among the prepared scaffolds. This study confirms that scaffolds were prepared with sufficient degree of interconnected porosity, which is important for in vivo osteogenesis. The average pore size values obtained from micro CT (Table II) and from SEM investigation of microstructures of prepared scaffolds were found in good proximity.
2D and 3D images of GCH 30, GCT30, and GCB30 scaffolds acquired from micro-CT scanning.
Measurement of porosities in the prepared scaffolds by micro-CT scan.

All data shown as average ± standard deviation.
Study on BSA protein adsorption by composite scaffolds
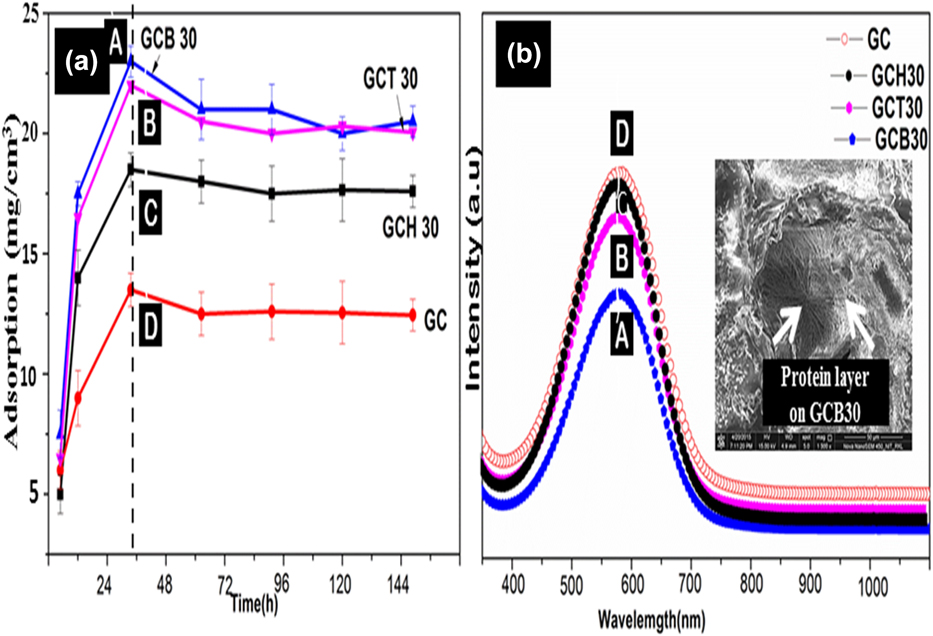
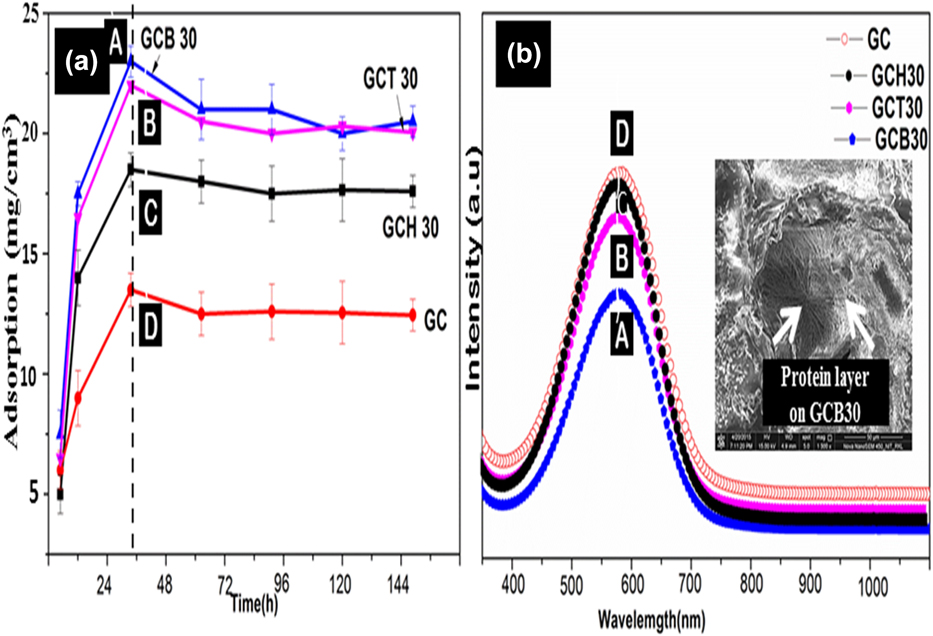
BSA adsorption on three composite scaffolds was evaluated for different time intervals from 10 to 144 h, as shown in Fig. 4(a). BSA concentration in supernatant solution was measured in the wavelength region of ∼560–570 nm using UV-visible spectrophotometer after adsorption of protein onto scaffolds from a standard BSA solution. In all the scaffolds, the amount of protein adsorption was the highest up to 36 h and then became more or less saturated. After 36 h of incubation in BSA solution, protein adsorption was found to be maximum of 24 mg/cm3 in GCB30 scaffold and minimum of 13 mg/cm3 in GC scaffold. Report says that incorporation of ΗΑp into PLLA scaffold improved protein adsorption capacity of the composite scaffold by forming a microenvironment on the scaffold surface favorable for protein adsorption [Reference Woo, Seo, Zhang and Ma28]. In composite scaffold, higher protein adsorption was evident because of higher surface area due to the presence of hydrophilic bioceramic nanoparticulate that interacted with the hydrophilic parts of the protein to bind more amount of protein on the surface as compared to the neat gelatin–chitosan (GC) scaffolds. Figure 4(b) shows lower amount of BSA concentration in supernatant solution from GCB30 scaffold as compared to neat gelatin–chitosan (GC) scaffold because of higher amount of protein adsorption onto GCB30 surface from standard BSA solution after 36 h of incubation. It appeared that GCB30 scaffold had the maximum protein adsorption capacity among all scaffold tested here after 36 h of incubation in protein solution. The ability of protein adsorption is considered as an important factor contributing to the biocompatibility of the materials, as it can positively influence cell adhesion, proliferation, differentiation [Reference Wilson, Clegg, Leavesley and Pearcy29].
(a) BSA protein uptake by different composite scaffolds (b) UV visible spectrum of BSA in supernatant solution after its adsorption onto different composite scaffolds after 36 h of study.
Degradation behavior of GCH30, GCB30, GCT30 composite scaffold
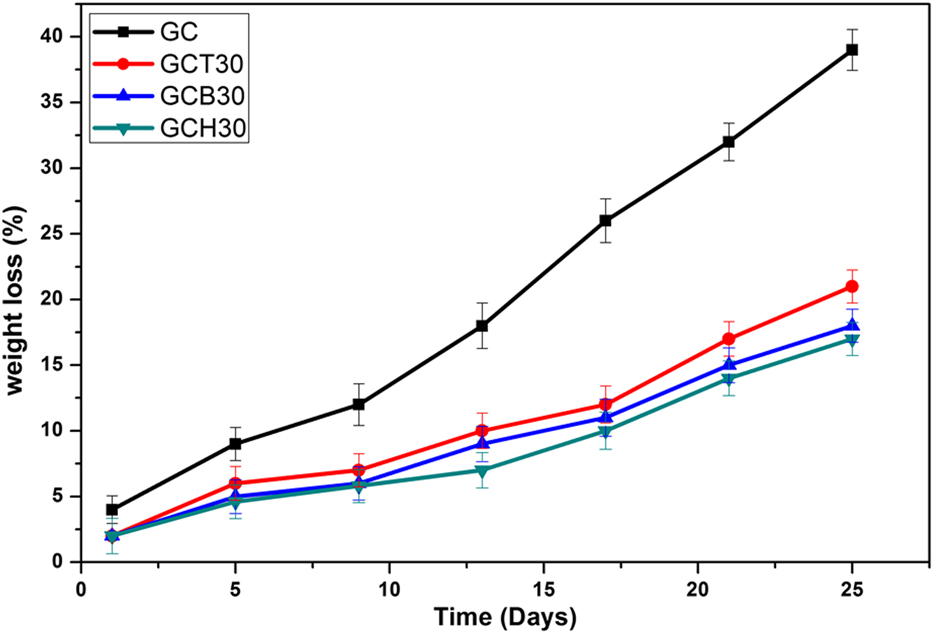
Degradability of the prepared scaffold was measured after immersing them in PBS solution having pH 7.4 for 25 days. Figure 5 represents the per cent weight loss of GC and composite scaffolds after immersing them for up to 25 days in SBF. All the composite scaffolds showed lower rate of degradation as compared to neat GC scaffold up to 25 days of immersion in PBS. The nanoparticulate ceramic phase addition into GC matrix resisted the rate of degradation due to stronger bonds between Ca2+ and COO− or PO43− and NH3+ present in bioceramic and gelatin–chitosan matrix.
Degradation kinetics of GC, GCT30, GCB30, and GCH30 scaffolds. Data represent mean value of three independent experiments.
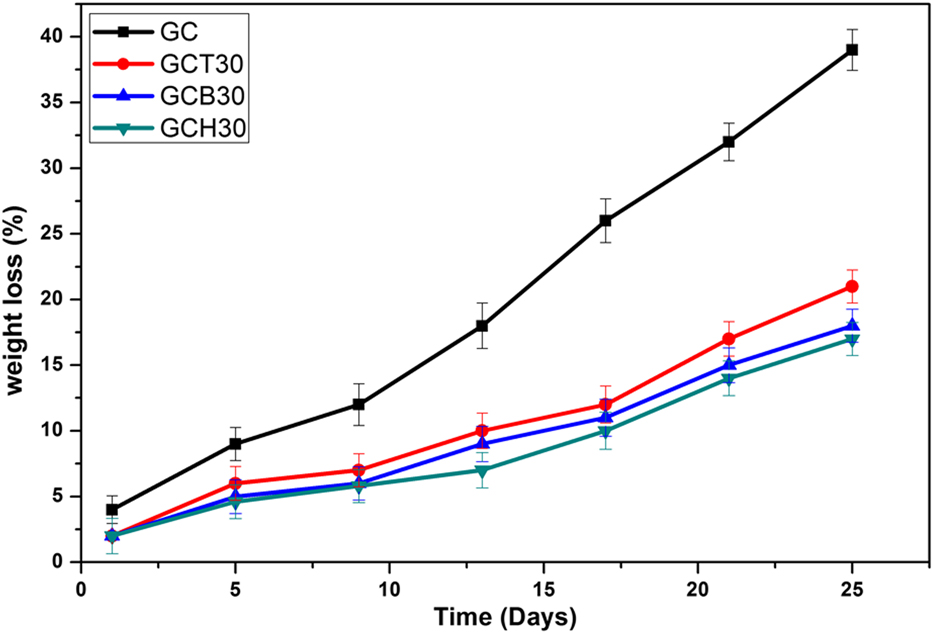
The average weight losses of GCH30 and GCB30 scaffolds were found to be 16% and 17%, respectively after 25 days of immersion in PBS, whereas GCT30 scaffold exhibited higher weight loss of 20% for the same period of immersion in PBS. All the composite scaffolds showed a similar trend in the degradation rate in PBS up to 25 days, which supports the fact that there exists no significant difference (P > 0.05) in degradation capability among the prepared scaffolds. That means the nature of existed bioceramics phase did not exert any significant influence on the degradation capability of the prepared composite scaffolds.
Cell attachment on GCH30, GCB30, and GCT30 composite scaffold
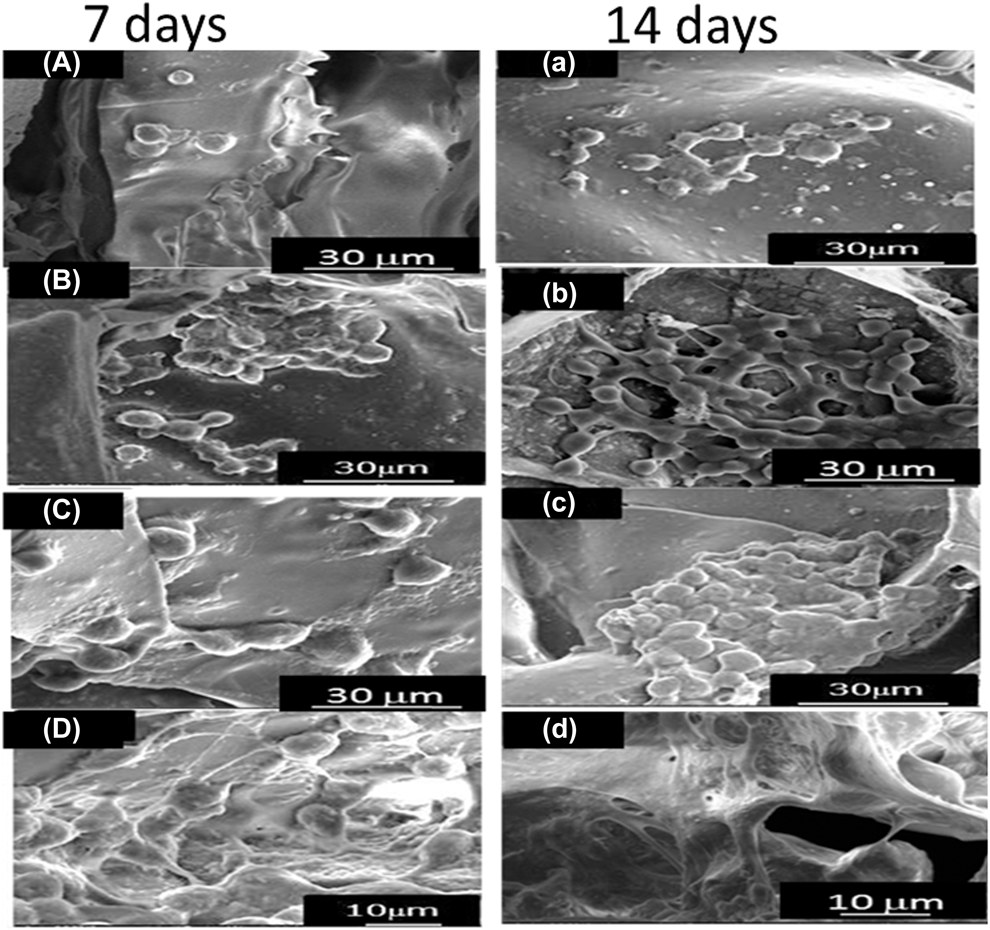
Osteoconductive and osteoinductive properties of the prepared scaffold would primarily be governed by cell attachment, spreading and migration onto the scaffold material. Figure 6 shows the morphology of cultured MSCs onto composite and pure GC scaffold after 7 and 14 days. Cell attachment and density in composite scaffold were found to be higher as compared to that in pure GC [Figs. 6(a)–6(d)]. As evident from the FESEM images [Figs. 6(a)–6(d)], cell density was higher in 14 days culture scaffold as compared to 7 days culture scaffold indicating osteoconductive properties of all the scaffolds studied here. Among the composite scaffolds, GCB30 was found to support cell spreading and attachment better than all other composite scaffolds [Fig. 6(d)].
Field emission scanning electron microscope (FESEM) images of human mesenchymal stem cells (hMSCs) grown on (a) GC, (b) GCH30, (c) GCT30, and (d) GCB30 scaffolds after 7 and 14 days.

Cell proliferation on GCH30, GCB30, and GCT30 composite scaffold
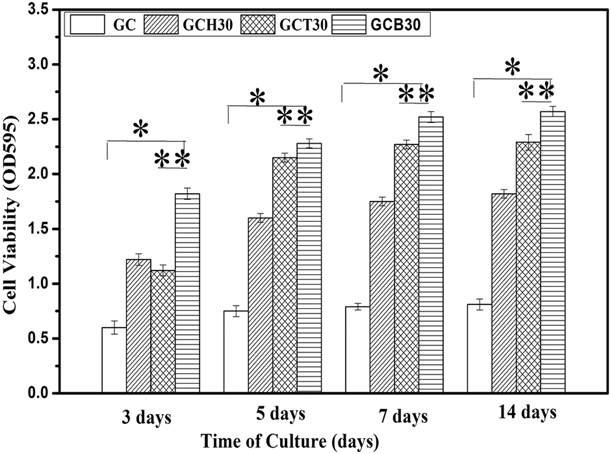
MTT assay of MSC’s cultured onto composite and GC scaffold in osteogenic media indicates relative proliferation potential of MSCs onto the respective scaffold as evident from Fig. 7.
MTT assay for proliferation of MSCs cultured in osteogenic medium at various periods of cell culture at 3, 5 and 7, 14 days, onto GC, GCH30, GCT30, and GCB30 scaffold. Error bars represent means ± SD for n = 3. *P < 0.05, **P < 0.01.

From micro-CT analysis in Fig. 3, major fraction of interconnected pores in the prepared scaffolds lies within 300 μm, whereas there exists some fraction of interconnected pore greater than 300 μm. Pore size around 100 μm is important for the cell adhesion and proliferation, whereas cells migration is faster through the scaffolds with 325 μm pore size. Thus, prepared scaffold’s pore size ranges are compatible for both osteochondral ossification and vascularization coupled with bone in growth.
Cell density in all scaffolds became higher with progress in cell culture time for 7 and 14 days suggesting osteoconductive potential in all the prepared scaffolds. Again, all composite scaffolds found to exhibit higher (P < 0.05) cell density as compared to pure GC scaffold. This explains that addition of bio-ceramic phase into GC matrix increased osteoconductive potential of the prepared scaffolds. Moreover, GCB30 exhibited significantly higher (P < 0.05) cell density as compared to other scaffolds studied here for all the periods of cell culture. Controlled release of Si, Ca, P ions from 58 s bioactive glass in cell culture media stimulated proliferation of mesenchymal stem cells as well as bioactivity of the GCB30 scaffold. This suggests that addition of 58 s bioactive glass into GC scaffold enhanced proliferation ability of MSCs to the highest extent among all other composition. It is to be noted that there is not too much difference (P > 0.05) in cell viability between 7 and 14 days of cell culture point and MSC’s proliferation ability is gradually saturated off with increase in differentiation capability of MSCs on progress in cell culture time.
Differentiation of MSCs in contact with prepared scaffolds
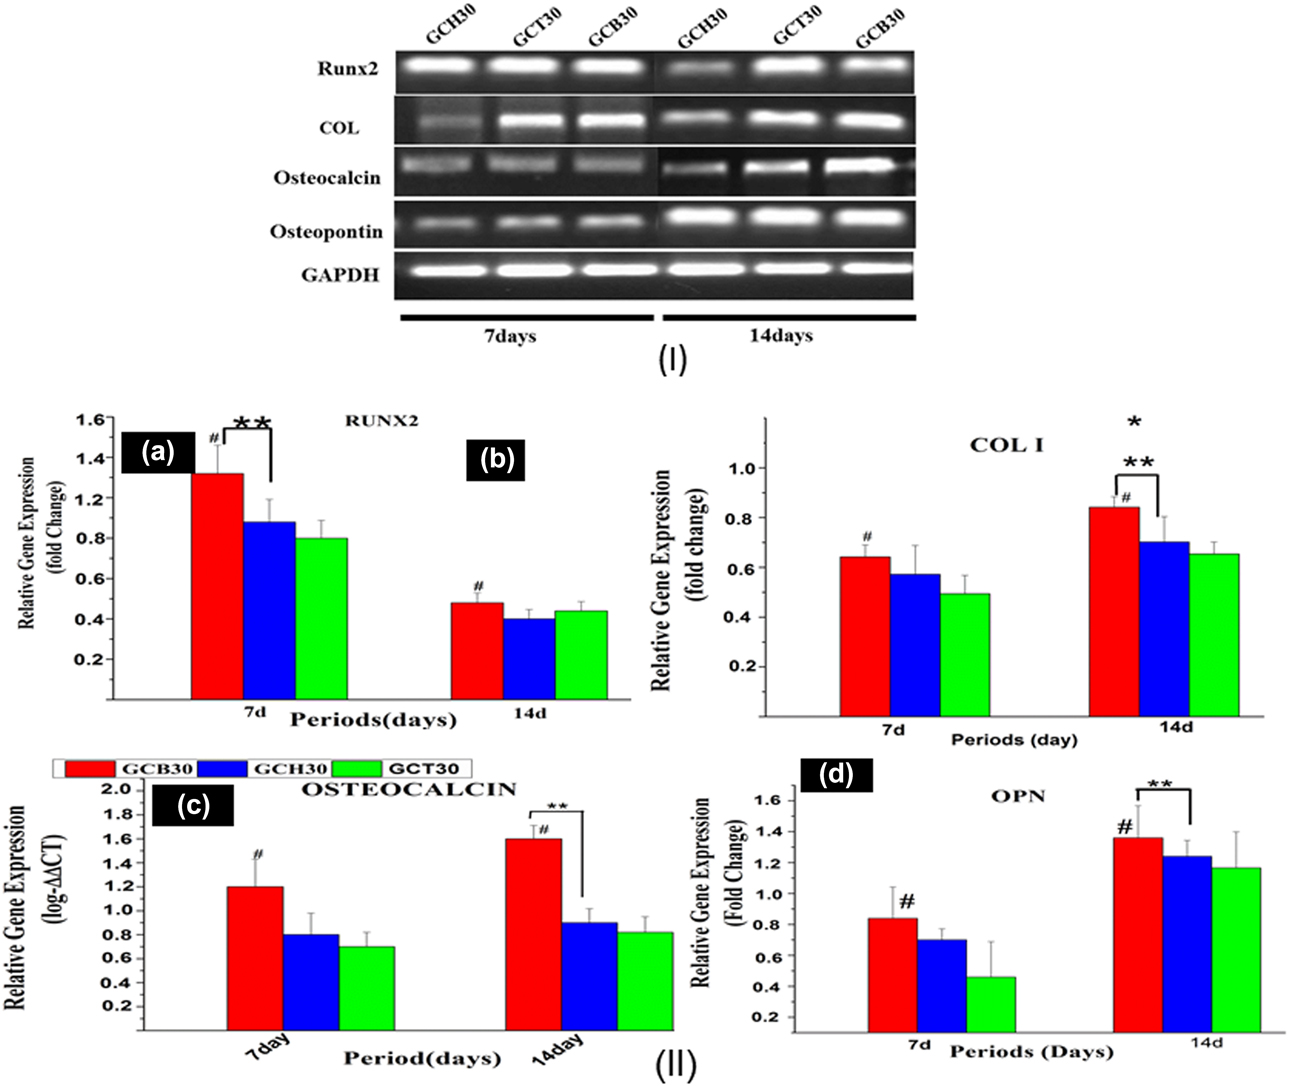
Treating GAPDH as a control, the expression levels of RUNX2, COL-1, OCN, and OPN were detected with the help of rt-PCR at two different time points of cell culture onto each type of composite scaffold. The band intensities obtained after gel electrophoresis of respective proteins are shown in Fig. 8(I). It is evident from Fig. 8(I) that RUNX2 expressions were more prominent at 7 days of cell culture compared to later time point of 14 days, which is consistent with MSCs’ differentiation into preosteoblast and then bone lineage at later time points.
(I) Images of amplified cDNA products using GAPDH as control for hMSCs cultured on GC, GCH30, GCT30, and GCB30 composite scaffolds in osteogenic media for 7 and 14 days. (II) Quantitative analysis of osteogenic markers up to 14 days on composite scaffold of (a) RUNX2, (b) COL I (c) osteocalcin (d) OPN expression of MSCs cultured on scaffolds by Q-PCR. *Represents statistically significant difference (P < 0.05).
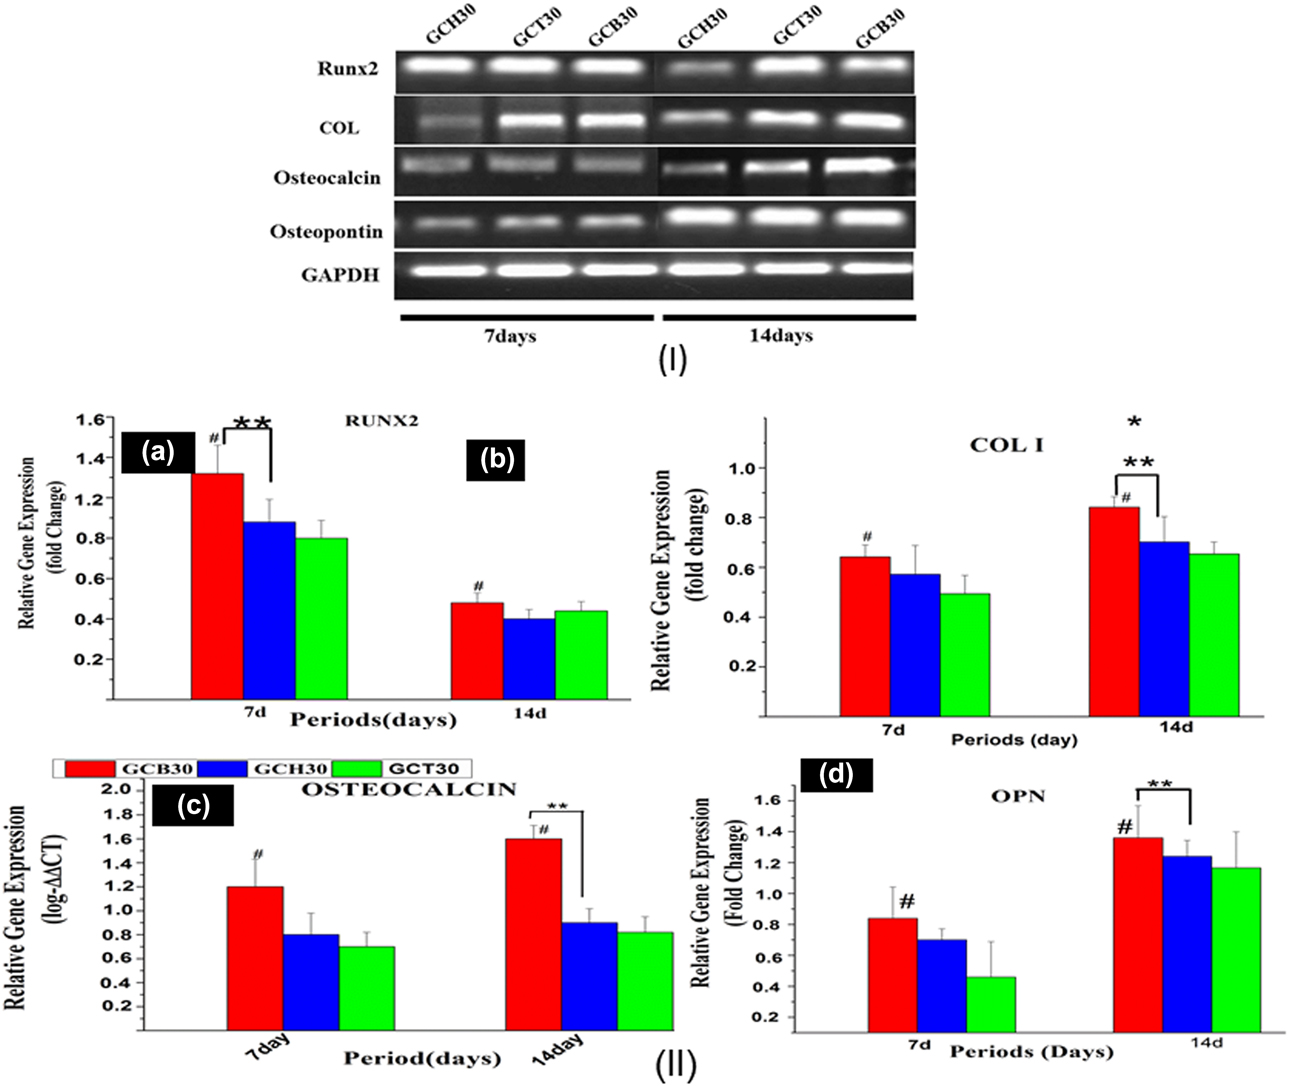
On the other hand, expression levels of COL-1, OPN, and OCN were higher on later time point (14 days) of cell culture compared to earlier time point (7 days). Higher expression of COL-1, OCN, and OPN at later time point of cell culture was consistent with the higher degree of bone matrix mineralization and mature osteoblast formation in each group of scaffold.
Osteogenic gene expression study
Figure 8(II) shows osteogenic gene expression profile of MSCs cultured onto GCB30, GCH30, and GCT30 scaffold. Semi quantitative result showed that relative expression of RUNX2 in GCB30 scaffold was higher (#P < 0.05) on 7 days than that is on 14 days as in Fig. 8-II(a). At the same time GCB30 showed higher (**P < 0.01) expression of RUNX-2 as compared to GCT30 on earlier time point of 7 days reflecting its better capacity to differentiate MSCs into preosteoblast. Expression of COL-1, OCN, and OPN was found to be higher on all the scaffolds particularly on GCB30 (# all P values < 0.05) at later time point of 14 days as compared to 7 days which is corroborated well with MSCs’ commitment to matured osteoblast, bone lineage and bone matrix mineralization. Moreover, gene expressions of COL-1, OPN, OCN appeared to be significantly higher (**P values < 0.01) on GCB30 as compared to GCT30 and GCH30 after 14 days of culture of MSCs [Figs. 8-II(b)–8-II(d)]. The reason behind the increasing osteoblastic gene expressions may be attributed to the synergic effect between Ca2+ and Si4+ ions released from GCB30 scaffold in cell culture media that helps in enhanced differentiation of MSCs seeded onto GCB30 scaffold as compared to other composite scaffold. This clearly reflects higher efficiency of GCB30 scaffold to regenerate bone tissue in vitro as compared to other composite scaffolds.
Conclusions
The prepared scaffolds having 30 wt% of HAp, β-TCP and 58 s bioactive glass showed highly interconnected and open porosity ideal for exhibiting osteoinduction and osteoconduction. GCB30 scaffold showed the highest degree of interconnected porosity and protein adsorption capacity, where BSA was used as a model protein. Similarly, MSC’s cultured on GCB30 scaffold showed better attachment and spreading behavior. Proliferation ability of MSC’s was found to be the highest on GCB30 scaffold and the lowest on GCH30 scaffold. MSC’s differentiation into osteogenic lineage was found to be the highest when cultured on GCB30 scaffold as suggested by both early marker, such as RUNX-2 and late marker, such as osteocalcin of osteoblast differentiation from rt-PCR analysis. Also, expression of osteopontin and collagen-I was found to be the highest from MSC’s cultured on GCB30 scaffold. The study reveals that incorporation of 58 s bioactive glass increased the osteogenic potential of gelatin–chitosan scaffold to the best degree among all other bio-ceramics studied here.
Materials
Chitosan (M W = 2.46 × 10⁵ Da) having degree of deacetylation = 85% and Type B gelatin, extracted from bovine skin, were purchased from Sigma-Aldrich, St. Louis, Missouri. Tetra Ethyl Ortho Silicate (TEOS: C8H20O4Si), Tri-ethyl Phosphate (TEP: C6H15O4P) and calcium nitrate tetra hydrate (Ca(NO3)2.4H2O), di-ammonium hydrogen phosphate [(NH4)2HPO4] were procured from Merck (Kenilworth, New Jersey). Glacial acetic acid (96%) and ammonia solution (NH4OH) were purchased from LOBA chemical (Mumbai, India). Glutaraldehyde (GA)(C5H8O2) and 0.1 M nitric acid (HNO3) were purchased from Merck (India).
Methods
Preparation of porous HAp/β-TCP/58 bioglass/chitosan–gelatin composite scaffold
GCH30, GCT30, GCB30 scaffolds were prepared using the same methods as reported in our earlier studies [Reference Maji and Dasgupta30]. HAp-chitosan composite nanopowder, β-TCP and 58 s bioactive glass nanopowders were synthesized first using wet chemical method as described earlier [Reference Maji and Dasgupta30]. For preparation of GCH30 scaffolds, required amount of HAp-Chi nanopowders were mixed with 0.014 gm/mL of gelatin solution so that gelatin (G):chitosan (C):HAp (H) weight percentage ratio becomes 30:40:30. Separately, chitosan (C) solution was prepared by dissolving required amount of medium molecular weight chitosan in a solution containing 4 mL of acetic acid and 96 mL of deionized water with stirring for 5 h to get a perfectly transparent solution. Aqueous solution of gelatin was prepared at 40 °C and mixed with the prepared chitosan solution. Synthesized β-TCP nanoparticles were added to gelatin–chitosan solution to maintain the weight% ratio of gelatin (G):chitosan (C):β-TCP (T) as 30:40:30 to prepare GCT30 scaffold. In a similar manner, 30 wt% of synthesized 58 s bioactive glass (B) nanoparticles were mixed with gelatin–chitosan solution to maintain the composition of gelatin:chitosan:bioactive glass as 30:40:30 in weight ratio. Three separate suspensions were then sonicated (IUltrasonic, Samarth Mektronics, Navi Mumbai, India) for 10 min to remove any entrapped air bubble. A glutaraldehyde solution was prepared by dissolving 0.5 mL glutaraldehyde (50%) in 100 mL deionized water. Required amount aqueous solution of glutaraldehyde (0.25 vol%) was added to three different slurries at 4 °C under manual agitation. The resulting slurries were put in 10 mL PTFE cylindrical mold and then rapidly pre-freezed at −20 °C (Labfreeze, FL1150, Labfreeze Instrument Group Co., Ltd., Changsha Hunan Province, China) to solidify whole water into ice and kept overnight. Next, the frozen samples were lyophilized using a freeze-dryer (Labconco, Kansas City, Missouri) at −52 °C for 48 h to form a composite 3D porous GCH30, GCT30, and GCB30 scaffolds. Excess glutaraldehyde and residual acetic acid were removed from the lyophilized scaffolds after washing them with 5% sodium borohydride and then with NaOH solution for three times for 2 h. Finally, the freeze-dried scaffolds were kept in the vacuum desiccator (size-150 mm, Tarsons Products Pvt. Ltd., Kolkata, India) for further characterization.
Supplementary material
To view supplementary material for this article, please visit https://doi.org/10.1557/jmr.2019.170.
Acknowledgments
The authors acknowledge financial support from the Department of Ceramic Engineering, NIT Rourkela for carrying out this work. All the personnel involved in characterization of the materials are sincerely acknowledged.