Research in bilingualism has grown exponentially in recent years, and so has the diversity of results obtained. How can one reconcile disparate outcomes from what is ostensibly the same question? Ooi, Goh, Sorace, and Bak (Reference Ooi, Goh, Sorace and Bak2018) described the important influence that environmental factors exert on research outcomes, including the specific ways in which bilingualism is instantiated and defined in different contexts and proposed that these differences are part of the explanation for the diversity of results. As pointed out by Luk and Bialystok (Reference Luk and Bialystok2013), bilingualism is not a categorical variable. Therefore, the criteria for determining bilingualism are central to the interpretation and possible resolution of the disparate results from these studies. It is now essential to examine the notion of bilingualism and evaluate the means by which it is assessed for the field to move forward.
There has been a growing recognition that the issue of how bilingualism is defined is central to the research (Bialystok, Reference Bialystok2016), and studies have addressed this problem in multiple ways (Surrain & Luk, Reference Surrain and Luk2017). The most prevalent method for assessing bilingualism is simply to ask participants whether they speak a second language. More detailed assessments of bilingualism may include an evaluation of language proficiency in each language. While this latter method is ideal in that it provides a measure of the exact level of language knowledge and degree of bilingualism (generally by calculating a ratio of proficiency in the two languages), its use is unrealistic in diverse environments where there are multiple variants of bilingualism and many languages spoken in the community. For example, in Greater Metropolitan Toronto, a multicultural city, the top five languages after English are Cantonese (9.5%), Mandarin (8.5%), Punjabi (6.8%), Italian (6.0%), and Tagalog (5.9%) from a total of 224 non-English languages spoken (Statistics Canada, 2017). Moreover, 63% of households reported using a non-English language as the primary language of the home. Clearly, assessing proficiency for each language would be unfeasible requiring both staff that are fluent in multiple languages, and materials standardized across multiple languages. In contrast, contexts in which there is a small number of languages being used can provide assessments of all of them (e.g., Bedore, Peña, Summers, Boerger, Resendiz, Greene, Bohman & Gillam, Reference Bedore, Peña, Summers, Boerger, Resendiz, Greene, Bohman and Gillam2012; Gollan, Weissberger, Runnqvist, Montoya & Cera, Reference Gollan, Weissberger, Runnqvist, Montoya and Cera2012).
A compromise between asking individuals whether they know a second language and explicitly testing their knowledge of it is to administer an extensive battery of questions designed to assess their proficiency and use of a second language indirectly by asking for participants to provide ratings on a number of scales. Currently, several such instruments exist for measuring bilingualism (Anderson et al., Reference Anderson, Mak, Keyvani Chahi and Bialystok2018; Gollan et al., Reference Gollan, Weissberger, Runnqvist, Montoya and Cera2012; Li, Zhang, Tsai & Puls, Reference Li, Zhang, Tsai and Puls2014; Luk & Bialystok, Reference Luk and Bialystok2013; Marian, Blumenfeld & Kaushanskaya, Reference Marian, Blumenfeld and Kaushanskaya2007; Wilson & Dewaele, Reference Wilson and Dewaele2010). All of these questionnaires are detailed and include comprehensive questions about language background, use, and proficiency, and all of them provide information that is substantially more sensitive than responses to simple self-ratings of fluency in listening and speaking on a 7-point scale in the absence of more detailed background and contextual information (e.g., Paap & Greenberg, Reference Paap and Greenberg2013).
The LEAP-Q developed by Marian, Blumenfeld, and Kaushanskaya (Reference Marian, Blumenfeld and Kaushanskaya2007) was created to characterize the underlying factors of bilingual use and to respond to Grosjean's challenge for the field to standardize its definitions of bilinguals (Grosjean, Reference Grosjean1998). Marian and colleagues thus set out to produce a questionnaire that is “comprehensive, valid, and reliable across bilingual populations and settings”. The authors administered their questionnaire to 52 multilingual participants and submitted the results to a factor analysis. Eight factors were retained from this analysis and were characterized as: L1 Competence, Late L2 Learning, L2 Competence, L1 Maintenance, Late L2 Immersion, Media-Based Learning, Non-Native Status, and Balanced Immersion. This structure was largely confirmed in a second study with fifty English–Spanish bilinguals (Marian et al., Reference Marian, Blumenfeld and Kaushanskaya2007). The authors’ use of a factor analytic approach to characterize the latent dimensionality of a questionnaire, and by proxy bilingualism, was an important advance in the field and provided a crucial empirical approach to tackling this difficult issue of definition. The questionnaire has been widely used and has improved the quality of research in the field. However, the original analyses of the LEAP-Q had little power. Although there are different guidelines for minimum numbers of subjects in a factor analysis, one common benchmark is the minimum recommendation of at least 100 subjects (Hatcher, Reference Hatcher2005). From a conceptual perspective, Marian and colleagues chose to extract orthogonal factors from their instrument, an approach that forces the extracted factors to be uncorrelated. However, the assumption that factors are uncorrelated may not be correct, and it is unclear to what degree factors extracted separately in an orthogonal manner (such as “Late L2 Learning” and “L2 Competence”) are based on shared or separate underlying variance.
Around the same time that the LEAP-Q was developed, Li, Sepanski, and Zhao (Reference Li, Sepanski and Zhao2006) produced The Language History Questionnaire (LHQ). This questionnaire, now in its second instantiation (Li et al., Reference Li, Zhang, Tsai and Puls2014), is an amalgamation of 41 language history and bilingualism questionnaires from the literature. Users are invited to select questions according to one of three levels of customization (i.e., keep the full set, select blocks of questions, or select individual questions). The LHQ online questionnaire platform allows researchers to track individual responses and generates summary scores. An obvious benefit to this platform is its ease of use that makes it broadly available to many researchers and thus may lead to common criteria for ‘bilingualism’. However, although the LHQ provides a sound basis for evaluating bilingualism in studies of young adults, children and older adults are not currently well represented by the questions in the database.
The questionnaire that has been developed through our research is the Language and Social Background Questionnaire (LSBQ). After many years of use and modification, the first published version and statistics on this instrument for young adults was reported by Luk and Bialystok (Reference Luk and Bialystok2013). A larger evaluation of an updated version of the instrument was presented by Anderson, Mak, Keyvani Chahi, and Bialystok (Reference Anderson, Mak, Keyvani Chahi and Bialystok2018). That study submitted responses from 408 adult participants with a wide range of non-English languages to an exploratory factor analysis using an oblique rotation (promax). The results indicated a three-factor solution capturing 74% of the variance in the LSBQ questions submitted for analysis. The factors that emerged were Non-English Home Use and Proficiency, Non-English Social Use, and English Proficiency. The first two factors were highly correlated with each other (r = 0.7) and negatively correlated with English proficiency (r = −0.4 and r = -0.6 respectively). A composite score was calculated by computing the weighted sum of the individual factors based on how much each contributed to the variance of this overall composite. Higher composite score values corresponded to higher degrees of bilingualism; these composite scores also correlated with higher scores on verbal cognitive performance measures (e.g., Shipley Blocks) and lower scores on English verbal cognitive performance measures (e.g., word-flanker and Shipley verbal tasks). Instructions for computing factor scores and the composite factor score from the LSBQ as described in the paper by Anderson et al. (Reference Anderson, Mak, Keyvani Chahi and Bialystok2018) have been posted in an online repository facilitating the use of continuous measures of bilingualism that are in line with the recommendations described by Luk and Bialystok (Reference Luk and Bialystok2013).
To this point, the instruments have focused on the problem of capturing and explaining the variance in bilingual experience that applies to young adults. However, just as environmental context is relevant for understanding the consequences of bilingual experience, the age of the individual may also have systematic effects on these relations. Is the structure of bilingual experience similar for children and older adults as that described for young adults?
It has long been recognized that bilinguals may use their languages differently across different contexts. Cooper (Reference Cooper1969), for example, suggested that since one language might be used more at work and a different one at home, simple measures of proficiency obtained by subtracting scores in one language from the other, as was common at the time, might be an insufficient assessment. Cooper's data supported his claim in that relative proficiency in English or Spanish fluctuated as a function of the context of use, what he termed domain. Grosjean (Reference Grosjean1998) extended this observation by suggesting that rather than domains being trait-like features within individuals, language use may flexibly change in response to the environment; in short, bilinguals “adapt their language behavior” to environmental demands. Grosjean termed the various language environments a bilingual might encounter language “modes”, and an individual could move on a continuum from a monolingual mode to a bilingual one depending on features and demands of the environment. Grosjean's (Reference Grosjean1998) primary concern was that an individual's position along the monolingual to bilingual mode continuum would change cognitive performance. In Grosjean's view, such a shift might occur merely by having a bilingual experimenter inadvertently disclose nonverbal cues that they understood the shared second language. An empirical demonstration of this possibility comes from a study by Wu and Thierry (Reference Wu and Thierry2013). Welsh–English bilingual participants performed a simple conflict resolution task in which some of the trials included (irrelevant) cues from the other language, presumably placing the participants in a bilingual mode. On these trials, performance was better than it was on trials that ostensibly represented a monolingual mode.
Green and Abutalebi (Reference Green and Abutalebi2013) extended this work on the importance of context by proposing the Adaptive Control Hypothesis, in which they identified three types of contexts based on how the two languages were used. They hypothesized that not only do bilinguals shift across these contexts – called single language, dual language, and dense code-switching – but also the individual's position on these contexts had implications for the cognitive and neural consequences of bilingual language use. For example, they argued that dual-language contexts, in which two or more languages are used with different speakers, are particularly demanding and may rely more on the anterior-cingulate cortex, and covary with a high number of cognitive constructs including: goal maintenance, interference control, detection of salient stimuli, response inhibition, task disengagement, and task engagement. Dense code switching, in contrast, makes fewer demands because the consequences of selecting the wrong language are low, so less monitoring and attention are required to sustain communication. Current research is investigating the predictions from this model and contributing to a more detailed understanding of how the interactional contexts in which languages are used shape the consequences of bilingualism (e.g., Hartanto & Yang, Reference Hartanto and Yang2016).
The combination of inconsistent and incomplete definitions of bilingualism (e.g., Surrain & Luk, Reference Surrain and Luk2017) and evidence for the importance of the context in understanding the implications of bilingualism (e.g., Ooi et al., Reference Ooi, Goh, Sorace and Bak2018) leads to the conclusion that descriptions of bilingualism need to include details about the context. Without such information, it is not surprising that different studies examining the cognitive outcomes of bilingualism, where ‘bilingualism’ is defined broadly (or not at all) will produce inconsistent results. In the present study, we expand the effort to detail the relevant features of bilingual experience by considering another contextual factor that has not previously been documented: namely, the age of the individual.
Just as linguistic, social, and cultural features of the environment influence how language is used, so too does the age of the individual. Children and older adults find themselves in different transactional contexts than do young adults, although the majority of the work on constructing descriptions of bilingualism has been based on young adults. Yet there is a substantial contextual shift in terms of how language is used in general and how a second language is used in particular when the individual moves from the home and school environment as a child to a social and professional environment as a young adult. Similarly, older adults return to a more home-based context and the nature of their linguistic interactions may change again. Thus, for both children and older adults, the primary vectors for use (and maintenance of proficiency) are family and close friends.
The present study extends the analyses applied to responses to the LSBQ obtained from young adults (Anderson et al., Reference Anderson, Mak, Keyvani Chahi and Bialystok2018) in both directions along the lifespan. We used factor analyses and compared children, young adults, and older adults on the LSBQ. In addition, the factor scores obtained from the analyses of each of these age groups were used to investigate the relation between degree of bilingualism and verbal and nonverbal measures of IQ as was done for young adults in the original study.
Method
Children
We followed the same general method that was described in Anderson et al. (Reference Anderson, Mak, Keyvani Chahi and Bialystok2018). The main difference between the studies included in this factor analysis and those used for adults is that the LSBQ was completed by parents and not by the children themselves. Between 2013 and 2016 we collected data from 675 children, including 301 males, 372 females, and 2 unspecified, as part of four separate studies. Children's average age was 111.33 months (SD = 11.12). Parents were asked to fill out a children's version of the LSBQ (questionnaires may be obtained here: https://figshare.com/articles/Who_is_Bilingual_Snapshots_Across_the_Lifespan/5001179), which was similar to the original but shorter and more focused on the experience of the child. Socio-economic status (SES) was determined by parents’ education on a scale from 1 to 5 (M = 3.5, SD = 1.16, range = 1–5), where 1 indicates some high school education; 2 indicates high school graduate; 3 indicates some post-secondary education; 4 indicates post-secondary degree or diploma; and 5 indicates graduate or professional degree. Most children were born in Canada (76%), and those born elsewhere predominantly came from the Philippines (20), India (19), China (14), USA (12), Pakistan (10), Iran (4), Jamaica (4), Hong Kong (3), Japan (3), Portugal (3), Sri Lanka (3), and the United Arab Emirates (3). Language use was diverse: among second language speakers (N = 489), French was the most common language (57) followed in descending order by Tamil (47), Punjabi (45), Urdu (33), Mandarin (27), Italian (21), Tagalog (20), Cantonese (19), Farsi (19), Spanish (19), Hindi (15), Portuguese (12), Gujarati (10), Chinese (9), Vietnamese (9), Korean (7), Arabic (6), and Filipino (6). Other languages and countries were also present but were less prevalent in the data set.
Older adults
Data from older adults were collected from two studies between 2015 and 2018. There were 125 older adults, of whom 37 were males, and 88 were females. In this sample, 61 individuals self-identified as bilingual during the recruitment process, 59 identified as monolingual, and 5 individuals did not respond. These designations were simply for recruiting purposes since all participants completed the full questionnaire. The average age of older adults was 74.4, SD = 4.36, and the average education was 3.87, SD = 0.92 (on the same 5-point scale described above for children). A slight majority of older participants was born abroad (72). Among those who spoke a second language, the average age of first exposure was 7.8 years (SD = 11.17). The 15 most prevalent countries of birth were Canada (11), Germany (7), Phillipines (5), India (4), China (3), Italy (3), Sri Lanka (3), UK (3), Austria (2), France (2), Hungary (2), Netherlands (2), Russia (2), South-Africa (2). Similarly, the most common non-English languages were French (10), German (6), Tagalog (5), Spanish (4), Cantonese (3), Yiddish (3), Dutch (2), Finnish (2), Hindi (2), Hungarian (2), Italian (2), Ukrainian (2).
Results
Children
As a first step in running an exploratory factor analysis (EFA), a matrix of correlations was estimated between all possible pairs for 37 items of the LSBQ using 675 cases. An initial inspection of the resulting correlation matrix revealed that 9 items did not correlate well with others (i.e., had multiple low absolute correlation values <0.3). An additional 10 items were found to load equally on more than one factor following an initial analysis used to determine eigenvalues (i.e., the difference between the highest two factor loadings was <0.4). Items in these categories were removed before the final analysis, leaving 18 items to be analyzed with an ordinary-least-squares minimum residual approach to EFA using an oblique rotation (promax). The Kaiser-Meyer-Olin measure verified the sampling adequacy for the analysis KMO = .88 (“meritorious” according to Kaiser, 1974), and all KMO values for the individual items were >.81 which is well above the acceptable limit of .5. Bartlett's test of sphericity Χ2 (153)= 15192.48, p = 0, indicated that correlations between items were sufficiently large for a factor analysis.
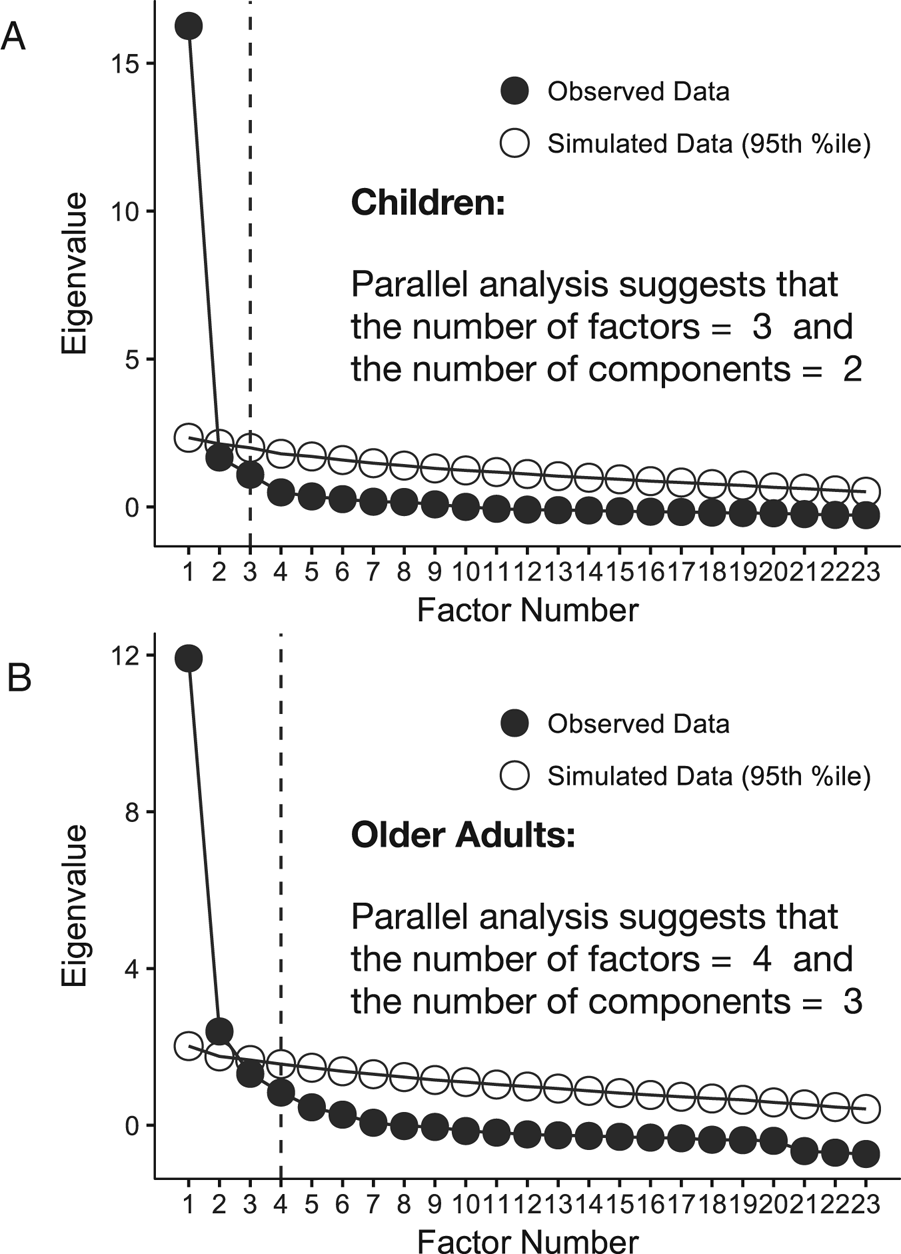
An initial analysis was run to obtain eigenvalues for each factor in the data. Three factors had eigenvalues over Kaiser's criterion of 1 and in combination explained 74% of the variance. The parallel analysis and scree plot was slightly ambiguous and showed inflexions that would justify retaining both two and three factors (see Figure 1).
Parallel analyses for A) children, and B) older adults. Three factor solutions were preferred to facilitated comparison across groups and with existing younger adult data.

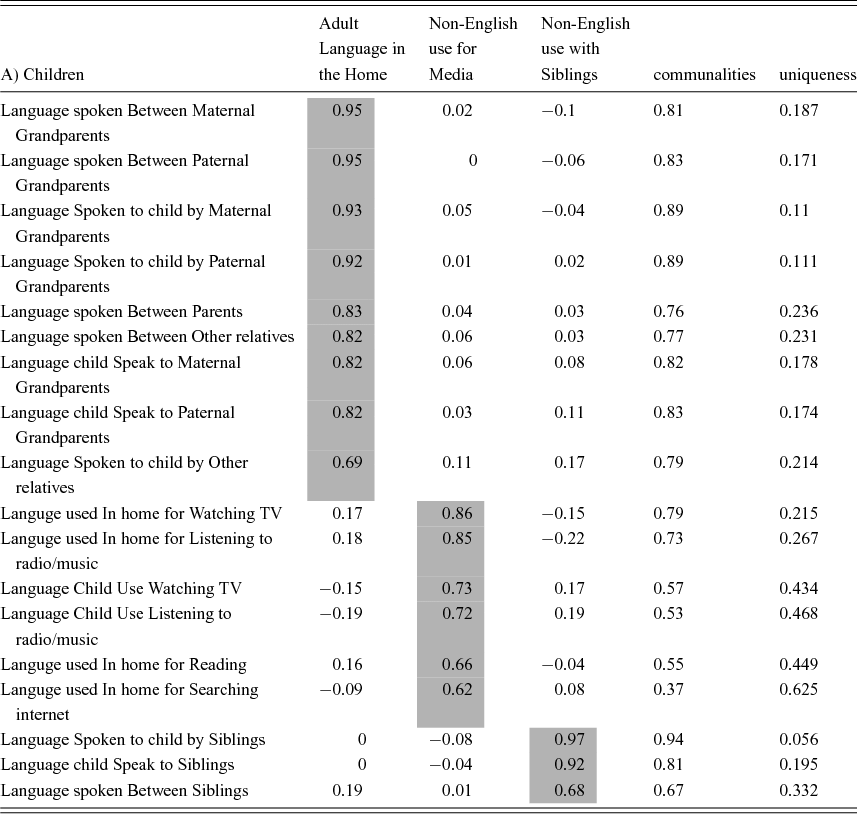
Given the large sample size (675) and the convergence of the scree plot and Kaiser's criterion on three factors, three factors were retained. Table 1 shows the factor loadings after rotation for the final analysis.
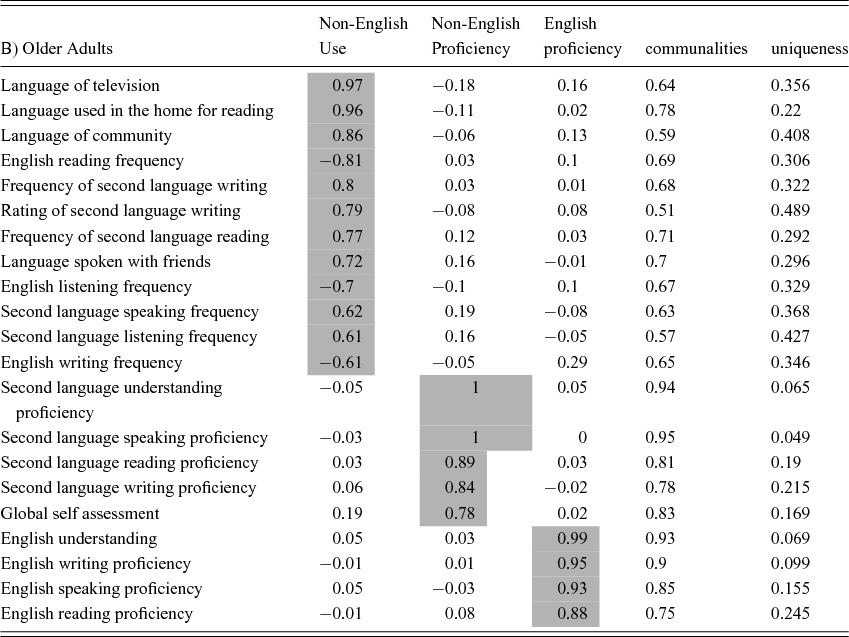
Factor analysis result: A) pattern matrix for children, B) pattern matrix for older adults.

Factor 1: Home adult language: Variance 40% α = 0.977 [0.97, 0.98]
Factor 2: Media: Variance 20% α = 0.89 [0.87, 0.90]
Factor 3: Siblings: Variance 14% α = 0.92 [0.91, 0.93]
Continued

Factor 1: Usage: variance 36% α = 0.995 [0.992, 0.998]
Factor 2: Second language proficiency: variance 21% α = 0.998 [0.996, 0.999]
Factor 3: English proficiency: variance 17% α = 0.977 [0.994, 0.999]
The items that cluster on the same factors suggest that Factor 1 represents Adult language in the Home, Factor 2 represents Non-English use for Media, and Factor 3 represents Non-English use with Siblings. Separate reliability analyses were conducted for each of the factors using the raw data. These values appear in Table 1. Finally, factor scores were extracted with the Thurstone method using the factor.score function from the psych package with the default options selected. Factor scores were imputed for participants with missing raw scores.
To assess the relationship between the factor score derived from the factor analysis and measures of IQ, we used Bayesian correlation as implemented in JASP (JASP Team, 2018). This software produces a plot of credible posterior values for the statistic of interest (in this case rho – the population correlation value) along with a 95% HDI or credible interval. If the 95% HDI excludes 0, then there is 95% certainty that the true mean does not include 0. This differs from a classic frequentist interpretation where a confidence interval only indicates that in 100 iterations of the test, the true population mean would be contained within the interval's bounds on 95 of those tests. Confidence intervals, unlike credible intervals, cannot say anything about the certainty of the estimate. The closer one gets to the center of a credible interval, the more certain one can be of being close to the most credible posterior value. By contrast a ‘true’ value (i.e., the population value), might appear anywhere within the confidence interval.
JASP also produces Bayes Factors for each estimate. Bayes factors provide weighted evidence for or against an effect. A Bayes factor of 1, for example, provides no evidence for the effect of interest, whereas a Bayes factor of 3 provides weak evidence. Bayes factors smaller than 1 support the null hypothesis (i.e., there is stronger evidence that there is no difference, or that the relationship of interest is zero than the alternative).
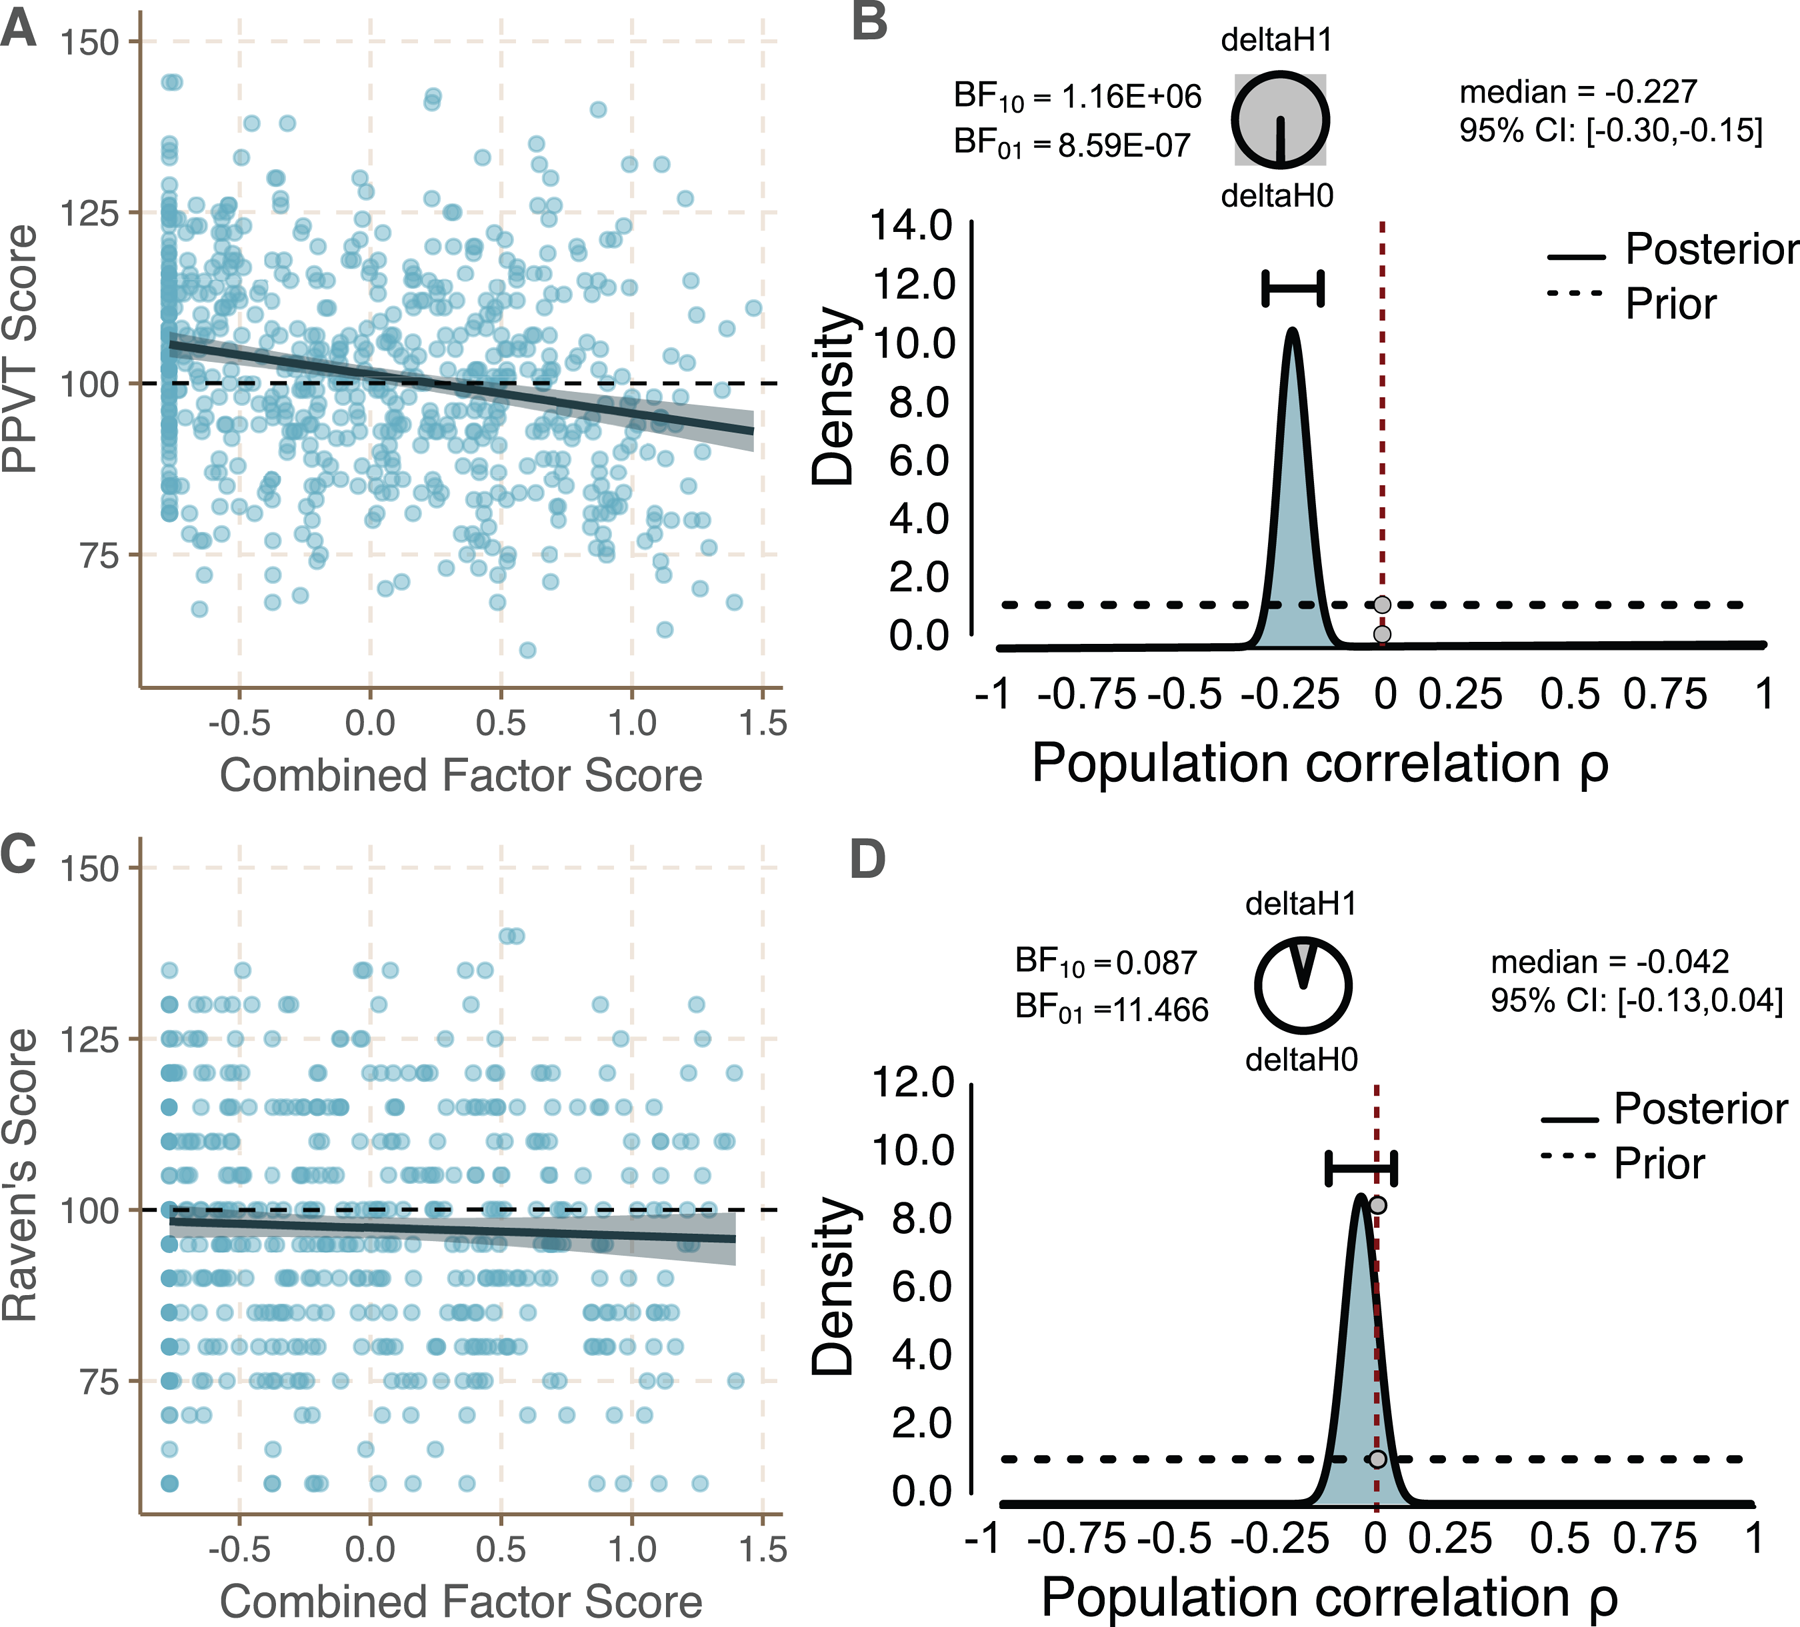
The results of this analysis are shown in Figure 2.
Relationship between bilingualism composite factor score and measures of verbal and nonverbal IQ in children. For each relationship, a scatter-plot is presented on the left, and a Bayesian analysis of the correlation is presented adjacent to it on the right. Upper panels (A and B) describe the relationship between bilingualism and PPVT scores. Lower Panels (C and D) describe the relationship between bilingualism and Raven's nonverbal IQ scores. DeltaH1 refers to the weight or evidence for the alternative hypothesis, while deltaH0 refers to the strength of the evidence for the null hypothesis. BF10 is the Bayes factor associated with the alternative hypothesis while BF01 is the Bayes factor associated with the null hypothesis.

The median posterior rho value for the relationship between the combined factor score and PPVT scores (Verbal IQ) was -0.227, 95% HDI [-0.30, -0.15] suggesting that this factor explained ~5% of the variance in PPVT scores. The Bayes factor associated with this relationship was 1,160,000, suggesting that it is one million, one hundred sixty thousand more times likely that there is a negative relationship between these two variables than no relationship (i.e., the null).
The next analysis examined the relationship between the combined factor score and Raven's nonverbal IQ. Here, the median rho value for this relationship was −0.042, 95% HDI [−0.13, 0.04] suggesting that this factor explained none of the variance in Raven's IQ scores. This was confirmed by a Bayes factor of 0.087, suggesting that it was 11.46 times more likely that there was no relationship between the variables than the alternative.
Older adults
As a first step in running an exploratory factor analysis (EFA), a matrix of polychoric correlations was estimated between all possible pairs for the items of the LSBQ using 125 cases. After inspecting the correlation matrix and removing those items that did not correlate well with others (i.e., had multiple low absolute correlation values <0.3), 25 items were submitted to an initial factor analysis. The initial analysis revealed an additional two items that loaded on two or more factors, and these were dropped before the final analysis was run with 23 items.
The data set was analyzed with an ordinary-least-squares minimum residual approach to EFA using an oblique rotation (promax). The Kaiser-Meyer-Olin measure verified the sampling adequacy for the analysis KMO = .87 (‘meritorious’ according to Kaiser, 1974), and all KMO values for the individual items were >.74, which is above the acceptable limit of .5. Bartlett's test of sphericity Χ2 (253)= 3656.89, p = 0, indicated that correlations between items were sufficiently large for a factor analysis.
An initial analysis was run to obtain eigenvalues for each factor in the data (See Figure 1). Four factors had eigenvalues over Kaiser's criterion of 1, and the first three explained 79% of the variance. The parallel analysis and scree plot was slightly ambiguous and showed inflexions that would justify retaining both three and four factors. Given the smaller sample size we chose the conservative option and retained three factors for analysis which cumulatively explained 74% of the variance.Table 1 shows the factor loadings after rotation for the final analysis (this is also represented graphically in Figure 3).
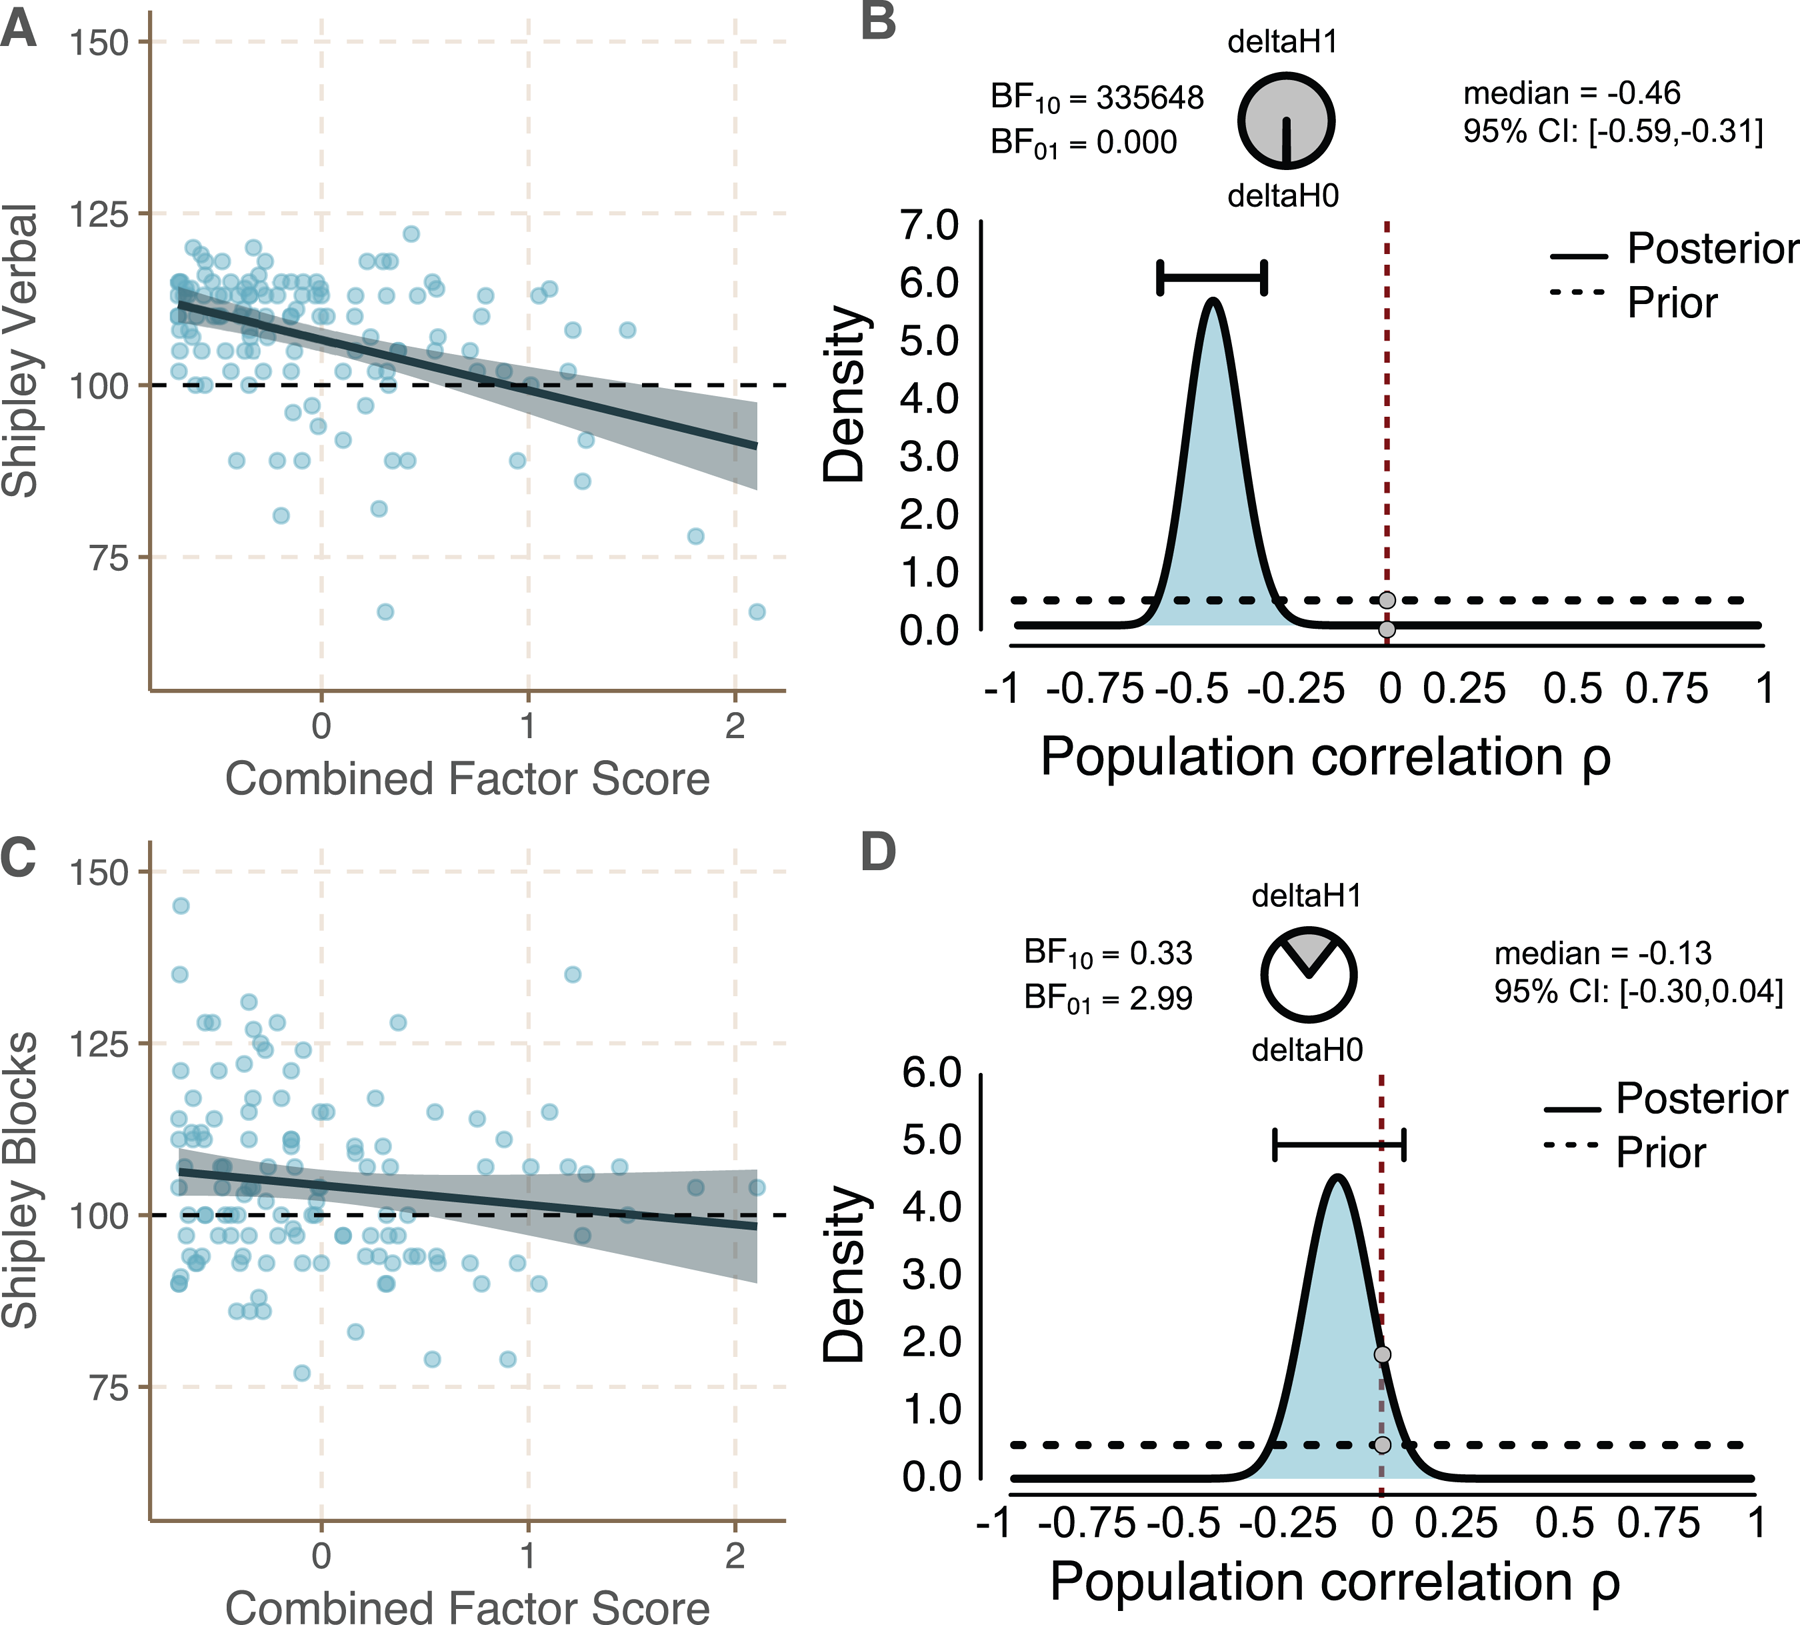
Relationship between bilingualism composite factor and measures of verbal and nonverbal IQ in older adults. For each relationship, a scatter-plot is presented on the left, and a Bayesian analysis of the correlation is presented adjacent to it on the right. Upper panels (A and B) describe the relationship between the composite factor and PPVT scores. Lower Panels (C and D) describe the relationship between the composite factor and Raven's nonverbal IQ scores. DeltaH1 refers to the weight or evidence for the alternative hypothesis, while deltaH0 refers to the strength of the evidence for the null hypothesis. BF10 is the Bayes factor associated with the alternative hypothesis while BF01 is the Bayes factor associated with the null hypothesis.

The items that cluster on the same factors suggest that Factor 1 represents the Non-English Use, Factor 2 represents Non-English Proficiency, and Factor 3 represents English Proficiency. Reliability analyses were conducted for each of the factors using the raw data as input. Factor scores were computed as described for the children's data.
As with the children's results, Bayesian correlations implemented in JASP (2018) were run to assess the relationship between the combined factor score and I.Q. The median posterior rho value for the relationship between the combined factor score and Shipley Verbal scores (Verbal IQ) was −0.46, 95% HDI [−0.59, −0.31] suggesting that the combined factor score explained ~21% of the variance in Shipley Verbal scores. The Bayes factor associated with this relationship was 335,648, suggesting that it is roughly three hundred thirty-five thousand, six hundred forty-eight times more times likely that there is a negative relationship between these two variables than no relationship (i.e., the null). We then examined the relationship between the combined factor score and Shipley Blocks (nonverbal IQ). Here, the median rho value for this relationship was −0.13, 95% HDI [−0.30, 0.04] supporting the possibility of a null relationship. This was confirmed by a Bayes factor H1 of −0.33, suggesting that it was 2.99 times more likely that there was no relationship between the variables than the alternative. These results provide strong evidence for a negative relationship between the combined factor score and verbal IQ, and weak evidence in favor of a null relationship between the combined factor score and nonverbal IQ.
Discussion
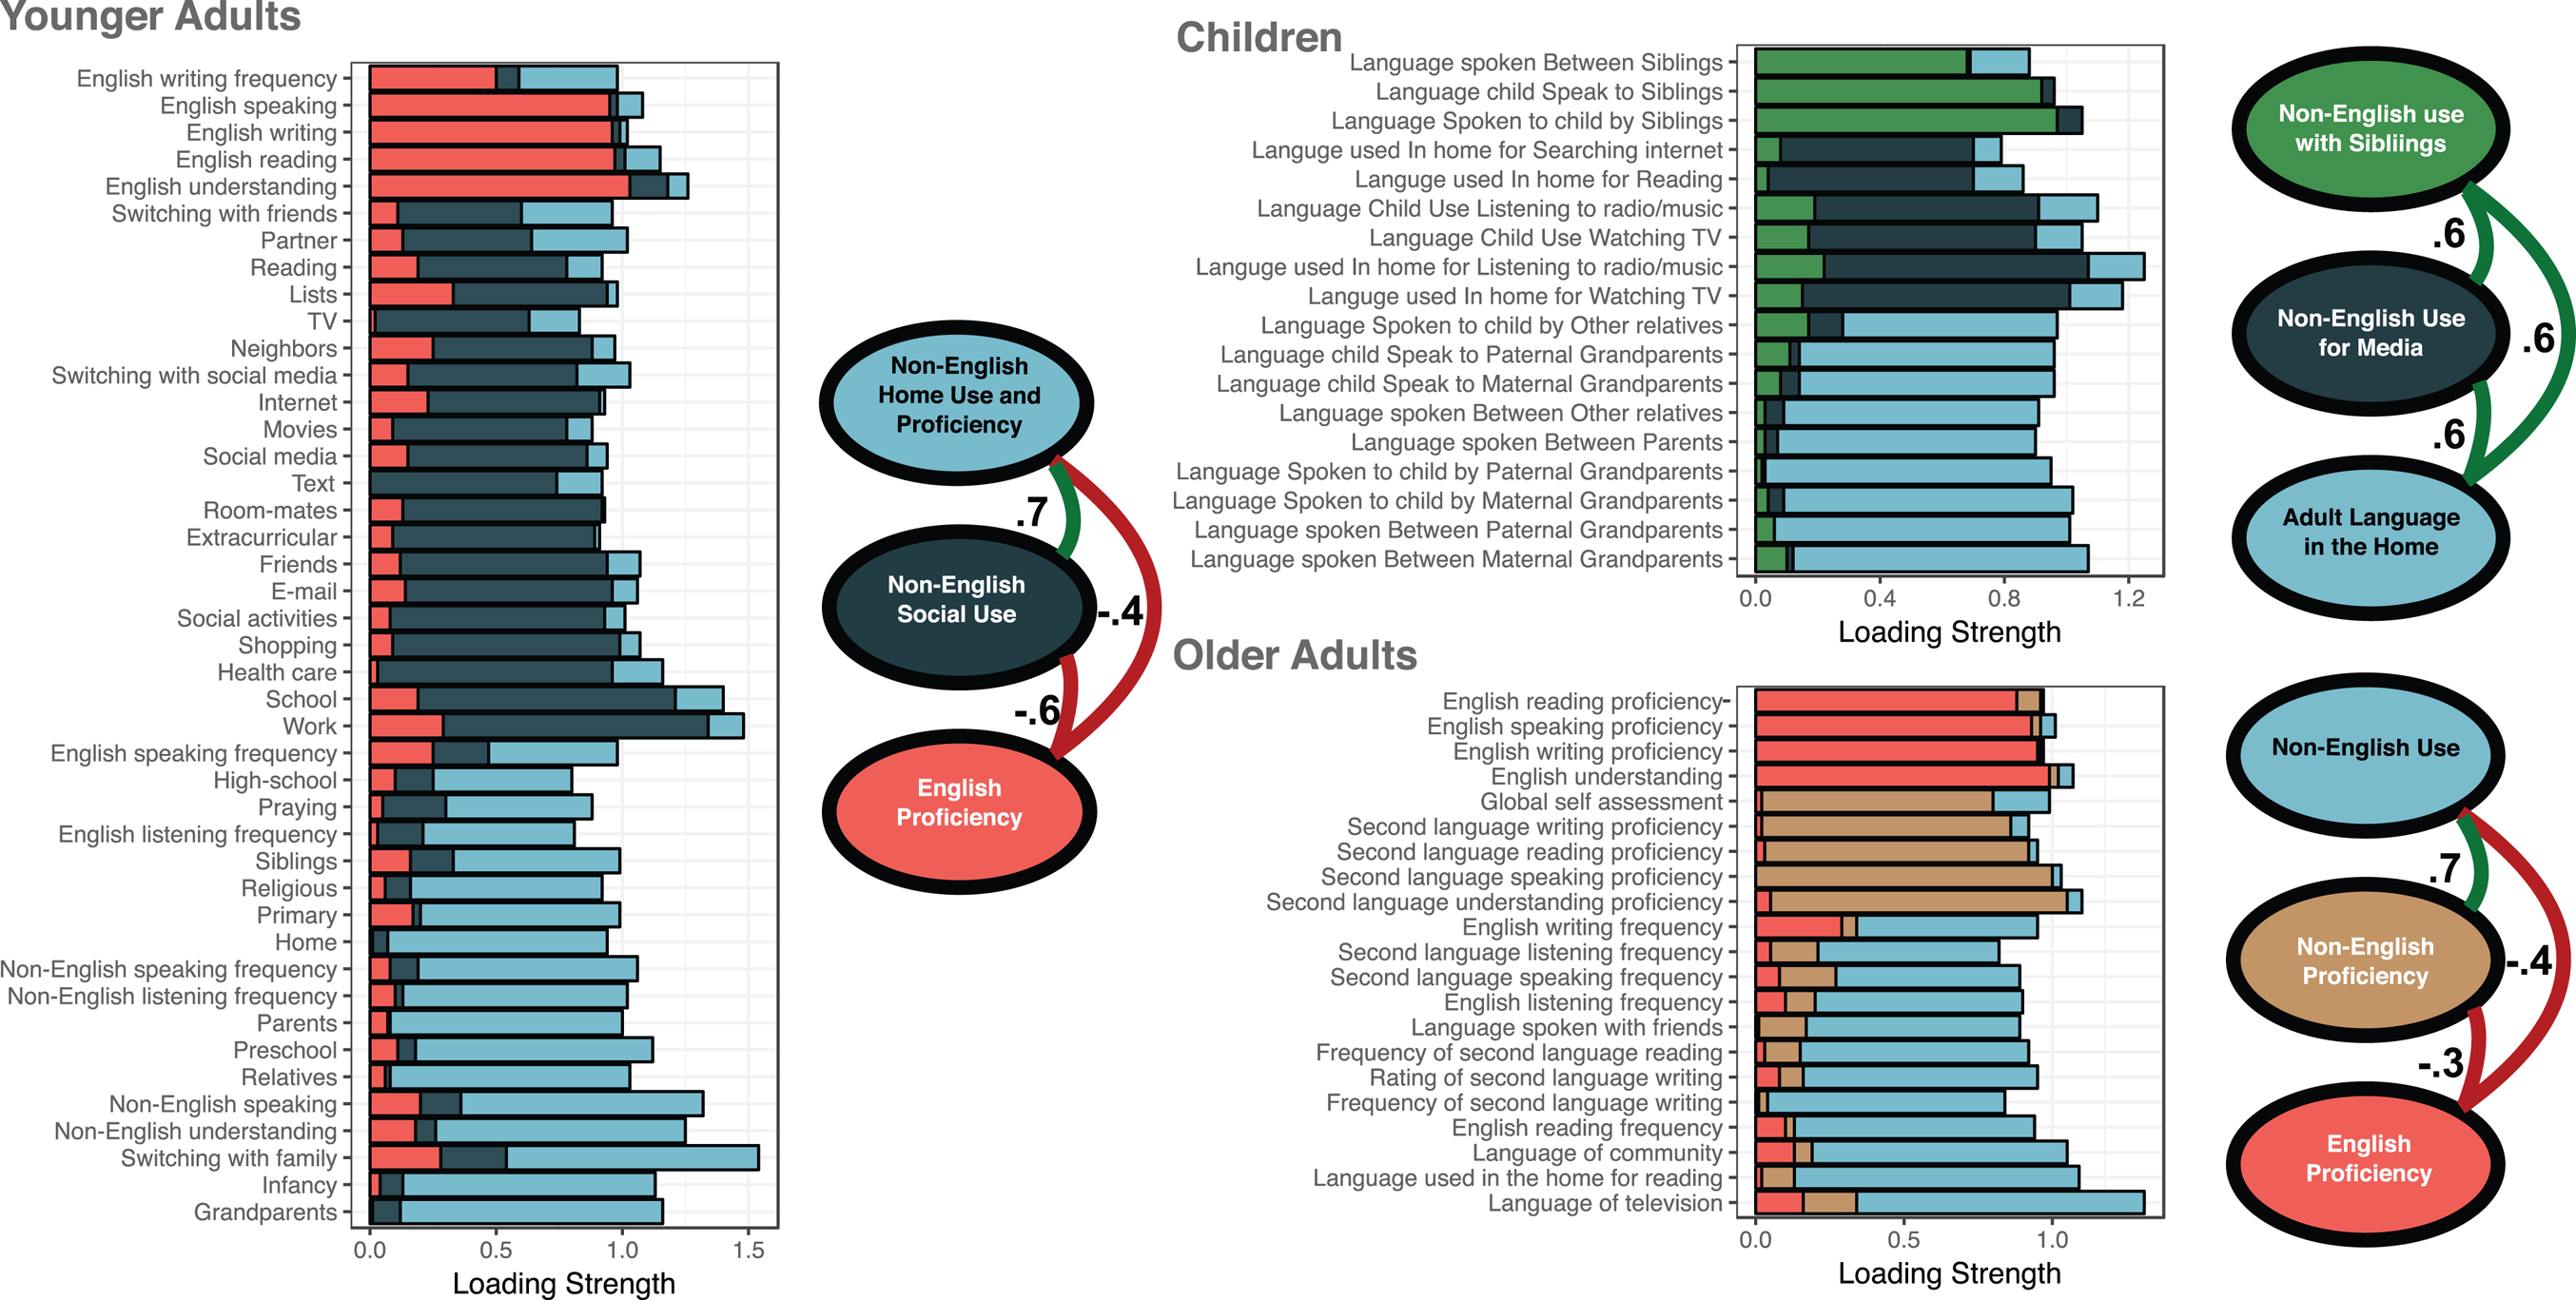
Following our previous work with young adults (Anderson et al., Reference Anderson, Mak, Keyvani Chahi and Bialystok2018) we investigated how linguistic contexts would affect the expression of bilingualism in childhood and older age. Linguistic contexts have been shown not only to affect the expression of bilingualism (e.g., Grosjean, Reference Grosjean1998) but also to influence how context maps onto cognition in a moment-to-moment manner (Green & Abutalebi, Reference Green and Abutalebi2013). Given that social contexts shift across the lifespan, we suspected that these contexts might also emerge in a coherent manner as summary factors to describe bilingual experience at different lifespan stages. We ran two exploratory factor analyses, one for children and one for older adults, to explore this hypothesis (See Figure 4 for a summary across the lifespan).
LSBQ Factor structures across three life periods

In children, we identified three factors: Adult Language in the Home, Non-English use for Media, and Non-English use with Siblings. Of these factors, Non-English use with Siblings predicted the most variance in PPVT scores and media consumption predicted the least. The predictive power of Adult Language in the Home for PPVT fell between these two. A composite factor score calculated from the weighted contribution of each of the three factors predicted PPVT scores nearly as strongly as the sibling factor on its own. When the analysis was allowed to converge on a two-factor solution, the Non-English use for Media, and Non-English use with Siblings factors merged. This suggests that while media consumption on its own may not tell us much about bilingualism, media consumption in the context of siblings may be more informative.
This pattern demonstrates that children's language use is shaped and reflected by the home environment. The combination of the language used by adults in the home to communicate with each other and the language children use to communicate and play with their siblings reflect the extent of their bilingualism. There were 107 children in the sample who did not have siblings, so it is reasonable to ask how the factor structure might change for these individuals. We computed a separate factor analysis for children without siblings by omitting those questions. The analysis produced a two-factor solution in which Adult Language in the Home explained 44% of the variance, and Non-English Use for Media explained 24% of the variance. Thus, the factor structure within the subset of children who lacked siblings was strongly convergent with the finding from the full sample. Therefore, having siblings affords extra information, but lacking this information does not affect the status of the other two factors. Bilingualism in children aged ~ 9 years is thus best characterized by the language behavior of the nuclear family. Notably, the factor solution for children does not include a component for English proficiency as is the case in younger and older adults. However, the current version of the children's LSBQ did not ask parents to assess English proficiency and usage; our assumption was that children's English proficiency was high because they were being educated in English. We suspect that were questions regarding English language proficiency included, this would yield a similar anticorrelated English factor as is seen in younger and older adults.
Questions about the school environment and interactions between parents and children were included in the instrument but were excluded from the analyses for different reasons. Questions regarding the language the child speaks to friends or that the child uses in the school environment were not strongly correlated with other questions, with absolute correlation values less than 0.3. These questions, and by implication the social environment they reflect, thus did not capture the bilingual experience in childhood as well as questions pertaining to the nuclear family. If we were to test teenagers for whom the social environment is paramount, we would expect to see a more substantial role for a social/media factor evident in young adults but not in children. In fact, given that teenagers feel a strong need to associate with peers, the emphasis on the school environment and friends might even be more influential than in young adults who may have achieved more of a balance between work and home.
In contrast, consider questions about the languages children use to speak to their parents. The children's version of the LSBQ contains a number of such questions asking about how often each parent speaks to their child (and in which language), and in return, how often the child speaks to them in the second language. These types of questions did correlate well with others in the questionnaire and were initially included in the analysis. However, the questions were removed once it became clear that they loaded equally onto at least two factors: Non-English Use with Siblings and Adult Language in the Home. Therefore, the questions were providing no independent information that was not already captured by those factors. This pattern reflects the role of the parents as a social bridge between the more direct interaction within the nuclear family and background of adult conversation.
Given that the social landscape expands in young adulthood and shrinks in older age as older adults retire and focus more on family, we expected that the context of second language use might also shift back to the nuclear family and close friends. The factor analysis of the older adult data produced three primary factors: Non-English Use, Non-English Proficiency, and English Proficiency. A weighted composite factor score reflecting overall bilingualism was strongly negatively predictive of Shipley verbal scores. On the surface, this constellation of results appears remarkably consistent with the young adult results first reported in Anderson et al. (Reference Anderson, Mak, Keyvani Chahi and Bialystok2018), summarized in Figure 4. Like older adults, young adults also have an English proficiency factor which, like its homologue in older adults, is negatively correlated with the other two factors relating directly to the second language. Unique to older adults was a Non-English Proficiency factor reflecting self-assessed reading, writing, speaking and understanding scores. When a two-factor solution was forced, this factor merged with the language use factor while the English Proficiency factor remained distinct and anticorrelated.
Not surprising is the emergence of the Non-English Use factor. In older adults this reflects both the frequency with which they use their heritage language and how they use it with friends, their community and to read and watch television. The variance captured by this single factor, Non-English Use, in younger adults is split across two factors, Non-English Home use and Proficiency and non-English Social Use. Media consumption in younger adults is clearly tied to their friends, roommates, and colleagues and reflects a widening of their social sphere beyond the family. The simplification of the factor structure describing how older adults use their second language socially perhaps parallels the simplification of their lives as they focus more on friends and family.
Family use and religious activities, questions reflecting the refocusing on the core social sphere, are not reflected in the final factor solution. The reason for this is that these items loaded strongly onto both the Non-English Proficiency and the Non-English Use factors. Thus, care must be taken not to interpret the apparent lack of family and religion in the model as evidence that these social groups matter less for older adults. The reality is quite different: Family and religion are core social contexts that correlate strongly, but in an undifferentiated manner with both the second language use and proficiency factors.
Across three age ranges, children, young adults, and older adults, language experience and the qualitative nature of bilingualism emerged from and was sustained by changing contexts. In childhood, adult language is the constant backdrop against which children play and interact with their siblings – their parents forming a social bridge between those two worlds. In young adulthood people experience a widening of their social contexts; these items coalesced into a Non-English Social Use factor reflecting work, friends, school, and media all of which become more influential. Finally, in older age, there is a narrowing of the social world once again, though not to the extent seen in childhood. Language use in older adults focuses on close friends and family and select media activities such as reading and watching television.
Across the lifespan, it is clear that bilingualism is a recognizable construct, and it is also clear that this construct relates to cognitive scores in similar ways. Yet the social contexts that define bilingualism shift across the lifespan. Therefore, to accurately capture bilingualism, it is necessary to ask questions that capture the relevant contexts and experiences for that age. In practical terms, one implication of our work is that researchers should not use a single questionnaire to assess bilingualism across the lifespan unless it has been specifically tailored to capture the variance in these specialized populations and their changing contexts. It would be imprudent, for example, to use the young adult version of the LSBQ while attempting to assess bilingualism in children or older adults as it may misrepresent important factors. As we have shown, lifespan research requires a more sensitive approach.
Recognition of the importance of context reflects a reemphasis of earlier research that stressed the idea that languages do not occur in a vacuum (e.g., Cooper, Reference Cooper1969; Green & Abutalebi, Reference Green and Abutalebi2013; Grosjean, Reference Grosjean1998). Early researchers like Cooper stressed that bilinguals who exercised their languages in different language domains could have different outcomes in English proficiency. While Cooper recognized that there were different varieties of bilinguals, shaped by different contexts, later researchers suggested that the influence of context on bilingualism could occur much more rapidly, perhaps even on a moment-to-moment basis (Grosjean, Reference Grosjean1998). Green and Abutalebi (Reference Green and Abutalebi2013) extended the idea that bilingualism is manifested in different contexts and identified three: single language, dual language, and dense code switching. Their model is built on the idea that how languages are used directly impacts the extent and nature of the cognitive abilities and brain regions that are recruited. Our work extends this research by demonstrating first that the context of second language use changes across the lifespan, and second that by taking these varying contexts into account, we are able to extract a stable continuous construct that describes the bilingual experience that is predictive of behavior.