Barack Obama did not obtain a landslide victory in the 2008 presidential election. In the face of economic and political woe without recent precedent, the expectation of an overwhelming win was not unreasonable. He did win, but with just a 52.9 percentage point share of the total popular vote. While not a squeaker, a la 2000 or 2004, the contest still records an electoral opposition of almost half the voting public. We explore the possibility that a landslide eluded him because of race prejudice. Below, we first quantify the extent of the actual Obama margin. Then, we make a case for why it might have been larger. As background, we review evidence of racial bias in the vote, according to various academic opinion surveys and statistical models. Next, we conduct our own analysis of individual-level 2008 presidential election survey data, suggesting the extent of racially biased voting. Ultimately, we offer an estimate of the racial cost, in votes, that Democratic candidate Obama may have paid.
OBAMA WINS, BUT NOT BY A LANDSLIDE
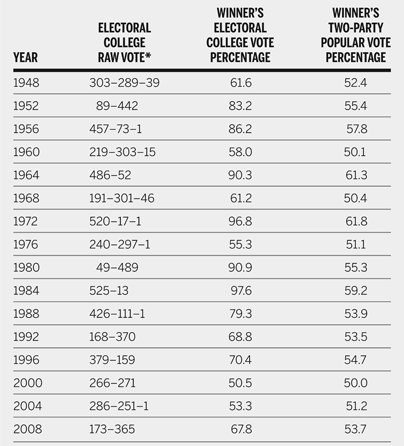
What is a landslide election victory? According to Webster's Ninth New Collegiate Dictionary (Merriam-Webster 1983, 672), it is “a great majority of votes for one side … to win an election by a heavy majority.” While this definition seems reasonable enough, its precise application requires some adjustment, to take into account the aggregating mechanics of the Electoral College. The electoral vote share of a winning candidate correlates highly (at .97) with the two-party popular vote share, but not perfectly. Perhaps the margin of victory looks larger comparing popular vote and electoral vote shares. In table 1 the winning vote shares using these two measures are reported for the presidential elections of the post-World War II period.
Presidential Election Vote Share, 1948–2008

* Incumbent party's vote listed first.
Certain of these victories are landslides, by any measure. For example, in 1964 and 1972, the electoral vote share was over 90%, and the popular vote share was over 60%. But these cutoff percents set too high a bar, excluding almost all the other contests. If one sets the line at 75% of the electoral vote, seven elections cross it: 1952, 1956, 1964, 1972, 1980, 1984, and 1988. Setting the line at 55% for the popular vote share, six cross: 1952, 1956, 1964, 1972, 1980, and 1984 (with 1996 just missing at 54.7). By either measure of the winning margin, electoral vote or two-party popular vote, Obama did not attain a landslide. Instead, he scores almost exactly the middle of these 16 observations (with 67.8% of the electoral vote, 53.7% of the two-party popular vote). A comfortable victory, to be sure, but not an overwhelming one.
This conclusion is underlined by comparison to the landslide Democratic House victory, with a 257–178 seat majority, based on the greatest popular vote margin (district average equals 8.8%) since the 1982 congressional elections (OpenLeft.com). Further, these conclusions are shared in a recent paper by Ceaser and DiSalvo (Reference Ceaser and DiSalvo2008, 1), who have analyzed winning presidential vote shares back to 1896. They determine the Obama victory was “far from being massive, or even unusual.” In contrast, the Democratic congressional success was in the “upper range of congressional victories in a presidential year.” Of course, the fact that the Democratic congressional success was clearly greater hints at the possibility of racial voting, with electors defecting from the party in the presidential race, but not the House races.
THE CASE FOR EXPECTING A LANDSLIDE
Many things were unusual about the 2008 presidential contest. Demographically, there was the race of Obama, the age of McCain, and the gender of the Republican vice-presidential candidate, all firsts. The campaign rhetoric itself contrasted two very different styles of leadership, with two candidates of different experience. And the Iraq war posed a serious issue divide. But, trumping everything was the deepening unpopularity of the man in the White House, and the mounting crescendo of national economic collapse. To borrow the words of V.O. Key (Reference Key1966), if ever the electorate had a chance to star “in its great, and perhaps principal role as an appraiser of past events, past performance, and past actions,” this was it.
In the summer the Gallup percentage approval rating of George W. Bush was in the thirties, falling to 25% in October. These popularity numbers, taken as a series, set a record low for the modern presidency. The economy, by various measures in dismal shape, was declared officially in recession. Compared to previous pre-election economies from 1948, it was at the bottom. Economic growth had actually gone negative only once before, and job-creation numbers were third worst (Lewis-Beck and Tien Reference Lewis-Beck and Tien2009). By the end of December, job losses were expected to be greater than any year since 1945. Over the year, the unemployment rate itself had risen from 4.9% to 6.7%. Finally, the fall financial meltdown, and the ensuing government bailout scramble, heralded the biggest political-economic disaster since the Great Depression.
It is hard to find precedent for these conditions when considering other modern U.S. elections. Perhaps 1952 and 1980 are the closest (Lewis-Beck and Tien Reference Lewis-Beck and Tien2009, 21). In the summer of 1952, President Truman had a popularity of 32%, and GNP growth was near zero. Eisenhower went on to win with 55.4% of the two-party vote. In the summer of 1980, President Carter had a popularity of 21% and negative GNP growth. His opponent went on to win with 55.3% of the two-party vote. With respect to 1980, we might add that the country was experiencing high inflation, skyrocketing oil prices, and a prolonged pre-election overseas hostage crisis. Still, Reagan managed his landslide, even though Carter had the incumbent advantage. Obama, with the “opportunity” to capitalize on economic and political conditions at least as severe, and without the handicap of running against a sitting president, was not awarded a landslide.
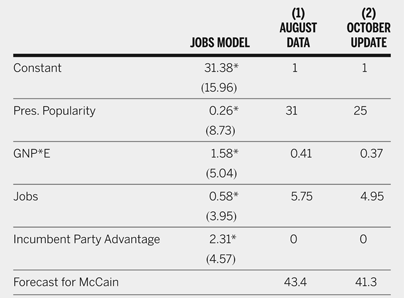
Of course, here we are just comparing one case—2008—to two other cases, 1952 and 1980. However, systematic statistical modeling of all the elections over the period provides an expectation of an overwhelming Obama victory. Lewis-Beck and Tien (Reference Lewis-Beck and Tien2009) offer the Jobs Model to forecast presidential election outcomes, as determined by jobs creation, economic growth, presidential approval, and incumbency advantage (see table 2). In column 1 the model is estimated, on indicators available in the summer of 2008. It foresees an Obama share of 56.6% of the two-party popular vote. Thus, the model over-predicts Democratic candidate share by 2.9 points. This prediction error is troubling, for it well exceeds the model's usual step-ahead forecasting error (median equals .87) over the last six elections (Lewis-Beck and Tien Reference Lewis-Beck and Tien2008, 687). (Certain other forecasters also declared for Obama a bigger victory than he received [see Abramowitz Reference Abramowitz2008; Holbrook Reference Holbrook2008; Lockerbie Reference Lockerbie2008].)
The Jobs Model Forecast for 2008

Notes: Dependent variable equals presidential party share of the two-party vote. Pres. Popularity equals presidential popularity, as measured by the first Gallup Poll in July of the election year. GNP equals gross national product, as percentage change (non-annualized) in GNP (constant dollars) from the fourth quarter of the year prior to the election to the second quarter of the election year; data from the Survey of Current Business. E equals elected president running (scored 1) or not (scored .5). J equals jobs growth, in percentage change in jobs over the first 3.5 years of the president's term; the entries are calculated as follows: number employed in June of the election year minus number employed in January of the inauguration year, divided by number employed in January of the inauguration year, multiplied by 100. The employment numbers are from the Civilian Labor Force (16 years and older), reported in the Bureau of Labor Statistics' Current Population Survey of Households (not seasonally adjusted). Incumbent party advantage is scored 1 if the incumbent party candidate is the elected president (1956, 1972, 1980, 1984, 1992, 1996, and 2004) or following a president who died in office (1948 and 1964), scored 0 if the incumbent party candidate has a tolerable relationship with the previous president (1952, 1976, and 1988), and scored −1 if the incumbent party candidate and the president are not united (1960, 1968, and 2000). An asterisk means statistical significance at .05 one tail; the figures in parentheses are t-ratios N equals the 14 presidential election observations, 1952–2004.
In column 2 the same model appears, but with independent-variable scores updated to include observations post-bailout (but still pre-election). An even more decisive win for Obama is forecast, at 58.7% of the two-party popular vote. Taken at face value, it suggests a shortfall for the Democratic candidate of about 5 percentage points. A separate macroeconomic forecasting analysis, carried out elsewhere, arrives at an almost identical shortfall estimate of 4.8 percentage points. Lewis-Beck and Stegmaier (Reference Lewis-Beck and Stegmaier2009) measure performance on key national economic indicators (disposable income, unemployment rate, housing starts, and consumer sentiment) up through the end of October 2008. Thus, these measures tapped central pre-election macroeconomic activity (but would not have been available for forecasting ex ante). Regressing these macroeconomic variables on incumbent vote share (1952–2008) consistently predicts a Obama victory, with a median shortfall of 4.8 percentage points (predicted vote share minus actual vote share). The suggestion is that, given objective economic conditions, expectations for the Democratic vote were much higher than realized.
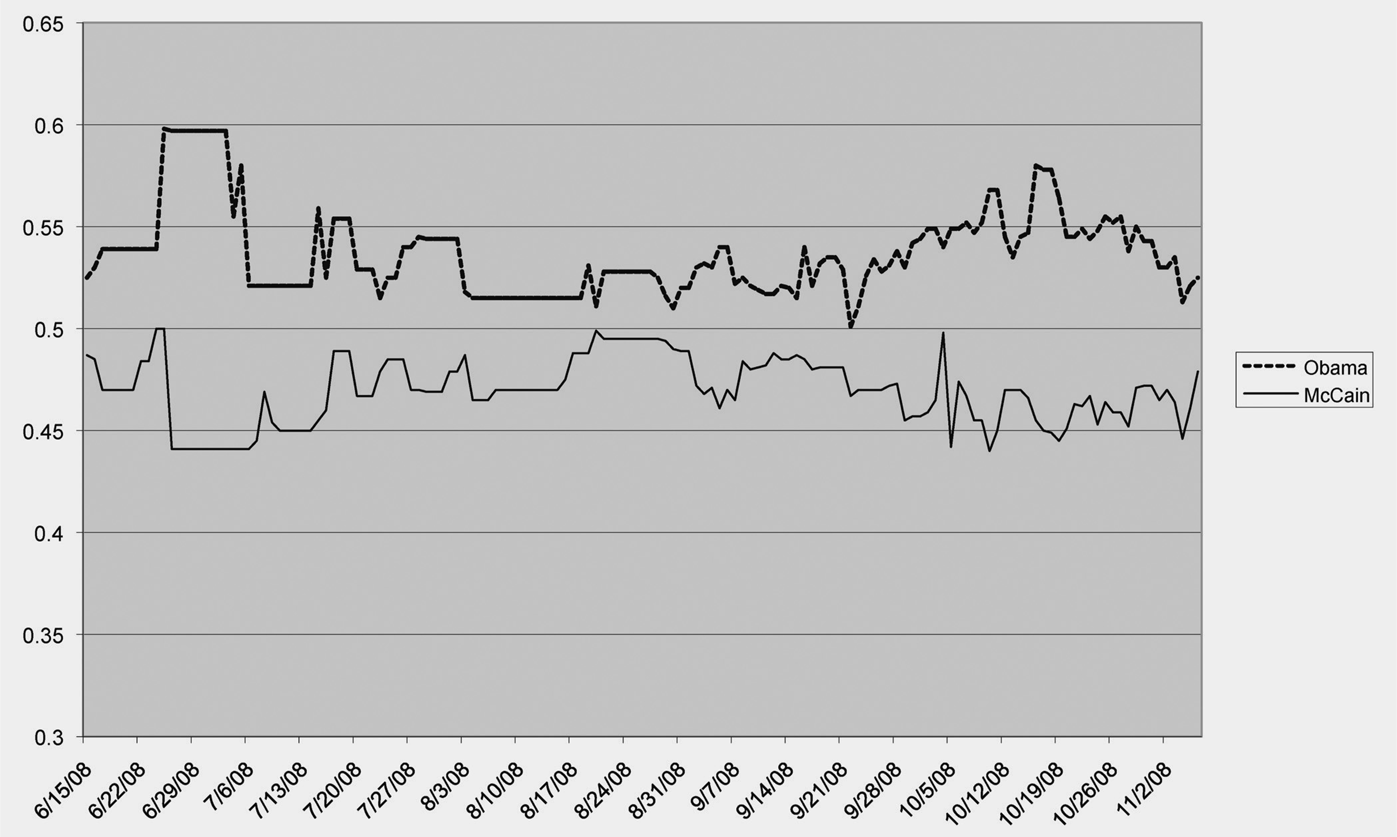
As big as these shortfalls are, perhaps they might have even been bigger. Various other forecasting devices, available mid-summer, even foresaw the possibility of an Obama defeat. The time trends in the polls indicate that, across mid-June to mid-September, Obama support was decreasing, while McCain support was increasing, with the two never that far apart (see the weekly averages from RealClearPolitics.com, in figure 1a). At some points in August and September, McCain actually took the lead. Similar time trends hold with the Iowa Electronic Market (IEM) estimates (see figure 1b). As Campbell (Reference Campbell2008, 17) insightfully observes, “With retrospective conditions so favorable to the Democrats, Obama should have been trouncing McCain both before and during the conventions. But he was not.”
National Poll Weekly Averages of Likely and Registered Voters
Source: http://www.realclearpolitics.com


Only after the bailout, and the unfolding of the economic crisis, did these trends reverse themselves. Note in particular the Obama surge and the McCain sag after September 7, the day the federal government announced the bailout of Fannie Mae and Freddy Mac. An obvious implication is that, without the full force of an economic meltdown, Obama might not only have been denied a landslide, he might have been denied a victory. We think the roots of Obama's relative underperformance electorally can be laid at the feet of race prejudice. Of course, given the uniqueness of Obama's candidacy, and the political sensitivities attached to the race issue, such a thesis is not easy to demonstrate. In a thoughtful analysis of the forces determining the choice of 2008 U.S. presidential voters, Campbell (Reference Campbell2008, 17) concedes that “race may or may not have played a role,” but brings no data to bear on the question. Certainly, the data problems here loom large. Below, we first marshal relevant, if indirect, evidence on the question. Then we directly analyze 2008 presidential election survey data in an attempt to quantify the racial cost, if any, of the Obama candidacy.
THE POSSIBILITY OF A RACIAL COST: RELATED SURVEY FINDINGS
Public-opinion surveys are indispensable tools for understanding American political behavior (Lewis-Beck, Jacoby, Norpoth, and Weisberg Reference Lewis-Beck, Jacoby, Norpoth and Weisberg2008). But they can be a clumsy tool for the detection of any links between racial attitudes and voting. First is the long-standing social-desirability problem, where respondents may be reluctant to express their true feelings about people in different racial categories.Footnote 1 Such a situation can lead to a serious overestimation of positive racial attitudes (Krysan Reference Krysan2000). This problem has been regarded as severe in the traditional, face-to-face survey. For example, a 1990s questionnaire asked whites whether they would vote for an African American candidate. In the face-to-face survey only 11% said they would not; however, in the mail survey that number doubled, to 22%. (The complete results from this investigation of privacy effects on the expression of racial attitudes appears in Krysan [Reference Krysan1998].)
A recent, nationally representative probability survey used the ingenious method of the list experiment in an attempt to eliminate this social-desirability effect (Heerwig and McCabe Reference Heerwig and McCabe2007). In the control group, subjects were asked to indicate their support (0 or 1) for each of three political issues. In the treatment group, subjects were asked to indicate their support on each of the same three political issues, plus a fourth issue—would you support a black presidential candidate? Always, the respondents were asked to say how many of the statements they supported, but not which specific ones. (Thus the respondent could keep his or her racism hidden.) Then, the difference in the mean scores between the two groups estimates the percentage not supporting a black candidate. Suppose the mean of the control group is 1.0, and the mean of the treatment group is 1.6; then in the former the average respondent supports one statement, while in the latter it would be 1.6 statements. Given random assignment of subjects to treatment, one infers that 60% of the respondents would support a black presidential candidate.
The actual estimation in this study, among declared voters, is 77% support, suggesting a large racial cost. Naively, it implies a penalty of 23 percentage points, in terms of two-party popular-vote loss. A weakness of this estimate is that it was taken in June 2007, near the launch of the Obama candidacy. Therefore, some respondents may have said they did not support a black presidential candidate, meaning to them Obama because, for example, they preferred Clinton or Edwards. In other words, ideology, not racial prejudice, motivated their answer. Secondly, this study does not examine voting behavior for the 2008 election itself. (And, in another list experiment that does look at 2008, these results are contradicted.)Footnote 2 Thus, while innovative and highly suggestive, we do not rely on list-experiment evidence for our racial-cost estimate.
In another national survey (Internet) just after the election itself, Sniderman and Stiglitz (Reference Sniderman and Stiglitz2008) thoroughly explore racial prejudice and 2008 vote choice. They find that American voters do not hesitate “to make frankly derogatory comments about blacks.” For example, about one out of five whites surveyed described “most blacks” as “violent”; essentially the same fraction also described them as “boastful”; almost one out of three said they were “complaining.” Overall, the investigators ranked 10% of respondents as high scorers on a prejudice index (built from five items). Among Republicans, variation in this prejudice index does not significantly relate to declared votes for Obama. However, among Democrats, the effect is significant and strong; for those in the bottom third on the prejudice index, 95% voted Obama; but for those in the top third the percent drops to 62, for a difference of minus 33 points. This large defection appears partially offset by voters who view blacks with “esteem.” Considering those in the bottom third on this esteem index, 77% voted Obama; but for those in the top third the percentage rises to 96, for a difference of +19 points. (Relatedly, Craemer et al. [Reference Craemer, Shaw, Edwards and Jefferson2009] report that some white voters may have come to a psychological closeness to Obama, enabling them to vote for him.)
Using these above differences, as reported in Sniderman and Stiglitz (Reference Sniderman and Stiglitz2008), we go on to take the positive esteem number (+19) from the negative prejudice number (−33), implying a 14-point loss among Democrats. While that calculation suggests to us a substantial racial cost, translation of that number into a precise vote estimate remains uncertain, and the authors themselves do not offer any such calculation. However, that task is carried out by Aistrup, Kisangani, and Piri (Reference Aistrup, Kisangani and Piri2009) in their analysis of a pre-convention survey from the South. In a logistic regression model, with the dependent variable vote intention for McCain or Obama, and under extensive controls (e.g., ideology, party identification, SES), they find racial resentment has a strong impact. For example, among Democrats, when the race resentment index shifts upward one standard deviation, the probability of a McCain vote increases from about 40% to 58%. Unfortunately for our purposes, this survey confines itself to one part of the country.
According to the above survey investigations of Aistrup, Kisangani, and Piri (Reference Aistrup, Kisangani and Piri2009), and our own interpretation of Sniderman and Stiglitz's (Reference Sniderman and Stiglitz2008) data, the racial cost charged to the Obama vote could be sizeable. In complete contrast, Ansolabehere and Stewart (Reference Ansolabehere and Stewart2009), again using survey data, argue that the Obama vote actually benefited from his race. To quote: “Obama won because of race—because of his particular appeal among black voters, because of the changing political allegiances of Hispanics, and because he did not provoke a backlash among white voters” (Ansolabehere and Stewart Reference Ansolabehere and Stewart2009). Overall, Obama gained 10 million more votes than Kerry did in 2004—4.3 million of them from blacks, 2.7 million of them from Hispanics. According to the exit-poll data they examine, blacks voted 95% Democratic (up from 88% in 2004); Hispanics voted 67% Democratic (up from 56% in 2004); whites voted 43% Democratic (up only 2% from 2004). The authors assert: “had Blacks and Hispanics voted Democratic in 2008 at the rates they had in 2004, McCain would have won.” Thus, the rate hikes among these two key minority populations “proved decisive.”
The Ansolabehere and Stewart study, taken at face value, suggests that, rather than a racial cost in the 2008 election, there was a racial benefit. While we accept the facts reported by Ansolabehere and Stewart, we take them as descriptive rather than causal. They do suggest, unsurprisingly, that the percentage of blacks who voted Democratic rose a bit over 2004, because of black group identification. But that group identification argument would not seem to explain the increase in the Hispanic vote, which may actually have been motivated by the economic downturn, for example.
Most importantly, they do not address why white vote support for the Democrats barely increased. It is true that, since Obama won in 2008 and Kerry lost in 2004, he would inevitably have obtained more votes, from virtually all groups. But the real question is why more from some than from others. In the end, the compositional analysis of Ansolabehere and Stewart actually underlines the strong racial character of the vote choice. Recall the estimated percentage differences in the Obama vote: white equals 43%; Hispanic equals 67%; black equals 95%. These numbers show the strong correlation between race and vote. Given that the largest racial group, by far, is white, it seems reasonable to hypothesize that race cost Obama votes.
Different compositional evidence from another examination of exit-poll data, by some members of the above team, actually supports the racial-cost argument. Persily, Ansolabehere, and Stewart (Reference Persily, Ansolabehere and Stewart2009) find that Obama did worse than, or the same as, Kerry among white voters in Alabama, Arizona, Arkansas, Georgia, Louisiana, Mississippi, Missouri, New Mexico, Tennessee, and West Virginia. They compare states with a history of racial prejudice (covered states under Section 5 of the Voting Rights Act) to other states in an amicus curiae brief and find that Obama “appeared to make no gains among white respondents in the covered jurisdictions” (Persily, Ansolabehere, and Stewart Reference Persily, Ansolabehere and Stewart2009, 7). Most telling, their brief shows apparent racial voting against Obama occurred most strongly in covered states, where he won only 26% of the white vote compared to 48% of the white vote in non-covered states.
A further investigation of exit-poll data, by Klarner (Reference Klarner2008), concludes in favor of the racial-cost argument. He contends “the influence of racial prejudice on voting patterns was evident and substantial in the election.” Theoretically, his work is motivated by the racial-threat hypothesis, which argues that whites exhibit more race prejudice when there are more blacks where they live (Dixon Reference Dixon2006; Taylor Reference Taylor1998). His dependent variable, percentage of whites surveyed who declared a vote for Obama, is usefully aggregated to the state level, where individual votes translate into the decisive electoral vote. In a regression analysis (OLS) he finds that the size of the state's black population significantly depresses the Obama vote, even after imposition of heavy controls (in particular the lagged dependent variable, Kerry vote in 2004).
That regression coefficient (b equals −.21), multiplied by the state's percentage black population (multiplied by the state's white population proportion) yields an estimate of the votes Obama lost due to race (Klarner Reference Klarner2008, table 1, model 4). This number varies widely by state, from virtually nothing in states such as Vermont where there are almost no blacks to 5 percentage points in a state such as Mississippi, with a large black population. Once the percentages are appropriately weighted by party vote shares state by state, the estimate is a national-level loss of 2.1% of the two-party vote.Footnote 3 Klarner (Reference Klarner2008) is to be applauded for taking on the task of arriving at a precise estimate on the net Democratic vote loss from racial prejudice. Lamentably, the inference ultimately rests on aggregate data at the state level. Further, state-level data do not offer a strong test of the threat hypothesis, which more often applies to smaller collections of people, such as communities.
THE RACIAL COST IN THE 2008 VOTE: A SURVEY-BASED MODEL
Thus far, our discussion of racial costs in the 2008 contest has been largely indirect, in two senses. First, it began with aggregate-level data. Second, when dealing with individual-level survey data, it has offered only secondary analysis. Here we examine directly fresh election survey data, which we helped gather, on the 2008 contest. In a separate work, we analyze these Cooperative Campaign Analysis Project (CCAP) data, consisting of a national Internet survey. The model offered demonstrates the strong impact of economic evaluations on the 2008 vote choice, but ignores the issue of racial cost (Lewis-Beck and Nadeau Reference Lewis-Beck and Nadeau2009). Among other effects, retrospective sociotropic assessment of the economy substantially shifted votes. For example, those who thought the economy was “much worse,” as compared to those who thought it was “improved, or the same,” were 43% more likely to declare a vote for Obama. We use that model to frame the specification we develop below. It is useful to examine, by way of introduction, some simple interaction patterns of race, economics, and the Obama vote.
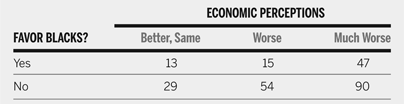
Respondents were asked, “which of the following groups in society do you think will be favored if Barack Obama is elected president?” Among all respondents, 56% said yes, Obama would favor blacks; 46% said no, he would not. This variable appears to heavily tap racial sentiment and the vote: among those yeses, only 32% said they would support Obama, in contrast to 80% among those nos. In table 3, a standard retrospective sociotropic item on the economy is related to Obama vote intention, within the two groups (yes v. no).
Obama Vote as a Function of Racial Attitudes and Economic Perceptions

Note: Entries are voting intentions for Obama. Favor blacks: “Which of the following groups in society will be favored if Barack Obama is elected president? Blacks? Yes, no, don't know.” Economic perceptions: “Would you say over the past year the nation's economy has gotten much better, gotten better, stayed about the same, gotten worse, or gotten much worse?”
Source: Cooperative Campaign Analysis Project (N = 12,421).
In both groups, one observes strong economic effects. That is, the greater the perception of a deteriorating economy, the more likely the respondent is to support Obama. However, the relationship is much weaker among those who believe Obama would favor blacks. Examining percentage differences between the two extreme categories (“improved, same” v. “much worse”), it is 34 percentage points for the yes group, but 61 percentage points for the no group. Clearly, those who felt Obama would give blacks special treatment were much less likely to translate their economic grievance into a vote against McCain. This potentially cost Obama many votes, especially so since this yes group was in the majority.
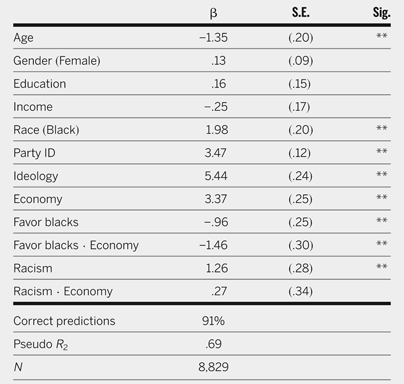
One counterargument, discussed above over the work of Sniderman and Stiglitz (Reference Sniderman and Stiglitz2008), is that racial esteem for blacks might actually generate votes for Obama, thereby offsetting the votes lost to racial prejudice. Let us test this argument. To measure racial prejudice, we use the item reported above on whether Obama favors blacks. To measure racial esteem, we employ an item that asks whether blacks are worse off because of the historical and continuing effects of discrimination and racism. Respondents were asked how much they agreed with the following statement: “Generations of slavery and discrimination have created conditions that make it difficult for African Americans to make their way out of the lower class.” In table 4, a multivariate equation of the 2008 vote is estimated in a logistic regression. The model specification holds vote as a function of socio-demographics, party identification, ideology, and retrospective sociotropic economic evaluation (E). To this standard political behavior frame is added the above variable on “favoring blacks” (F), and the interaction term, E·F. Also added is the above variable on racism (R) and its interaction term, E·R.
Multivariate Logistic Regression Model of the Obama Vote

** p ≤ .01, two-tailed tests.
Note: Dependent variable equals 1 if voting intention for Obama, 0 otherwise. Party ID equals 0 for Republicans, .5 for independents, and 1 for Democrats. Economy equals 0 for much better, better, and the same; .5 for worse; and 1 for much worse. Favor blacks equals 1 if respondents think the election of Obama will favor blacks and 0 otherwise. Racism equals 1 if respondents agree (strongly or somewhat) that “generations of slavery and discrimination have created conditions that make it difficult for African Americans to work their way out of the lower class.” Control variables: Age (in years), Gender (Female), Education (seven categories), Income (14 categories), Race (black), Ideology (Scale ranging from 0 [very conservative] to 1 [very liberal]; DKs = .5). The pseudo R 2 is McFadden.
One observes that the model fits the data well, and demonstrates the usual pattern of significance and sign, on the socio-demographic, party, ideology, and economic variables. What captures our attention are the racial-sentiment variables, and their interactions. Note, first, that the above reported relations (of table 3) on racial prejudice, economics, and Obama support continue to stand. That is, those who believe Obama favors blacks are significantly less likely to vote for him, even in the face of these extensive control variables. As well, the interaction term is strongly significant, suggesting that voters who believe Obama shows black favoritism are much less likely to convert their economic dissatisfaction into a vote for Obama.
Is this negative racial charge canceled out by a positive one, coming from a sympathetic attitude toward blacks? Those who believe that blacks are worse off because of the continuing effects of racism are more likely to vote for Obama, thus directly offsetting those who would vote against him because he favors blacks. However, the negative interaction effect the economic vote receives is not balanced by a positive one. That is, those who are more sympathetic toward blacks are no more likely to convert their economic discontent into an Obama vote. Thus, racial esteem does not cancel out racial prejudice, at least according to this evidence.Footnote 4
CONCLUSION: AN ESTIMATE OF THE RACIAL COST IN THE OBAMA VOTE
Overall, it appears Obama would have lost many votes to this racial asymmetry indicated in table 4. How many? We can estimate that net loss, following certain reasonable assumptions. Our central claim is that racial resentment depressed a certain amount of economic voting. A simple way to apply this notion involves eliminating this depression effect, ceteris paribus. That is, first set the value of the interactive variable (favor blacks multiplied by economy) at 0, implying no racial resentment. This yields an economy coefficient of 3.37. Second, set the value of the interactive variable (favor blacks multiplied by economy) at 1, implying the presence of racial resentment. This yields an economy coefficient of 1.91 (i.e., 3.37 − 1.46 = 1.91).
Now estimate the impact of a unit change in the economic variable on the probability of an Obama vote (computed from its mean). Under the no racial resentment condition, the probability change is .46; under the racial resentment condition, the probability change is .37. Observe that racial resentment reduces the impact of the economy by 9 percentage points (.46 minus .37) in a group (those who believe Obama favors blacks) that composes 56% of the sample. Multiplying the racial resentment effect on economic voting by the size of the group experiencing it lowers the net vote for Obama by about 5 percentage points (.09 · 56 = 5.04).
We are encouraged to accept this estimate. The logistic regression equation of table 4 offers a fairly full specification of vote choice in the 2008 contest. In addition to the high pseudo R-squared, it correctly predicts 91% of the cases. Along side the standard long-term forces of socio-demographics and party identification, ideology is included. Besides controlling on general liberal-conservative orientation, the ideology variable allows accounting for a number of specific issues, such as welfare attitudes, lifestyle preferences, and foreign policy beliefs (on this point, see Lewis-Beck et al. Reference Lewis-Beck, Jacoby, Norpoth and Weisberg2008, 223–29). Further, some have contended that racial resentment is actually but a component of ideological thinking. We observe here that, even controlling for liberalism/conservatism, our measures of racial sentiment register a strong independent effect. (While candidate experience is not in the model, when it was included substantive results did not change. See details in the note.Footnote 5) Last, but not least, we are encouraged to accept this estimate because of its cross-validation from the aggregate forecasting methods discussed early on.Footnote 6 If accepted, these findings, taken together, account for why Obama got the vote share he got, instead of the landslide that could have been expected. Race appears to have imposed a real cost on his electoral margin.