Invasive species have well-documented detrimental effects on native vegetation (Hejda et al. Reference Hejda, Pyšek and Jarošík2009; Levine et al. Reference Levine, Vila, Antonio, Dukes, Grigulis and Lavorel2003; Powell et al. Reference Powell, Chase and Knight2011; Vila and Weiner Reference Vila and Weiner2004). Measures used to control invasive plants can have unwanted impacts on non-target species. Impacts can be caused by the application method itself, such as herbicide drift, or from the actions of the applicators, such as trampling and soil compaction. Adjusting application timing to earlier in the year can be an effective way to reduce impacts if non-target vegetation is not in leaf in the winter (Frey et al. Reference Frey, Herms and Cardina2007).
Chemical treatment of woody plants is possible in any month of the year. Treating early in the year is more difficult for perennial herbaceous plants, as they must be in leaf for most chemical methods to work. However, when target herbs are in leaf, non-target herbs may also be in leaf. In our work managing invasive plants for the National Park Service, fig buttercup (Ranunculus ficaria L.) presents this sort of difficulty; R. ficaria has a life history that overlaps with native spring ephemeral species. Ranunculus ficaria is in leaf starting in November and ending in May or June. Native spring ephemerals are in leaf starting in February and ending in May. Spring ephemerals are sensitive to disturbance (McLachlan and Bazely 2001) and have been documented to be in decline in eastern forests (Brewer Reference Brewer1980; Taverna et al. Reference Taverna, Peet and Phillips2005). In addition to playing an integral role in the functioning of eastern forests (Gilliam Reference Gilliam2007), spring ephemerals increase the number of park visitors. Therefore, treatment of R. ficaria must be done strategically to minimize impacts on co-occurring native ephemeral plants.
Ranunculus ficaria is a perennial herb up to 30-cm tall with yellow flowers 10- to 18-mm wide (Gleason and Cronquist Reference Gleason and Cronquist1991). Roots are generally fibrous and produce tubers 5- to 100-mm long (Taylor and Markham Reference Taylor and Markham1978). Ranunculus ficaria is native to northern Africa, temperate Asia, and most of Europe (USDA, ARS 2017). The oldest collection record in the United States is an herbarium collection from Pennsylvania in 1867 (Axtell et al. Reference Axtell, DiTommaso and Post2010). It was reported [as Ficaria ficaria (L.) Karst] as far west as Ohio in 1899 (Kellerman Reference Kellerman1899). In North America the species is now reported in most states east of the Mississippi River (Cote Reference Cote2011, cited in Marlow et al. Reference Marlow, Beacham and Stringer2014; University of Georgia Center for Invasive Species and Ecosystem Health 2017; Marlow et al. Reference Marlow, Beacham and Stringer2014; USDA, NRCS 2016). It has also been reported in Texas, Missouri, Washington, and Oregon (USDA, NRCS 2016). Outside North America it has been reported in Japan, Iceland, and New Zealand (GCW 2016). Ranunculus ficaria appears to occur in areas with yearly rainfall totals above 800 mm or where supplemental irrigation is present (Post et al. Reference Post, Krings, Wall and Neal2009).
Management Implications
Early-season foliar glyphosate applications were effective at controlling fig buttercup (Ranunculus ficaria). We treated at the phenological stage before the target population had any plant in flower (preflowering) in 2013. Due to unfavorable weather, we were not able to repeat this treatment for a second year. Treatment of preflowering for 1 yr resulted in approximately 60% control. Treatment at two later phenological phases (early flowering and 50% flowering) for 2 yr resulted in approximately 90% and 95% control, respectively. The preflowering treatment may have faced factors that reduced herbicide–plant contact or efficacy.
There was little evidence for any impact of treatment on the cover of native vegetation. However, the loss of R. ficaria cover allowed the nonnative annual Japanese stiltgrass (Microstegium vimineum) to increase. This result highlights the importance of good site assessments and multiple treatment events per year to address secondary invasion. The aboveground life histories of M. vimineum and R. ficaria have limited overlap (November to June and April to August, respectively). Nevertheless it appears that R. ficaria has a substantial negative effect on M. vimineum. Further work is needed to determine what the mechanism for this effect is.
Practitioners who use growing degree days (GDD) to schedule treatment can help ensure that the timing of control efforts is biologically appropriate. GDD provide a better predictor of plant development than calendar days for both annual and perennial plants. Although limited data were available about the relationship between GDD and R. ficaria phenology, GDD have been used for modeling the change in distribution of this species in Europe under climate change scenarios. Our results suggest that practitioners should begin treatment as soon as a single flower emerges in the target population.
It is likely that the rates of glyphosate applied in the study described here (2.10 kg ai ha−1) were higher than needed. We have found that an average application rate of 0.90 kg ai ha−1 has been sufficient to control R. ficaria.
Ranunculus ficaria spends much of its life underground; the first leaves to appear on plants in many populations in northern Virginia emerge as early as November; leaves have almost completely senesced by June 1. Flowers emerge in March and early April and have typically senesced by mid-May. After flowering, some subspecies produce bulbils in the leaf axils (Sell Reference Sell1994). The aerial bulbils store starch and have adventitious buds, similar to subterranean tuberous roots (Axtell et al. Reference Axtell, DiTommaso and Post2010). The plant remains dormant until leaves emerge the following fall or winter. Because its life cycle overlaps with spring ephemerals, R. ficaria competes with native herbs for light and space. Invasive plants that emerge earlier in the growing season than the native plants they grow with may be especially competitive (Rejmánek Reference Rejmánek2013). Allelopathic properties of the species have been reported (Cipollini and Bohrer Reference Cipollini and Bohrer2016; Cipollini and Schradin Reference Cipollini and Schradin2011; Cipollini et al. Reference Cipollini, Titus and Wagner2012; Masters Reference Masters2014) but are disputed (Del Fabbro et al. Reference Del Fabbro, Güsewell and Prati2014; Masters and Emery Reference Masters and Emery2016).
While glyphosate is known to control R. ficaria, there is a need for field studies to determine the best strategies for control (Axtell et al. Reference Axtell, DiTommaso and Post2010). Land managers often start treating R. ficaria when they start to see many flowers (MN Frey, personal observation). However, because the leaves of R. ficaria remain green throughout the winter, foliar chemical control before any flowers are produced could be an option. In the mid-Atlantic region, glyphosate is the herbicide most commonly used for foliar treatment of R. ficaria (MN Frey, personal observation). Although low temperatures can slow the absorption and translocation of glyphosate (Devine and Bandeen Reference Devine and Bandeen1983; Reddy et al. Reference Reddy2000), glyphosate applied at temperatures as low as 2.2 C (36 F) effectively controlled winter annual weeds (Hasty et al. Reference Hasty, Sprague and Hager2004; Loux and Dobbels Reference Loux and Dobbels2001), and glyphosate applied down to −4.2 C (25 F) air temperatures controlled the biennial garlic mustard [Alliaria petiolata (Bieb.) Cavara & Grande] (Frey et al. Reference Frey, Herms and Cardina2007). Successful cold weather treatments on annual and biennial species suggest that overwintering weed species such as R. ficaria might be susceptible to glyphosate during the winter. However, the lower temperature limits constraining glyphosate efficacy have not been evaluated for R. ficaria. Glyphosate application can help to release native species from competition with R. ficaria and may help non-target species better compete with R. ficaria. Treating R. ficaria early in the year before the native species achieve maximum leaf coverage reduces the risk of collateral damage to native spring ephemerals from trampling and herbicides.
Here we report on a study designed to determine how early (measured phenologically) we could successfully treat R. ficaria with a foliar glyphosate application. Spring ephemeral plants in our area can begin to emerge as early as February, although the forest floor is not usually densely covered with native spring ephemeral plants until late March or early April. Frey et al. (Reference Frey, Herms and Cardina2007) observed that glyphosate treatment led to a marked decline of A. petiolata under near-freezing conditions. Because R. ficaria and A. petiolata are both green during the winter and spring we expected to observe a similar decline in R. ficaria cover after 1 yr for all treatments as long as temperatures at the time of treatment were above freezing.
Materials and Methods
Our study area (Wolf Trap National Park for the Performing Arts) occupies approximately 47.3 ha (117 ac) in Fairfax County, VA. Approximately 21 ha (52 ac) within the park remain undeveloped. The plots were established in a forest dominated by yellow poplar (Liriodendron tulipifera L.) and red maple (Acer rubrum L.) in the canopy, spicebush [Lindera benzoin (L.) Blume] in the shrub layer, and R. ficaria and Japanese stiltgrass [Microstegium vimineum (Trin.) A. Camus] in the herb layer. The forest had pockets of wet areas where the herb layer was dominated by skunkcabbage [Symplocarpus foetidus (L.) Nutt.] and sensitive fern (Onoclea sensibilis L.).
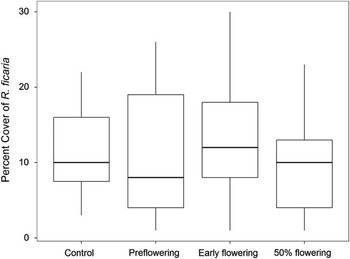
We established five blocks of twelve 1 by 1 m treatment plots in January 2013. Each block included four treatments, with each treatment applied to three plots. Blocks did not differ in terms of R. ficaria cover at establishment (Figure 1). Each of the five blocks was distributed arbitrarily in a zone that had moderate cover of R. ficaria at the end of January 2013. Each block was separated by arbitrarily selecting a direction and randomly selecting a number of paces (from 3 to 10) to walk. Within each block 12 plots (3 per treatment) were located by tossing a pin flag over an author’s back, locating the flag, and randomly selecting a compass bearing (1° to 360°). The compass bearing established the layout of the diagonal of the 1 by 1 m quadrat. Each corner was marked with pin flags. A buffer of at least 1 m was left between each plot.
Comparison of R. ficaria cover in plots on January 30, 2013. There was no significant difference by treatment (phenological stage).

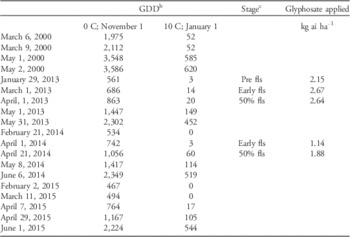
The four treatments consisted of three different early-season glyphosate herbicide applications and one untreated control. Each chemically treated plot received an application of glyphosate (Accord® [Dow AgroSciences LLC, Indianapolis, IN 46268] Concentrate at 2.5% v/v) plus a nonionic surfactant (Alenza 90 [DBI Services, Hazleton, PA 18201] at 0.50% v/v in 2013 and Kinetic [Helena Chemical, Collierville, TN 38017] at 0.1% v/v in 2014) and a spray indicator (Bullseye [Red River Specialties, Shreveport, LA 71107] at 0.5% v/v in 2013 and Spray Indicator XL [Helena Chemical] at 0.1% v/v in 2014). Repeat treatments were implemented in the early flowering and the 50% flowering plots in 2014. Weather conditions did not permit treatment at the preflowering stage in 2014; thus, those plots had only a single year of treatment. Actual treatment dates and stages are provided in Table 1. Treatment dates in 2014 were substantially later due to a longer and colder winter in 2014. Phenological conditions on April 1, 2014, were similar to conditions on March 3, 2013.
Selected dates and the corresponding growing degree days (GDD).Footnote a

a Treatment dates also list the phenological stage and glyphosate rate.
b GDD listed are for a base temperature of 0 C (32 F) and a November 1 starting date and for a base temperature of 10 C (50 F) and a January 1 starting date. Temperature data were taken from the Dalecarlia Reservoir (Station ID: GHCND:USC00182325) in Washington, DC, and retrieved from NOAA 2016. cAbbreviations: Pre fls, preflowering; Early fls, early flowering; 50% fls, 50% flowering.
Spot-application methods mimicked actual control techniques and followed label restrictions. Native vegetation was avoided by directed spraying. Herbicide was not applied when there was a potential for rain within 2 h of application. The herbicide was applied on a spray-to-wet basis but not to the point of runoff. Application rates were estimated for each treatment event (Table 1) with an average of 2.10 kg ai ha−1 (30.0 oz ai ac−1). The label maximum for application to perennial weeds not listed specifically on the label is 5.65 kg ai ha−1 (Dow AgroSciences 2008).
At each monitoring event we collected percent cover estimates for the target species and established guilds (R. ficaria, nonnative forbs, native forbs, nonnative graminoids, native graminoids, native woody plants, nonnative woody plants, bare ground, and dead vegetation). The only nonnative graminoid was M. vimineum. Plants greater than 2 m in height were excluded from data collection.
Because weather varied from year to year we used phenological stage to determine when to treat. We observed the population’s phenology monthly during the growing seasons in 2013 to 2015 (Table 1). GDD were later calculated using a standard base temperature of 0 C (32 F), daily average temperature, and a November 1 starting date. November 1 was chosen because seedlings have been observed in November. We used 0 C (32 F) because we assumed above-freezing air temperatures would stop or significantly slow phenological progression (Kim et al. Reference Kim, Jung, Sung, Han and Park2015; Kimball et al. 1973; Muller Reference Muller1978). Using this technique we calculated that the treatments were implemented in 2013/2014 at 561/NA (preflowering), 686/742 (early flowering), and 863/1056 (50% flowering) GDD. Our GDD are not perfectly aligned because GDD were calculated after actual treatment, and environmental conditions constrained chemical treatment. GDD are a better predictor of phenological stage than calendar days (Hunter and Lechowicz Reference Hunter and Lechowicz1992; McMaster and Wilhelm Reference McMaster and Wilhelm1997; Wang Reference Wang1960). Although only limited phenological data exist for R. ficaria, Sparks et al. (Reference Sparks, Jeffree and Jeffree2000) demonstrated that increases in mean temperature shifted flowering earlier.
Hammerschlag et al. (Reference Hammerschlag, Salmons, Kraft, Paul and Aatfield2000, Reference Hammerschlag, Salmons, Kraft, Paul and Aatfield2001, Reference Hammerschlag, Salmons, Kraft, Paul and Aatfield2002) conducted control trials on R. ficaria at Rock Creek Park, a national park in Washington, DC. Their studies did not report GDD, but using historical data we calculated GDD for the Rock Creek Park control trials and compared them with our treatment timing (Table 1). Although Hammerschlag et al. (Reference Hammerschlag, Salmons, Kraft, Paul and Aatfield2000) treated in early March and early May in 2000, that winter was unseasonably warm. The accumulated GDD for March 6, 2000, and May 1, 2000, were 1,975 and 3,548, respectively. During the years of our application, 1,975 GDD were achieved on May 21 in 2013, May 26 in 2014, and May 26 in 2015 (Table 1).
Statistical Analysis
Data were analyzed using linear mixed models. We analyzed the effect of treatment on the percent cover of R. ficaria, native plants (as a group), and M. vimineum, by far the most common non-target invasive plant found in the plots. Within each year, cover of plants varied due to both phenological changes between observations and effects of treatment. To focus solely on the effect of treatment on the cover of the target plants each year, we selected maximum cover of each target species or group for each year as the response variable. In doing so, we removed the phenological effects that were clearly present in the full data set. To determine the maximum cover we considered each species and each 1 by 1 m subplot separately. As a result, the maximum cover for a given species during a particular year may have occurred on different dates in different subplots. Similarly, different species of plant may have reached maximum cover in a single subplot on different dates during a given year.
Analysis of percentage data followed Warton and Hui (Reference Warton and Hui2011). Percentages were converted to proportions, and an empirical logistic transform was applied by adding 0.005 to each measurement and then taking the natural log. The value 0.005 was chosen because this was half of the smallest nonzero measurement.
In all analyses, the experimental block was used as a random effect. Fixed effects were the study year and the treatment and their interaction. Study year was centered, so that −1, 0, and 1 were used to indicate 2013, 2014, and 2015, respectively. Treatment was considered as a factor. For comparisons between models with different fixed effects, the model was optimized based on log likelihood, but restricted maximum likelihood (REML) was used for the final models.
For each response variable five models were compared. These included year by treatment interaction, year plus treatment, year alone, treatment alone, and a null model with only an intercept. Akaike information criteria (AIC) were used to determine the model or models that best fit the data. For analyses of native vegetation and M. vimineum, an additional five models were considered that consisted of the first set of five models plus an additive term for the empirical logistic-transformed cover of R. ficaria. This allowed us to distinguish between the direct effects of treatment and the indirect effects caused by changes in R. ficaria cover. For models further discussed in the text, marginal and conditional R2 was calculated to test for goodness of fit (Johnson Reference Johnson2014; Nakagawa and Schielzeth Reference Nakagawa and Schielzeth2013). Marginal R2 only accounts for fixed effects, whereas conditional R2 includes both fixed and random effects.
Analysis was performed using R v. 3.3.0 (R Core Team 2016). Mixed models were analyzed using the ‘lme4’ package (Bates et al. Reference Bates, Maechler, Bolker and Walker2015), and conditional R2 was determined using the piecewise ‘SEM’ package (Lefcheck Reference Lefcheck2015).
Results and Discussion
Impact on Ranunculus ficaria
Early-season foliar glyphosate applications were effective at controlling R. ficaria. Our study results did not show any advantage to treatment preflowering compared with later in the first year. While we were unable to assess treatment of the preflowering plots for a second year, preflowering plots may have faced factors working against control, including that at the time of treatment (1) some plants might have emerged but were small enough that they were hidden by leaf litter, (2) some plants might not have emerged yet, (3) reduced metabolic activity due to cold temperatures might have reduced the herbicide effectiveness, and (4) fewer leaves might have reduced the overall herbicide dose per plant.
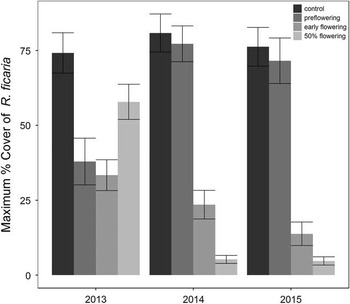
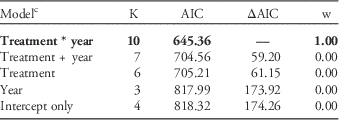
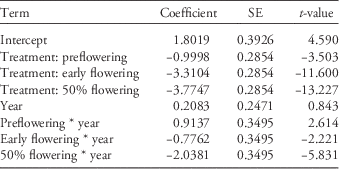
Only the model of change in R. ficaria that included a treatment by year interaction had any support based on AIC (Tables 2 and 3). This model has a 58.0% marginal R2 and a 67.9% conditional R2, indicating a reasonable fit to the data. Treatment had a strong impact on R. ficaria cover. The control plots experienced little change, with a maximum R. ficaria cover fluctuating around 75% (Figure 2). Plots treated preflowering had only a 42% cover in 2013, but in 2014 and 2015 this cover was similar to that of the controls. This difference may be explained by the preflowering plots receiving only 1 yr of treatment. Later treatments showed modest impacts in 2013, but in 2014 and 2015 these treatments resulted in dramatic decreases in R. ficaria to approximately 10% for the early-flowering treatment and less than 5% in the 50% flowering treatment.
Maximum R. ficaria cover for all treatments in all years.

Comparison of candidate models describing impacts on maximum percent cover of R. ficaria.Footnote a , Footnote b

a Variables listed in table include: treatment, timing of herbicide treatment; year, calendar year, centered.
b Abbreviations and symbols: K, number of model parameters; AIC, Akaike’s information criterion; ΔAIC, change in AIC value from model with the lowest AIC value; w, Akaike weight (weighted estimate of relative strength of model); asterisk (*) indicates interaction between variables; plus sign (+) indicates additive relationship between variables.
c Highly ranked models discussed in the text are in bold font. All models included block as a random effect.
Fixed effects table for highest weighted model.

Impact on Native Vegetation
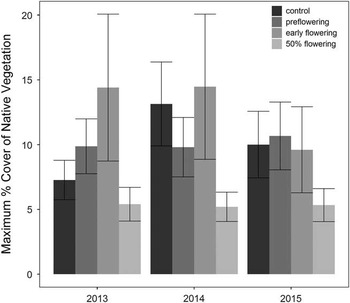
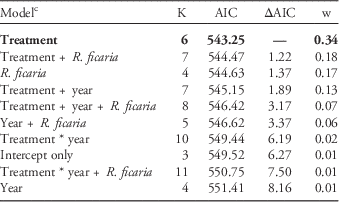
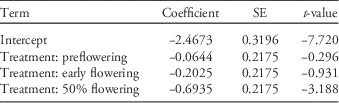
Although native plants grew next to and between the target plants, they were avoided through careful application of herbicide. Consequently, there was little evidence for any impact of treatment on the cover of native vegetation. Treatment was included in four of the top five models, comprising 82% of the weight (Table 4), and native vegetative cover varied between treatments (Figure 3). However, there was no clear pattern, with the control and the 50% flowering treatments starting with the least cover. Conditional R2 for the highest weighted model was 30.5%, but the marginal R2 was only 4.8%, indicating that the random effect of block was the main factor in explaining variance. Fixed effects for the most highly weighted model show little effect of treatment (Table 5). Evidence for a change in native vegetative cover over time was similarly weak. Models that included an effect of year have low Akaike weights. Native vegetation was not adversely affected by any treatments (Figure 3). However, native plants averaged less than 50% cover across all treatments (Figure 3).
Maximum percent cover of native vegetation for all treatments in all years.

Comparison of candidate models describing impacts on maximum percent cover of native vegetation.Footnote a , Footnote b

a Variables listed in table include: treatment, timing of herbicide treatment; year, calendar year, centered; R. ficaria, cover of R. ficaria empirical logistic transformed.
b Abbreviations and symbols: K, number of model parameters; AIC, Akaike’s information criterion; ΔAIC, change in AIC value from model with the lowest AIC value; w, Akaike weight (weighted estimate of relative strength of model); asterisk (*) indicates interaction between variables; plus sign (+) indicates additive relationship between variables.
c Highly ranked models discussed in the text are in bold font. All models included block as a random effect.
Fixed effects table for highest weighted model.

Impact on Microstegium vimineum
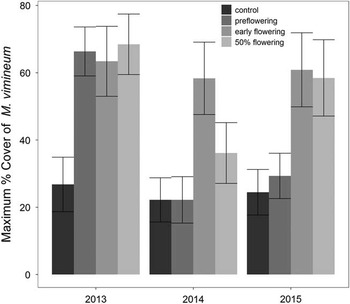
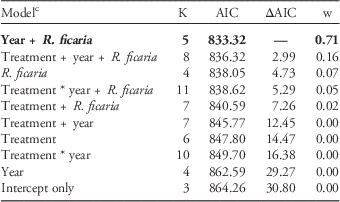
Treatment of R. ficaria had a clear impact on cover of M. vimineum (Figure 4). This could either have been due to a direct effect of the treatment or an indirect effect due to reduced impacts from R. ficaria. As R. ficaria cover varied within each treatment, we were able to statistically distinguish between these two possibilities. Models with R. ficaria cover had 100% of the Akaike weight (Table 6), whereas those that included treatment had a much lower weight, particularly when R. ficaria cover was not also included. The top-ranked model included only year and R. ficaria cover. From this we concluded that the loss of R. ficaria cover, rather than the treatment itself, impacted M. vimineum.
Maximum percent cover of M. vimineum for all treatments in all years.

Comparison of candidate models describing impacts on maximum percent cover of Microstegium vimineum.Footnote a , Footnote b

a Variables listed in table include: treatment, timing of herbicide treatment; year, calendar year, centered; R. ficaria, cover of R. ficaria empirical logistic transformed.
b Abbreviations and symbols: K, number of model parameters; AIC, Akaike’s information criterion; ΔAIC, change in AIC value from model with the lowest AIC value; w, Akaike weight (weighted estimate of relative strength of model); asterisk (*) indicates interaction between variables; plus sign (+) indicates additive relationship between variables.
c Highly ranked models discussed in the text are in bold font. All models included block as a random effect.
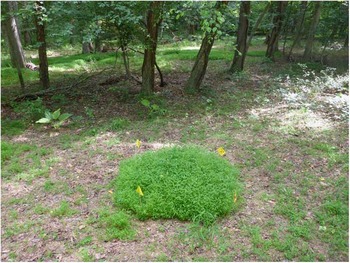
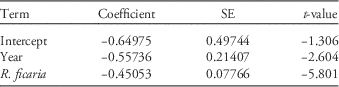
The most highly weighted model also included year as a predictor (Table 7). Microstegium vimineum was negatively associated with R. ficaria, so removal of R. ficaria stimulated growth of M. vimineum, sometimes strikingly so (Figure 5). This model also included a reduction in M. vimineum over time. This may be due to the preflowering plots having a high cover of M. vimineum in 2013, when they were treated, but low cover in 2014, when no treatment occurred and R. ficaria cover increased (Figure 4). This model has a conditional R2 of 29.9% and a marginal R2 of 16.0%, indicating that it explains a modest amount of the variance.
Microstegium vimineum release in a plot previously treated with glyphosate. Plot treated at the early-flowering stage (March 1, 2013, and April 1, 2014). Photo taken June 1, 2015.

Fixed effects table for highest weighted model.

Ranunculus ficaria and Microstegium vimineum interaction
The two primary components of cover (R. ficaria and M. vimineum) both formed dense stands in our study area. In general, after 2 yr, the plots were dominated by either R. ficaria if untreated or treated preflowering or by M. vimineum if treated at early flowering or 50% flowering (Figures 2 and 4). These results highlight the importance of good site assessments and multiple treatment events per year. The high percent cover of M. vimineum provides an opportunity to assess competition by R. ficaria on co-occurring annual species. Although M. vimineum is an annual grass that emerges in April and R. ficaria is a perennial forb that senesces in May or June, it appears the overlap was sufficient for substantial interaction to take place. Bram and McNair (Reference Bram and McNair2004) report that R. ficaria was able to compete with the much larger nonnative perennial Japanese knotweed (Polygonum cuspidatum Sieb. & Zucc.) Although it has been reported that the greatest ecological threat posed by this plant is to spring ephemerals (Swearingen et al. Reference Swearingen, Reshetiloff, Slattery and Zwicker2010), our results indicate that R. ficaria has the potential to impact species that persist in the understory after the spring ephemerals senesce. As invasive plants have spread, secondary invasion has become more common (Pearson et al. Reference Pearson, Ortega, Runyon and Butler2016). Future studies should look not only at the effects of invasive plants on native plants but also at the effects of nonnative plants on other nonnative plants.
Cipollini and Bohrer (Reference Cipollini and Bohrer2016) tested the allelopathic effects of five invasive plants, including R. ficaria and M. vimineum, on two natives but not on one another. They also found that R. ficaria extracts reduced mycorrhizal inoculation of eastern bottlebrush grass (Elymus hystrix L.) in laboratory studies. Microstegium vimineum is mycorrhizal (Lee et al. Reference Lee, Tu, Chen and Hu2014). If R. ficaria is allelopathic, the allelochemical impact on mycorrhizae could be a factor in R. ficaria and M. vimineum competition. Cipollini and Flint (Reference Cipollini and Flint2013) suggest that the extracts from A. petiolata leaves have a stronger allelopathic effect than root extracts. If allelopathic properties of R. ficaria are confirmed, it is possible that the greater leaf area later in the year resulted in an increased allelopathic effect on M. vimineum in the R. ficaria plots that were treated later in the year.
Growing Degree Days
Our calculations of GDD for the work of Hammerschlag et al. (Reference Hammerschlag, Salmons, Kraft, Paul and Aatfield2000, Reference Hammerschlag, Salmons, Kraft, Paul and Aatfield2001, Reference Hammerschlag, Salmons, Kraft, Paul and Aatfield2002) illustrated how calendar dates may be misleading. Our study does not provide a thorough analysis of the GDD–phenology relationship but rather provides GDD data for our study and a related study as a way of assessing at what phenological stage treatments occurred in multiple years. Our use of GDD indicates that the earliest treatment by Hammerschlag et al. (Reference Hammerschlag, Salmons, Kraft, Paul and Aatfield2002) was phenologically later than our two earliest treatments in both 2013 and 2014. Although GDD are unlikely to be a perfect predictor or a perfect tool for treating this species, they are likely a better predictor than calendar days (Hunter and Lechowicz Reference Hunter and Lechowicz1992; McMaster and Wilhelm Reference McMaster and Wilhelm1997; Wang Reference Wang1960). Using GDD can help ensure that the timing of control efforts is biologically appropriate and can be helpful when comparing treatments at different times or places (e.g., Bukun Reference Bukun2004; Dale and Renner Reference Dale and Renner2005; De Roo Reference De Roo2016).
Herbicide Rate
The rates used in this trial (1.14 to 2.66 kg ai ha−1) were likely higher than necessary. In our operations (MN Frey, unpublished data) we have found anecdotally that 1.0% or 1.5% solutions of glyphosate herbicides with an average application rate of 0.90 kg ai ha−1 have been sufficient to control R. ficaria. Cardina (J Cardina and colleagues, personal communication) found that 0.77 kg ai ha−1 was sufficient to achieve control, although 1.54 kg ai ha−1 achieved better control in the second year of their trial.
The University of Maryland Extension recommends glyphosate for R. ficaria but states other herbicides may work (Schuster Reference Schuster2013). Three years of annual spot treatments of metsulfuron and a nonionic surfactant applied at 7.93 g ai ha−1 resulted in a 60% to 70% reduction in the area covered by R. ficaria (D. Levy, personal communication, cited in Axtell et al. Reference Axtell, DiTommaso and Post2010). In trials in northern Ohio, a glyphosate product provided better in-season control than with individual treatments of metsulfuron, triclopyr, and imazapyr (J Cardina and colleagues, personal communication).
Cold-Weather Treatment
Our results with cold-weather glyphosate application on R. ficaria are consistent with those of others who have reported successful cold-weather applications of glyphosate on other species with minimal impacts to non-target species (Frey et al. Reference Frey, Herms and Cardina2007; Morris et al. Reference Morris, Morris and Surface2016; Neal et al. Reference Neal, Skroch and Monaco1986; Willoughby Reference Willoughby1996; Wilson et al. Reference Wilson1997). Applying an herbicide with only foliar activity when non-target species are not in leaf reduces the likelihood of damage to non-target species. In addition, increasing the number of months when application may occur provides additional flexibility to a land manager.
Acknowledgments
N. Garcia Anderson, R. Tietjen, and C. Cate were a great help with implementation. Thank you to Wolf Trap staff for allowing this work to happen on park land and to the National Park Service for allowing us to spend time conducting this work. Thank you to S. Enloe and two anonymous reviewers for extensive comments that greatly improved the paper.