Introduction
The performance of optoelectronic devices and transistors depends critically on the contact resistance. Hence, a successful development of reliable ohmic contacts on GaN is of great practical importance. Until now, the best results include Ti as the first layer deposited on the GaN surface (Reference Lin, Ma, Huang, Fan, Allen and Morkoç1,Reference Fan, Mohammad, Kim, Actas, Botchkarev and Morkoç2). In the case of Ti/Al, a thin layer of titanium (20 nm) is first deposited and covered by aluminium to a total thickness of 100-200nm. The ohmic contact forms during a subsequent anneal at temperatures which can be as high as 900°C, and it has been shown to be due to a thin TiN film from the reaction of Ti with GaN (Reference Rusimov, Liliental-Weber, Washburn, Dustad, Haller, Fan, Mohammad, Kim, Botchkarev and Morkoç3). In this process, resistivity in the range of 10−5 ohm.cm2 is obtained upon 1018 cm−3 silicon doped GaN layers. During the annealing steps many reactive phases form between Al, Ga, Ti and N which may be a problem for the quality of the contact. Moreover, the formation of TiN may lead to a loss of N from the GaN surface layer, as well as to an excess of Ga in the reactive area. One of the ways to avoid these drawbacks would be to deposit TiN directly on the GaN surface. In this work, a comparative TEM investigation has been carried out on annealed Al/Ti/GaN and directly deposited TiN films on GaN.
Experimental
Two types of specimens were investigated. In one case, a 20 nm Ti film was deposited on GaN and covered by a 80nm Al layer in order to avoid mostly the interaction of titanium with air. They were then submitted to a rapid thermal annealing for 10 seconds at 500°C. In the other case, TiN contacts were deposited at room temperature on the GaN films by dc reactive magnetron sputtering using an Alcatel SCM 600 deposition system equipped with an in situ ultrafast spectroscopic ellipsometer. Details of the deposition system are presented elsewhere (Reference Dimitriadis, Logothetidis and Alexandrou4). First, the samples were cleaned in air with a HCl:H2O (1:1) solution and loaded into the deposition chamber. Then, a very low energy (∼ 5 eV) Ar+ ion dry etching was used to remove the native surface oxide just before the deposition. The working and reactive gases were respectively Ar (99.999%) and N2 (99.999%). The deposition conditions of the substrate bias voltage Vb was −40 or −120 V and the N2 flow rate was about 2 sccm. The Ar flow was kept constant at 15 sccm with a partial pressure of 7.5×10⁻³ mbar. In-situ spectroscopic ellipsometry investigations have shown that TiN films deposited at Vb= −120 V are stoichiometric (Reference Dimitriadis, Logothetidis and Alexandrou4). TEM samples were prepared in the conventional way by mechanical grinding followed by ion milling. HREM observations were carried out on an Topcon 002B electron microscope operated at 200 kV with a point to point resolution of 0.18 nm
Results
In the annealed Ti/Al films, the ohmic resistivity was measured to be 10−5 ohm.cm2 which is consistent with the silicon doping level of 1018cm−3. Conventional TEM shows a polycrystalline metallic layer which has a total thickness of nearly 150nm. At higher magnification, one starts to notice the reactive area. The GaN surface is flat, whereas the TiN layer is 2 nm thick and is rough. In areas with large crystallites (5-10 nm), only the {111} TiN lattice fringes are parallel to (0001) GaN, meaning that the grains have only the <111> direction parallel to the [0001] GaN. Unfortunately, these areas are always small and can be separated by patches which exhibit amorphous contrast in the HREM images (fig.1). If they are made of amorphous material due to surface contamination or non completed reaction between GaN and Ti,one may suspect them to constitute points of non optimum ohmic contact, which may lead to discontinuities in current flow.
Formation of TiN patches after annealing of deposited Ti/Al

For the directly deposited TiN layers, we obtained a perfect columnar structure. The TiN crystallites section is 5-20 nm and they are strongly twinned. Diffraction analysis shows that they mainly have their {111} planes parallel to the (0001) GaN as in the conventional epitaxial relationship and the rotation around the <111> is reasonably small.
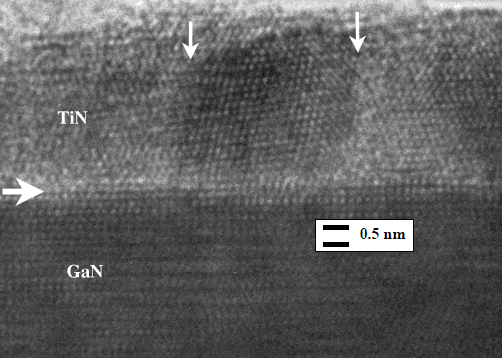
HREM observations of the interface indicate that the transition between GaN and TiN crystallites is flat, with the (0001) GaN // (111) TiN atomic planes as in the case of RTA samples. However no amorphous patches could be noticed at this interface. As shown on fig.2, the columnar structure originates at the interface, and the crystallites diameter can be confirmed as about 5 nm.
Directly deposited TiN with columnal structure (vertical arrows) and no amorphous layer at interface( horizontal arrow)

The full epitaxial relationship is:
-
(0001)GaN//(111)TiN
-
[10
0 ]GaN//[211]TiN
-
[11
0 ]GaN//[110]TiN

The misfit along [10

A high magnification of the interface area showing the misfit dislocations, the interface position has been pointed out by the arrows.

I/V characteristics of the as deposited GaN layers, a) the optimum deposition conditions at 120 V , b) layers sputtered at 40 V

Conclusion
Although it has been known that the best ohmic contacts to n type GaN is made by TiN formation, the latter is usually made by deposition of Ti and Al, followed by a 900°C anneal. This results in the formation of more compounds that the necessary TiN, which may constitute a drawback for device performance. In this work we have shown that, although the low temperature annealing may be an alternative, one is left with amorphous patches at the interface. Therefore the deposition of stoichiometric TiN may be one solution and work is going on in order to optimize this process.
Acknowledgements
This work was done in a collaboration of CNRS and NHRF(Greece) under project n° 5225