INTRODUCTION
Multi-environment trials are laborious, money- and time-consuming but are necessary because of genotype (G) × environment (E) interactions (GEI) (Sprague & Federer Reference Sprague and Federer1951). The efficiency and accuracy of cultivar selection for any trait is greatly enhanced when a testing location is representative of the mega-environment and/or is of high discriminating ability (DA) (Yan & Kang Reference Yan and KanG2003). A discriminative location should portray a favourable array of both static (e.g. soil texture, fertility) and dynamic factors (e.g. precipitation, temperature, pests and diseases) with reasonable repeatability (Blanche & Myers Reference Blanche and Myers2006). The situation is confounded when a specific factor is either static or dynamic under certain conditions. This is true when cotton grows under verticillium wilt (Verticillium dahliae Kleb.) stress (Baxevanos et al. Reference Baxevanos, Goulas, Rossi and Braojos2008). The proportion of yield and quality reduction claimed by verticillium wilt depends on soil inoculum level (static factor) and soil temperature or moisture (dynamic factors) (Garber et al. Reference Garber, Devay, Goodell, Roberts, Hake, Kerby and Hake1996).
Within a mega-environment, the size of GEI is small and the mean genotype performance could be considered for cultivar selection. However, a question emerges for plant breeders or cultivar trial coordinators; ‘How many testing locations and replications are necessary for an effective cultivar selection programme?’ (Yan et al. Reference Yan, Fregeau-Reid, Martin, Pageau and Mitchell-Fetch2015). Hanson & Brim (Reference Hanson and Brim1963) investigated the optimal resource allocation between test locations and replications within trials based on the relative magnitude of variance components. However, the ultimate tool to measure the effectiveness of a cultivar evaluation scheme is heritability (H) (DeLacy et al. Reference DeLacy, Basford, Cooper, Bull, McLaren, Cooper and Hammer1996).
Heritability for a given trait is defined as the proportion of genotypic to total phenotypic variation within a trial or across test locations. When H is equal to 1, the differences between genotypes are ascribed totally to genotypic difference; when H is 0, all differences are due to the environment. Previously, the number of replications or locations showed a curvilinear relationship with the achieved H (Yan et al. Reference Yan, Fregeau-Reid, Martin, Pageau and Mitchell-Fetch2015). Considering this relationship, Yan et al. (Reference Yan, Fregeau-Reid, Martin, Pageau and Mitchell-Fetch2015) estimated the optimum number of replications and locations for a given trait and region assuming a target H equal to 0·75 and concluded that the optimum number of locations should be double (20) the actual for eastern Canada oat registration trials, and proposed further division of the respective oat mega-environment. Xu et al. (Reference Xu, Jin and Li2016) proposed the use of three replications to achieve a trial H of 0·75 and 20 than test locations to realize a higher H (0·90) for cotton yield in regions of China considering possible trial losses due to poor field management and other non-artificial factors. Bowman et al. (Reference Bowman, Bourland and Kuraparthy2016) recommended four replications and five locations when the evaluation takes place over 2 years, or three locations when the evaluation takes place over 3 years for measuring maturity in cotton based on visual observation.
Cotton is a major cash crop in Greece contributing more than 0·08 of the total agricultural output. More than 75 000 farmers grow 285 000 ha of cotton, producing about 0·80 of the cotton in EU. Almost the entire cotton acreage is irrigated and machine-harvested (Cotton & Products Annual 2014). Cotton grows under typical Mediterranean pedo-climatic conditions. In southern and central Greece, cotton is grown under water shortages along with high temperatures and a long growing season, while in the northern regions, where temperatures are milder and the growing season is shorter, cotton is watered more efficiently (Kalivas & Kollias Reference Kalivas and Kollias2001). Quality is greatly affected by weather conditions; in particular, high rainfall during harvest can cause significant losses (Tsaliki Reference Tsaliki2005). Verticillium wilt is the major disease that causes yield and quality reduction (Kechagia & Xanthopoulos Reference Kechagia and Xanthopoulos1998). Under these conditions, a superior cotton cultivar should combine earliness and verticillium wilt tolerance. A genotype plus genotype × environment (GGE) biplot analysis based on 5-year data postulated that Greece constitutes a complex mega-environment and certain locations were considered more desirable for lint yield evaluation (Baxevanos et al. Reference Baxevanos, Goulas, Tzortzios and Mavromatis2006). However, the number of locations or replications required to reach an optimum H had not been estimated.
The aim of the present work was to: (i) calculate the required number of replications in each trial and locations in each year for realizing an optimum H of 0·75 for all the traits measured, (ii) identify the most desirable trial locations for lint yield and verticillium wilt in the context of optimum resource allocation and the effectiveness of a cultivar selection programme.
MATERIALS AND METHODS
Experimentation and determinations
Trials were established from early April to early May under irrigated conditions. Standard agronomic practices for official cotton yield evaluation trials were followed throughout the growing season. A randomized complete block design with four replications was used. Each plot consisted of four rows, 0·95 m apart and 10 m long.
At maturity, the two inner rows in each plot were hand-picked twice and the seed-cotton yield was recorded. The first pick started when the latest maturing cultivar had 70% of the bolls open (BBCH 87), whereas the second pick was conducted when the latest bolls (depending on the cultivar) were open (BBCH 99) (Lancashire et al. Reference Lancashire, Bleiholder, Van Den Boom, Langelüddecke, Stauss, Weber and Witzenberger1991). A random sub-sample of seed-cotton (1 kg) was selected from two replications of the first pick for fibre quality determinations. Samples were ginned using a laboratory gin and lint percentage was estimated as the ratio of lint weight to the sum of seed and lint weights. Lint yield was calculated as the product of seed-cotton yield and lint percentage.
Fibre quality was evaluated at Delta & Pine Land Company (Scott, Mississippi, USA) on a High Volume Instrument (USTER® HVI 900, Uster Technologies, Inc., Knoxville, Tennessee, USA). The fibre traits determined were micronaire, length as the upper half mean length (mm), strength (g/tex), uniformity as the ratio of mean fibre length to upper half mean length expressed as a percentage, elongation and short fibre index (SFI).
From 2001 to 2007, the trial verticillium wilt per cent (TVWP) infestation level was recorded in the control cultivar IX388, which was sensitive to verticillium, to determine differences between locations. The TVWP infestation level was estimated on 25 randomly selected plants per plot at late August; plants were cut across the base of the main stem and those with discoloured (black or brown) veins were considered as infested. The percentage of infestation was estimated to the total number (25) of plants assessed.
On five typical plants in each plot, plant height was measured as the distance (cm) from the first cotyledonary node to the apical bud at full bloom (BBCH 65).
Visual symptoms of verticillium wilt infestation (VWI) on leaves were rated on a scale of 1–5 (1 = low, 5 = high) in each plot at mid-August when ca. 50% of bolls had attained their final size (BBCH 75).
Trial locations
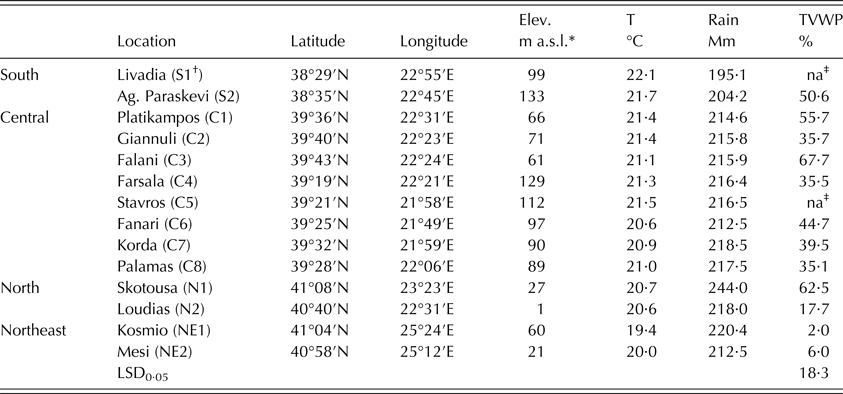
The trials (a total of 107) took place from 2000 to 2007 at 14 locations abbreviated as S, C, N and NE for south, central, north and north-east, respectively (Table 1). Locations extended across the Greek cotton zone taking into account the acreage sown to cotton in each region (many locations in central Greece), the climate differentiation and verticillium wilt pressure. In particular, southern and central growing areas had long growing seasons with high (20·6–22·1 °C) mean temperatures and moderate to very high (35·1–67·7%) TVWP (Table 1). Northern areas showed a moderate length of growing season with lower mean temperatures (20·6–20·7 °C) and moderate to high (17·7–62·5%) TVWP. Finally, north-eastern regions had a short growing period with 19·4–20·0 °C mean temperatures and low (2–6%) TVWP.
Geographic coordinates, elevation (Elev.), mean air temperature (T) and sum of rainfall (Rain) during the growth season (April/May to October), and trial verticillium wilt per cent (TVWP) infestation level based on the control cultivar IX-388. Data regard 2000–2007 growth seasons at 14 locations along the cotton growing area in Greece

Means of TVWP were compared using the least significance test (LSD) at P < 0·05.
* Above sea level.
† Location's abbreviation.
‡ Not available.
Statistical analyses
An 8-year data set, derived from the cultivar evaluation trials of Delta & Pine Land Co in Greece, was used. Data were balanced in 1-year subsets. Each year, 13–14 locations were employed and 10–13 advanced lines (with commercial controls) were tested across locations. Analysis of variance for each trial and each 1-year data set was performed using the statistical software JMP (SAS Institute 2002). A model using the mixed procedure considering cultivar as fixed and location as random effects was employed to calculate cultivar genetic variation (
 $\sigma _{{\rm g\;}} ^2 $
), cultivar × location variation (
 $\sigma _{{\rm ge\;}} ^2 $
) and the phenotypic variation (
 $\sigma _{\rm p}^2 $
) (Annicchiarico Reference Annicchiarico2002). The accepted coefficients of variation (CVs) for the national cotton registration trials are ⩽15%, and for this reason, trials having CVs > 15% were rejected from the evaluation.
Determining the optimum replications within a trial
Heritability within a trial was calculated according to DeLacy et al. (Reference DeLacy, Basford, Cooper, Bull, McLaren, Cooper and Hammer1996), as:
 $$H = \displaystyle{{\sigma _{\rm g}^2} \over {\sigma _{{\rm g\;}} ^2 + \sigma _{\rm e}^2 /N_{\rm r}}}$$
where
 $\sigma _{\rm g}^2 $
is the genotypic variation,
 $\sigma _{\rm e}^2 $
is the error variation and N
r is the number of replications of the trial. Based on this equation, the N
r required to achieve a certain level of H can be determined as (Yan et al.
Reference Yan, Fregeau-Reid, Martin, Pageau and Mitchell-Fetch2015):
 $$N_{\rm r} = \left( {\displaystyle{{\sigma _{\rm e}^2} \over {\sigma _{\rm g}^2}}} \right)\displaystyle{{H} \over {1 - H}}$$
If the target H is set to 0·75 then H/1 − H = 3, and N r is calculated as:
 $$N_{{\rm rH}75} = 3\left( {\displaystyle{{\sigma _{\rm e}^2} \over {\sigma _{\rm g}^2}}} \right)$$
where N rH75 is the required number of replications to achieve an H of 0·75. Accordingly, N rH60, N rH50 and N rH40 are the required number of replications to achieve an H of 0·60, 0·50 and 0·40, respectively.
Determining the optimum number of locations
The H for a given trait across locations in a year was calculated as:
 $$H = \displaystyle{{\sigma _{\rm g}^2} \over {\sigma _{\rm g}^2 + (\sigma _{{\rm ge}}^2 /N_{\rm l}) + (\sigma _{\rm e}^2 /{N}_{\rm l}{N}_{\rm r})}}$$
according to DeLacy et al. (Reference DeLacy, Basford, Cooper, Bull, McLaren, Cooper and Hammer1996), where
 $\sigma _{\rm g}^2 $
is the genotypic variation,
 $\sigma _{\rm e}^2 $
is the error variation,
 $\sigma _{{\rm ge}}^2 $
is the genotype × location variation, N
l is the number of locations and N
r is the number of replications in the trial.
Based on this equation, the N l required to achieve an H of 0·75 can be determined as (Yan et al. Reference Yan, Fregeau-Reid, Martin, Pageau and Mitchell-Fetch2015):
 $$N_{{\rm lH75}}\; {\rm = \; 3}\left[ {\displaystyle{{\sigma _{{\rm ge}}^2 + \sigma _{\rm e}^2 /N_{\rm r}} \over {\sigma _g^2}}} \right]$$
where N lH75 is the required number of locations to achieve an H of 0·75. Similarly, N lH60, N lH50 and N lH40 are the required number of locations to achieve an H of 0·60, 0·50 and 0·40, respectively.
The required number of replications for realizing the targeted H was calculated based on the assumption that the number of locations was one, whereas the required number of locations was calculated assuming that the number of replications was four for lint yield, plant height, VWI and two for lint percentage and fibre quality traits.
Evaluating locations for the distance to an ideal, representativeness and discriminating ability
The GGE biplot model (Frutos et al. Reference Frutos, Galindo and Leiva2014) was used on each data set to evaluate the distance of test locations to an ideal (DI) and test locations for representativeness (Rep) and discriminating ability (DA) for lint yield and VWI.
One-year biplots were produced to compare the testing locations’ DI. The distance between each location marker and the ideal test location marker on the biplot graph were measured and standardized by the mean distance of all the locations for each biplot (Blanche & Myers Reference Blanche and Myers2006; Baxevanos et al. Reference Baxevanos, Goulas, Rossi and Braojos2008). The standardized distances for each test location were averaged across the 1-year data sets and the respective standard deviations (sd) provided an estimation of the consistency of each testing location to rank genotypes across years. Locations with high sd were considered inconsistent. These 1-year distances were considered as replications for mean separation using the least significance test at P < 0·05.
Further, the 1-year biplots were also used to evaluate the DA and the Rep for lint yield and verticillium wilt disease levels (Yan & Kang Reference Yan and KanG2003). The vector length, the absolute distance between the marker of a location and the plot origin, is a measure of its DA; the longer the vector, the more discriminating the location in separating genotypes. The absolute length of the vertical projection from the marker of a location onto the average tester coordinate (ATC) biplot y-axis is a measure of its Rep; the longer the projection, the less representative the location. The mean DA and Rep regarding lint yield and VWI were obtained, standardized and compared with the same calculations described for DI.
RESULTS
Optimum replications and locations for lint yield
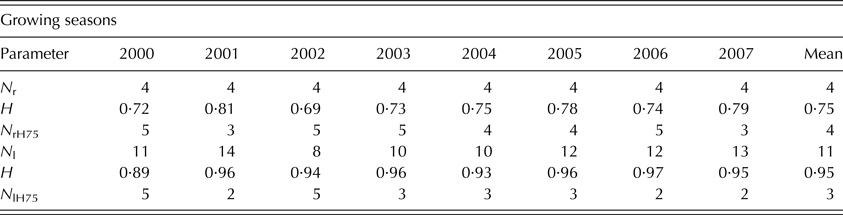
Regarding lint yield, four replications (N r) were used in each trial across the growing seasons (Table 2). The mean achieved H was 0·75, coinciding with the optimum, and as it was expected, the estimated number of replications (N rH75) was four. The number of locations (N l) varied in each growing season because some locations with high CV (>15%) were rejected or in other growing seasons, the number of trials was lower (Table 2). On average, using 11 locations, the achieved cross-trial mean H was 0·95, being much higher than the target (0·75) and as it was expected, the optimum number of locations to realize H = 0·75 (N lH75) was estimated at three, much lower than the actual (11). In particular, in 6 out of 8 years, 2–3 locations were adequate to realize the optimum H; very few compared with the actual 8–14 locations used.
Actual number of replications (Nr) and locations (Nl), heritability (H) of lint yield achieved and the respective number of replications (NrH75) and locations (NlH75) needed to achieve H = 0·75 in cotton cultivar evaluation trials in Greece during the 2000–2007 growing seasons

The coefficient of variation (CV) of trials was ⩽15%.
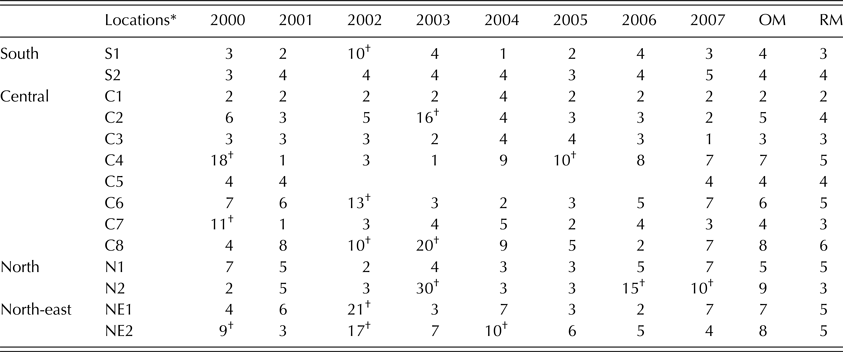
Four replications were used in each trial. The optimum numbers of replications to realize H = 0·75 for lint yield in different locations and growing seasons are shown in Table 3. Fifteen out of 107 locations (14%) were excluded from the evaluation as having CV > 15% (Table 3). The overall mean (OM) replication requirement was five, whereas the mean replication requirement excluding the rejected trials (RM) was four. The rejected trials required many replications (⩾9). For example, in locations C4, C8, N2, NE1 and NE2, the OM was high (⩾7). The central location C2, a main breeding site, required a high number of replications (six and 16, respectively) in certain growing seasons (e.g. 2000, 2003). This location could be substituted by the nearby C1 (OM = 2) or C3 (OM = 3) (Table 3). Location C1, especially, was highly consistent across years since it required only two replications. Similarly, C7 was also an interesting site because of its low requirement for replications (OM = 4). Regarding the north locations, N2 showed inconsistency (3 years with rejections) and should be considered for substitution by the other northern location (N1), which was more consistent across years (OM = 5). The two southernmost sites (S1 and S2) required similar replications. Finally, the two north-eastern locations required many replications (OM ⩾ 7), whereas the most inconsistent was NE2 since it showed 3 years with trial rejections.
Optimum number of replications to realize H = 0·75 for lint yield in different locations and growing seasons assuming that the actual number of replications used was four

OM; overall mean, RM; mean excluding the rejected trials
* See Table 1 for explanation of location codes.
† Trials rejected having CV > 15%. OM; overall mean, RM; mean excluding the rejected trials.
Summarizing the above, it was calculated that three locations with four replications could be adequate to realize the target H, considering that 14% of the trials were rejected because of high CVs.
Optimum replications and locations for plant height and verticillium wilt infestation
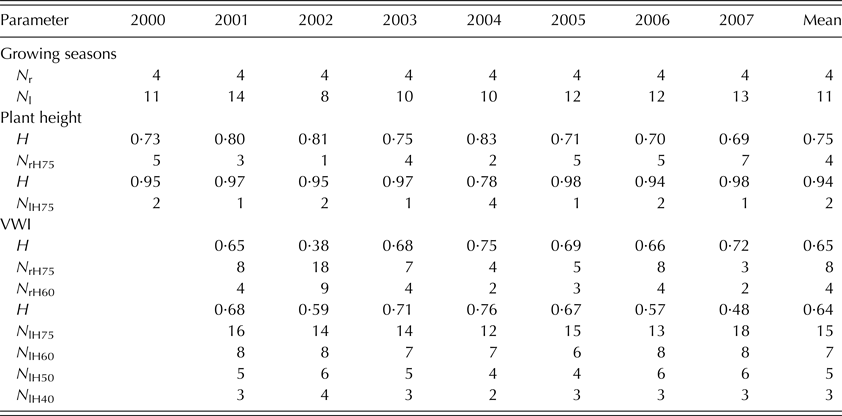
Four replications and 11 locations were used; VWI was not measured in 2000 (Table 4). Heritability achieved for plant height was 0·75 (the optimum) and the N rH75 was estimated at four replications, while H across locations was 0·94 and N lH75 was two.
Actual number of replications (Nr) and locations (Nl) tested, heritability (H) of plant height and verticillium wilt infestation (VWI) and the respective number of replications (NrH75, NrH60) and locations (NlH75, NlH60, NlH50, NlH40) needed to achieve H = 0·75, 0·60, 0·50 and 0·40, respectively

Regarding VWI, H within trials ranged from 0·38 to 0·75 with a mean of 0·65 and N rH75 was estimated at eight replications, double the actual number. However, when the target H was set at 0·60, N rH60 was four. Heritability across locations was calculated at 0·48–0·76 with a mean of 0·64, while the respective N lH75 was 15. Yet, when the target H was set at 0·60, 0·50 and 0·40, seven, five and three locations were required, respectively.
In conclusion, four replications and two locations were adequate for plant height to achieve an H = 0·75. When the target H for VWI was set at 0·60, four replications were adequate, while H = 0·50 and 0·40 required five and three locations, respectively.
Optimum replications and locations for lint percentage and fibre quality traits
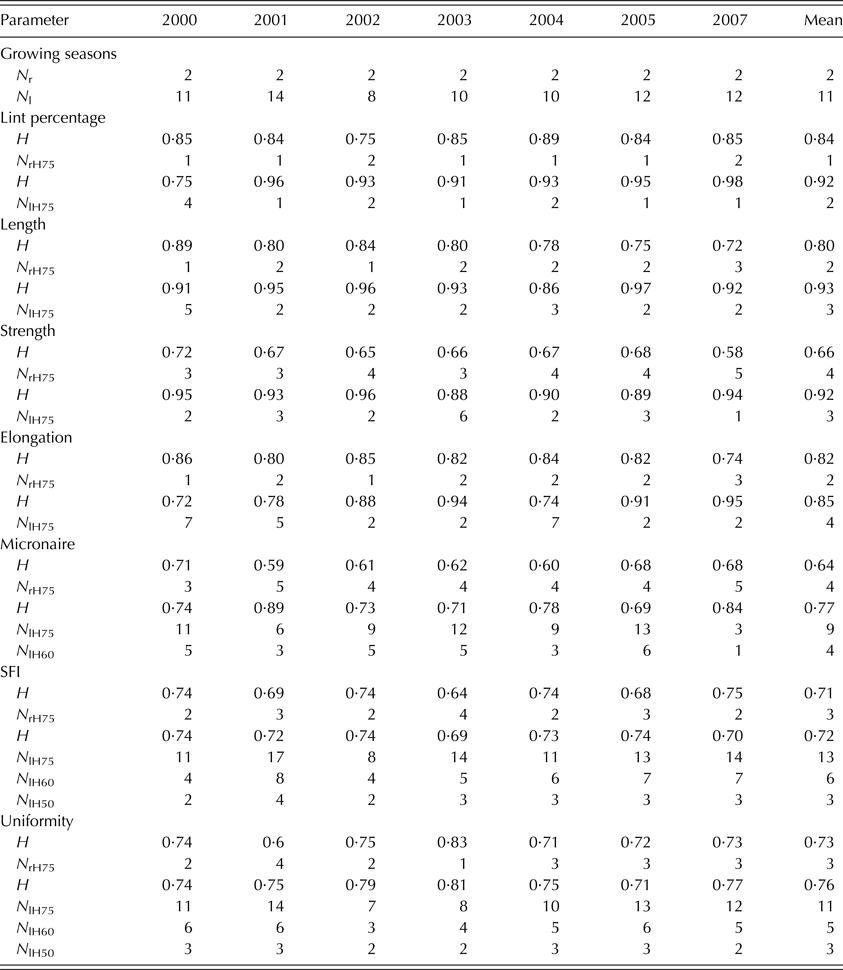
Two replications and on average 11 locations were measured for lint percentage and fibre quality (Table 5). Lint percentage was highly heritable (0·84) and only one replication (N rH75) was necessary to realize the optimum H. Heritability across locations was estimated at 0·92, and two locations (N lH75) were adequate to realize the target H.
Actual number of replications (Nr) and locations (Nl) tested, heritability (H) of lint percentage and fibre traits [length, strength, elongation, micronaire, short fibre index (SFI), uniformity] and number of replications (NrH75) and locations (NlH75, NlH60, NlH50) needed to achieve H = 0·75, 0·60 and 0·50, respectively

Regarding fibre quality, length was highly heritable and two replications along with three locations were effective. Strength had lower within-trial H (0·66) and thus four replications were required. However, H across locations was high 0·92 and three locations were effective. Elongation was highly heritable and two replications were sufficient, while H across locations was 0·85 and four locations were enough. Micronaire had low H (0·64) and four replications were needed. However, H across locations was higher (0·77) but as high as nine locations were needed. When H across locations was set at 0·60, four locations were enough. For SFI, H was 0·71 and three replications were needed, while H across locations was 0·72 and a very high number of locations (13) was needed. When H was set at 0·60 and 0·50, six and three locations were required. Uniformity had H equal to 0·73 and three replications were needed. Its H across locations was higher (0·76) and 11 locations were needed, while once H was set at 0·60 and 0·50, five and three locations were enough.
In conclusion, ⩽4 replications were sufficient to realize the optimum H of 0·75 for the fibre traits, while ⩽3 locations were required for lint percentage, length and strength; four locations for elongation; nine for micronaire; 11 for uniformity; and 13 for SFI. When the target H was set at 0·60 for micronaire and 0·50 for SFI and uniformity, 3–4 locations were adequate.
Evaluation of location for lint yield
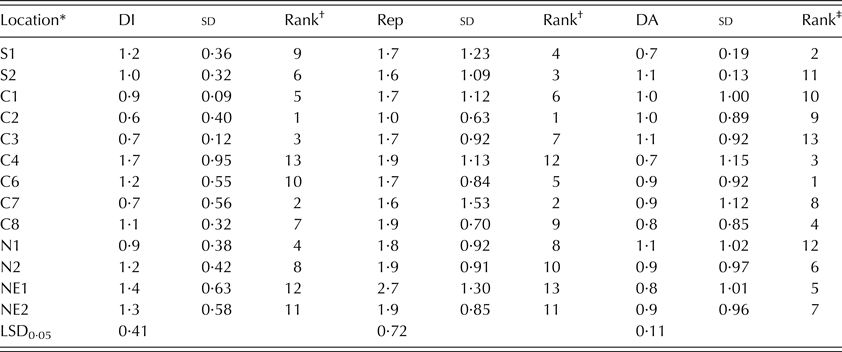
The distance to the ‘ideal’ (DI) of each test location (exempting C5, due to a lack of data) as a measure of its desirability in screening genotypes for lint yield is shown in Table 6. Locations C2, C7, C3, N1, C1 and S2 were ranked, in statistical terms, equally effective for lint yield testing. Among them, C2 (the central breeding location) was closest to the ideal (rank 1) and followed closely by C7 and C3 (ranks 2 and 3, respectively) (Table 6). Locations C1 and C3 were the most consistent across years, showing the lowest sd. It is interesting that both locations had the lowest requirement for replications to realize the target H; two replications for C1 and three for C3 (Table 3).
Standardized distances (distance to an ideal, DI; representativeness, Rep; discriminating ability, DA) their standard deviation (sd) and ranking (Rank) of the 13 cotton locations for lint yield during 2000–2007 growing seasons

Means were compared using the least significance test (LSD) at P < 0·05.
* Location C5 was excluded from the evaluation due to the lack of data. See Table 1 for explanation of location codes.
† The lower, the more desirable.
‡ The higher, the more desirable.
Locations C2, C7, S2, S1, C6, C1 and C3 were characterized by being most representative, whereas the most discriminative were C3, N1, S2 and C1 (Table 6). The high DA was possibly associated with the severity of TVWP, which followed the rank C3 > N1 > C1 > S2 among the most heavily infected sites (TVWP ⩾ 50·6%) as Table 1 shows.
Evaluation of locations for verticillium wilt
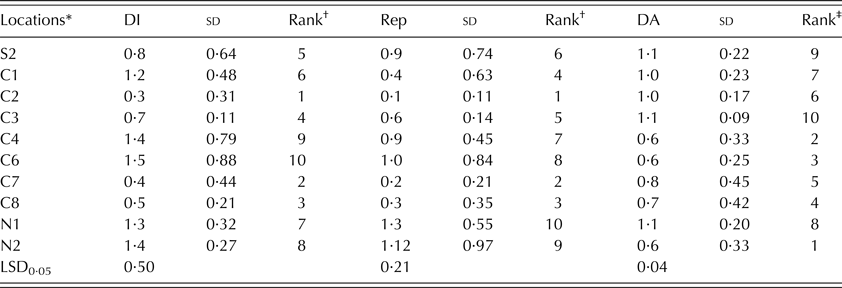
Seven 1-year biplots were constructed for the 2001–2007 growing seasons based on VWI symptoms (Table 7). Growing season of 2000 and locations S1 and C5 were excluded from the analysis because no measurements were taken. In addition, locations NE1 and NE2 have not been taken into account because of the very low VWI level. Data indicated that the most discriminative sites for VWI were those showing the highest TVWP on the cultivar ΙΧ−388 (Table 1). Thus, C3, S2 and N1 had the highest DA for VWI. Among them, C3 was the most consistent across years having low sd for DA (Table 7). Locations C2, C7, C8, C3 and S2 were ranked equally close to DI, but among them, C3 and S2 were most discriminative for rating against VWI (Table 7).
Standardized distances (distance to an ideal, DI; representativeness, Rep; discriminating ability, DA) standard deviations (sd) and ranking (Rank) of 10 Greek locations for verticillium wilt infestation (VWI) during the 2001–2007 growing seasons

Means were compared using the least significance test (LSD) at P < 0·05.
* Locations S1 and C5 were excluded from the evaluation due to the lack of data, and NE1 and NE2 due to the very low VWI. See Table 1 for explanation of location codes.
† The lower, the more desirable.
‡ The higher, the more desirable.
In conclusion, C2, C7, C3, N1, C1, S2 were close to the ideal location for evaluation of lint yield. Among them, the most consistent across years were C1 and C3. These two were also the locations with the lowest N rH75. The most discriminative for ranking against VWI infestation were locations C3, S2 and N1.
DISCUSSION
Optimum number of replications and locations for lint yield
The effectiveness or power of a cultivar evaluation scheme can be measured by the achieved trial H or repeatability (DeLacy et al. Reference DeLacy, Basford, Cooper, Bull, McLaren, Cooper and Hammer1996). Within-trial or cross-trial H can be effectively improved by increasing the number of replications or test locations when it is small (e.g. H < 0·75) but cannot be effectively improved when it is large (e.g. H > 0·75). The ‘optimum’ required H, in essence, is a compromise between trial accuracy and the cost required to achieve it (Yan et al. Reference Yan, Fregeau-Reid, Martin, Pageau and Mitchell-Fetch2015).
The results of the current work show that with the current trial evaluation scheme of 8–14 locations and four replications, the H achieved across locations for lint yield was 0·95 and the optimum number of locations was estimated to be three. The high H underpinned, indirectly, the suggestion by Baxevanos et al. (Reference Baxevanos, Goulas, Tzortzios and Mavromatis2006) that Greece is literally a mega-environment and only a small number of locations is required to approach the optimum H of 0·75. In cases where the estimated number of locations for a key trait is considerably higher than is actually used, researchers should consider the possibility of dividing the target region into sub-regions or mega-environments (Yan et al. Reference Yan, Fregeau-Reid, Martin, Pageau and Mitchell-Fetch2015). However, the current data did not support this. Mega-environment analysis could be considered for any trait but it is usually defined with regard to the most economically important trait, lint yield.
Using four replications, the achieved within-trials H for lint yield was 0·75 as the optimum. This is lower than the suggested six replications for lint yield evaluation under US conditions (Meredith Reference Meredith2003) and higher than the three replications proposed by Xu et al. (Reference Xu, Jin and Li2016) under Chinese conditions.
The above findings were drawn by rejecting 0·14 of the trials because of their high CVs (>15%). If these trials had been incorporated into the analysis, then five replications would be the optimum. Five locations out of 14 required an OM of 7–8 replications and should be improved or abandoned. If a location requires many more replications than the actual to realize optimum H, it is advisable to discard it from the analysis; such a location could produce more noise than signal (Yan et al. Reference Yan, Fregeau-Reid, Martin, Pageau and Mitchell-Fetch2015). In any case, trial cancellation should be considered due to poor management, natural disasters or other exogenous factors to ensure a high quality of trials used in the evaluations (Xu et al. Reference Xu, Jin and Li2016).
Location C2, a main breeding site, required five replications and could be substituted by the nearby C1, which was very consistent across years requiring only two replications. Location C3, which required three replications, could also substitute for C2. The southern locations required four or less replications with S2 to be the most consistent. Finally, among the northern and north-eastern locations, N1 was the most consistent (five replications).
Evaluation of test locations for lint yield and verticillium wilt
Plant breeders and agronomists conducting variety trials should have a thorough understanding of their test locations. A location is more desirable as a test site when it is representative of the target mega-environment and/or is of high discriminating ability in separating genotypes. Locations distant to the ideal either fail to discriminate among genotypes or are not representative of other locations (Yan & Kang Reference Yan and KanG2003). However, the ideal location is rare or even non-existent. On the other hand, an unrepresentative but highly discriminative location can be valuable because it can serve as a trait-specific site, e.g. for screening wilt-tolerant genotypes (Baxevanos et al. Reference Baxevanos, Goulas, Rossi and Braojos2008).
Locations closest to the ideal for lint yield were C2, C7, C3, N1, C1 and S2. Among them, the most prominent sites were C1 and C3 because they showed the lowest requirement for replications (⩽3) and high consistency across years. The most discriminative locations were C3, N1, S2 and C1. It is interesting to point out that the most discriminative sites were those with high TVWP infestation level. The most discriminative for ranking against VWI infestation was C3 followed by S2 and N1. Among these three, the most desirable was C3 because it had the lowest N rH75.
Considering the previous discussion, it suggests that this cotton evaluation scheme would not be compromised by reducing the number of locations used from 8–14 to only three effective locations per year. Qualifying a location as ‘effective’ could be based on attributes such as the H realized within each site, the desirability of the site for yield evaluation and/or the desirability of the site for verticillium tolerance selection. However, backup locations should be considered in case of trial failures. The estimated average for trial failures over time was 0·14, and in the current case, one more trial location might be added to the optimum three locations.
Taking into account the previous requirements, C1 could substitute for C2, currently used as the central breeding site, because of its consistency, low N rH75 (two), and its proximity to the ideal. Location C3 is of high value because it could serve as a trait-specific location for verticillium tolerance evaluation and due to its proximity to the ideal for lint yield. Location N1 could be a valuable option in the northern region because of the different climatic conditions in comparison to central and southern parts, its low requirement for N rH75 (four), its proximity to the ideal for lint yield and high DA for verticillium tolerance. Finally, location S2 could serve as backup in southern cotton-growing areas because of its high DA for verticillium wilt, proximity to the ideal for lint yield and low N rH75 (four).
The use of a cultivar (ΙΧ−388) responsive to vein discolouration to characterize TVWP provided useful information on the identification of highly discriminative locations for the evaluation of verticillium tolerance and lint yield. In an evaluation programme, this could help cluster the locations according to the infestation level and evaluate genotypes in each specific environment or group of environments (Baxevanos et al. Reference Baxevanos, Goulas, Rossi and Braojos2008). This approach was used in wheat to characterize yield-limiting factors such as climate, soil fertility and diseases, with the last factor to emerge as more restrictive than climate (Brancourt-Hulmel et al. Reference Brancourt-Hulmel, Lecomte and Meynard1999).
Optimum number of replications and locations for plant height and verticillium wilt
Variation in the optimum number of replications and locations comes as a consequence of trait variation in H. Accurate determination of these numbers for each trait can avoid unnecessary testing costs. Some of the traits are laborious to measure, while others are not critical for making decisions on which cultivar(s) should be advanced.
Plant height was a highly heritable trait and it was indicated that four replications and two locations suffice for its accurate assessment. On the other hand, H of VWI was low. This was ascribed to the fact that verticillium wilt, a soil-borne disease, was unevenly distributed and its virulence was affected by temperature, soil moisture, plant growth stage and soil inoculum levels (Garber et al. Reference Garber, Devay, Goodell, Roberts, Hake, Kerby and Hake1996; Kechagia & Xanthopoulos Reference Kechagia and Xanthopoulos1998). Some of the factors controlling the virulence of verticillium are static and repeatable, such as soil inoculum levels, while others are dynamic or less repeatable, such as temperature and soil moisture, causing significant genotype instability (Baxevanos et al. Reference Baxevanos, Goulas, Rossi and Braojos2008). Moreover, its accurate assessment is difficult and based on empirical scores inferred by visual leaf symptoms. Thus, high variation among replications, locations and growth seasons should be expected (Garber et al. Reference Garber, Devay, Goodell, Roberts, Hake, Kerby and Hake1996). Consequently, a target H = 0·75 was not realistic since high numbers of replications (eight) and locations (15) were required. Thus, when H was set at 0·60, four replications were enough and seven, five and three locations were necessary for a target H of 0·60, 0·50 and 0·40, respectively. Measuring the proper trait in the proper environment is a key factor in the success of plant breeding (Cooper et al. Reference Cooper, Messina, Podlich, Radu Totir, Baumgarten, Hausmann, Wright and Graham2014) and identification of locations with high discriminative ability for VWI (e.g. C3 or S2 as the most discriminating for VWI) has been discussed previously. In particular, locations C3 and S2 needed, on average, five replications to realize within-trial H = 0·75, whereas three replications were enough to realize H = 0·60 (data not shown).
Optimum number of replications and locations for fibre quality
Most fibre traits are subjected more to genotypic than environmental effects, and generally, only two replications per location are sampled in contrast to six determinations for yield (Meredith Reference Meredith2003). Three or fewer locations were required for lint percentage, length and strength; four locations for elongation; nine for micronaire; 11 for uniformity; and 13 for SFI. When the target H was set at 0·60 for micronaire and 0·50 for SFI and uniformity, 3–4 locations were adequate.
The within-trials achieved H was high and ⩽4 replications were sufficient to realize the optimum H of 0·75 for fibre traits. Likewise, when the target H was 0·75, ⩽3 locations were required for lint percentage, length and strength, and four for elongation. When the target H was set at 0·60 for micronaire and 0·50 for SFI and uniformity, 3–4 locations were adequate.
Lint percentage, length and strength were strongly controlled by genotype and a small number of testing locations is sufficient (Meredith Reference Meredith2003). However, strength was the less heritable trait within a trial; it has been previously reported that HVI does not have the ability to discern small genetic differences for strength (Green & Culp Reference Green and Culp1990; May & Jividen Reference May and Jividen1999). It should be noted that in the current trials, pre-commercial lines were tested, which had almost equivalent fibre quality. In a segregated population breeding programme, the differences between genotypes are larger and more measurable. Micronaire is mainly subject to weather conditions (Meredith Reference Meredith, Kohel and Lewis1984), and in the current trials, it showed inconsistency in the required number of locations within each year (3–13). Uniformity and especially SFI were less heritable traits; the results were in agreement with Meredith (Reference Meredith2003) who also reported low repeatability for these traits.
In conclusion, the currently adapted scheme of 8–14 locations was efficient to measure the fibre quality parameters across locations. The currently two replications were insufficient for SFI, uniformity (three) and especially for micronaire and strength (four). However, the reduction of locations for the effective evaluation of lint yield to three did not compromise the precision for lint percentage, length and strength. In contrast, it compromised the precision for elongation, micronaire, SFI and uniformity, which realized an H < 0·75. The use of a backup location for the quality determinations could be a solution since fibre quality traits are less prone to trial failure compared to yield. Increasing number of locations for fibre quality determinations from three to four leads to higher H (>0·60) for elongation and micronaire. On the other hand, an increase of replications to four permits adequate evaluation of all the fibre traits.
CONCLUSIONS
Four replications and four locations (considering the addition of one backup location) are sufficient for the high credibility of a cotton evaluation programme to realize H of 0·75, rather than the 8–14 locations used currently. Locations C1, N1 and C3 were most effective. Location S2 could serve as a backup replacement in cases of trial failure. Plant height was sufficiently evaluated by four replications and two locations, while VWI required the unrealistic eight replications and 15 locations. When the target H for VWI was set at 0·60, four replications were adequate, while H = 0·50 or 0·40 required five or three locations, respectively. The use of a cultivar responsive to vein discolouration was useful in characterizing environmental DA. Thus, location C3 emerged as a trait-specific location for VWI evaluation and required five replications to realize an H of 0·75. Regarding quality traits, an increase of replications to four permits their reliable evaluation. The advantage of reducing the number of locations for the evaluation of lint yield to four does not reduce evaluation precision for lint percentage, length and strength and elongation, but it does for micronaire, SFI and uniformity, which realized lower H (0·60 or 0·50).
The authors thank Delta & Pine Land Co (brand of Monsanto Co) for providing the cotton trials In Greece for study, as well the unknown reviewer for the helpful suggestions that improved substantially this manuscript.