It is suggested by many scholars (see, e.g., Acemoglu and Robinson Reference Acemoglu and Robinson2012) that economic and political outcomes appear to be increasingly intertwined. This implies that it is not an easy task to determine the exact direction of the relationship between economic conditions and electoral outcomes. As a result, it is still an open question whether more fragmented party-systems tend to induce significantly higher levels of government spending and debt (Persson, Roland and Tabellini Reference Persson, Roland and Tabellini2007) or whether the ability of dominant parties to use government resources and the public purse for opportunistic purposes (pork-barrel spending) actually determines how fragmented the party-system will be.Footnote 1 More importantly, though, identifying the channel that links government spending with electoral fragmentation still remains a challenging task. Clearly, the answer to the latter question can have important implications both in understanding the determinants of political success and also in promoting good governance and the design of institutions. It is exactly this dual task that we undertake in this paper. First, we will provide evidence in the direction of this relationship and document empirically that expected government spending determines the degree of electoral fragmentation and support for dominant parties. Second, we will propose a channel that connects those two: machine politics and clientelism operating via strong patronage linkages between voters and dominant parties.
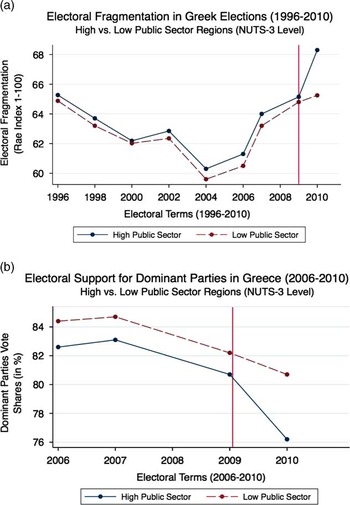
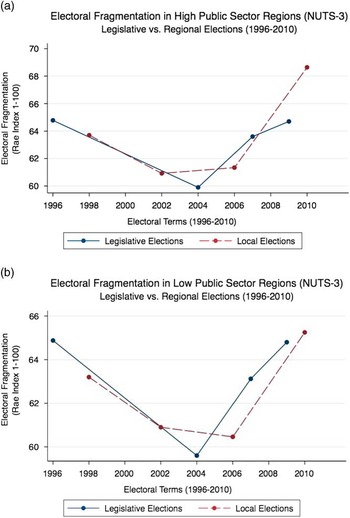
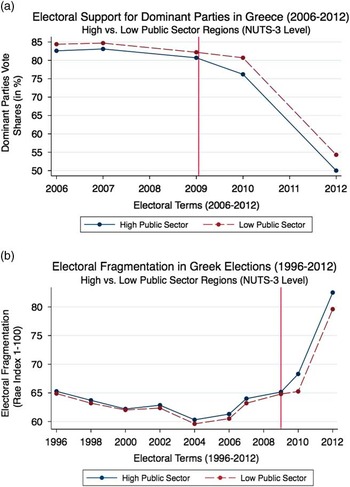
Our main working hypothesis is that rent-seeking voters (clients) lend their support to those parties (the dominant ones) that can utilize the public purse in order to distribute more “pork” to their electoral clientele, mainly via increased government spending. Hence, conditional on the public finances being strong and the degree of institutional constraints being low, dominant parties can exploit their preferential access to the public purse in order to consolidate electorally and increase their votes (Stokes Reference Stokes2005; Golden and Picci Reference Golden and Picci2008). But what will happen if suddenly “pork” becomes unavailable? Clearly, less expected government spending implies less support for dominant parties and hence more electoral fragmentation. Nevertheless, disentangling the causal forces that are driving this relationship and isolating the mechanism that is in operation can be a quite complicated endeavor. The reason is that usually there are many competing mechanisms, which present themselves as plausible explanations to the above relationship. Hence, if the effect operates via our specified mechanism, we should expect that this increase in fragmentation will be more pronounced in those patronage-intense (high public sector) regionsFootnote 2 where large spending cuts are expected to have a greater impact on the durability of the clientelist network and thus voters’ behavior. Moreover, stylized evidence from the 2010 Greek elections seem to support this claim, as it can be clearly seen by the differential increase in electoral fragmentation in those patronage-intense (high public sector) regions (Figure A1).
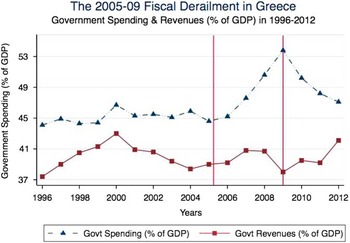
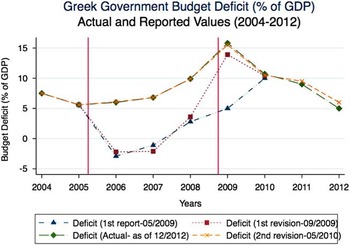
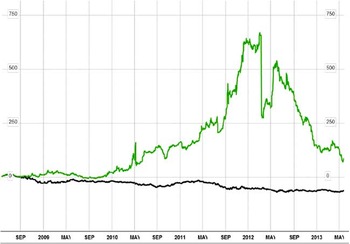
Therefore, we use the data from Greek elections in order to tackle this complication and test our main hypothesis on the mechanism (clientelism and machine politics) that links government spending with electoral fragmentation. The reason is that we can exploit the act of previous Greek government to fiddle the books, from 2005 to 2008, and their subsequent retrospective revision in 2010 (see Figures A2 and A3) as a natural experiment. The intuition is clear: this retrospective revision uncovered the true level of Greek public deficit and debt and revealed the overall poor health of Greece’s public finances (see, e.g., Simitis Reference Simitis2014). In turn, this altered voters’ expectations on how much pork (electorally motivated spending) the dominant parties can now deliver through patronage. Hence, the retrospective revision revealed new information and acted as information shock that generated expectations for drastically reduced pork-barrel spending. This meant that the ability of dominant parties to credibly promise more “pork” was practically extinguished, thus weakening the electoral importance of those patronage linkages. As a result, rent-seeking voters, who used to form the core constituencies of machine (dominant) parties, were now less likely to vote for them, ceteris paribus, leading to a steep and differential increase (decline) in electoral fragmentation (support for dominant parties) in those regions in the 2010 elections (see Figure A1).
Our Contribution
The main contribution of this paper is twofold. First, by demonstrating the existence of a negative (positive) relationship between government spending and electoral fragmentation (support for dominant parties), we uncover a causal link between those two variables that previous literature has so far ignored (see, e.g., Persson, Roland and Tabellini Reference Persson, Roland and Tabellini2007).Footnote 3 More importantly though, by documenting a differential increase in electoral fragmentation in those patronage-intense regions, we are able to pin down the actual channel through which this reverse link operates: patronage and machine politics. Moreover, apart from uncovering the mechanism taking place, this paper also aims to demonstrate the prevalence and importance of political clientelism and patronage in determining electoral outcomes even in an advanced EU member state, such as Greece, which we use as a case study.
Furthermore, in addition to the above-mentioned mechanism, we also explore alternative channels (e.g., protest or economic performance voting) through which reduced government spending and bad public finances can affect support for dominant parties. We are thus able to disentangle the relative impact of the two effects (performance voting versus rent seeking) on the Greek vote between 2010 and 2012 by demonstrating that the two main mechanisms are operating in tandem: machine politics taking place in patronage-intense regions and protest voting occurring across the board. Overall, by documenting empirically the mechanism (patronage) through which government spending is related to electoral fragmentation and by providing a case study from a EU member state, we add on existing literature, which (with few exceptions) has mainly documented the operation of machine politics in developing economies with less advanced political systems (e.g., Chubb Reference Chubb1982; Fox Reference Fox1994; Kitschelt et al. Reference Kitschelt, Mansfeldova, Markowski and Tóka1999; Stokes Reference Stokes2005; Nichter Reference Nichter2008). Furthermore, our work also highlights the role that institutional and financial constraints have in restraining the clientelistic nature of a party-system.
In order to make our case, we rely on models of redistributive (Dixit and Londregan Reference Dixit and Londregan1996; Cox Reference Cox2009; Kriner and Reeves Reference Kriner and Reeves2012; Larcinese, Snyder and Testa Reference Larcinese, Snyder and Testa2014) and machine politics (e.g., Chubb Reference Chubb1982; Cox and McCubbins Reference Cox and McCubbins1986; Kitschelt et al. Reference Kitschelt, Mansfeldova, Markowski and Tóka1999; Stokes Reference Stokes2005; Golden and Picci Reference Golden and Picci2008; Nichter Reference Nichter2008; Pop-Eleches and Pop-Eleches Reference Pop-Eleches and Pop-Eleches2012; Gans-Morse, Mazzuca and Nichter Reference Gans-Morse, Mazzuca and Nichter2014). We briefly discuss some of them in the following section.
Related Literature
The impact of public spending in increasing electoral support for political parties has been studied both within and outside the context of clientelist (machine) politics. The role of political machines (clientelist parties) in getting out the vote and securing electoral support has been extensively documented, especially with reference to developing countries. So far, scattered through the literature are empirical evidence (e.g., Wilson and Banfield Reference Wilson and Banfield1963; Chubb Reference Chubb1982; Fox Reference Fox1994; Kitschelt et al. Reference Kitschelt, Mansfeldova, Markowski and Tóka1999; Stokes Reference Stokes2005; Nichter Reference Nichter2008; Pop-Eleches and Pop-Eleches Reference Pop-Eleches and Pop-Eleches2012; Gans-Morse, Mazzuca and Nichter Reference Gans-Morse, Mazzuca and Nichter2014) that political machines might target core supporters (e.g., Cox and McCubbins Reference Cox and McCubbins1986) and swing voters (e.g., Dixit and Londregan Reference Dixit and Londregan1996; Stokes Reference Stokes2005) alike, either via “pork-barrel” spending, government hand-outs and in-kind transfers or by offering access to various social services and public sector jobs (e.g., Stokes Reference Stokes2005; Nichter Reference Nichter2008; Robinson and Verdier Reference Robinson and Verdier2013) in order to get their vote. More recently, the important role of electorally motivated public spending in securing electoral support for dominant parties have received renewed attention in the context of advanced industrialized democracies as well (e.g., Kriner and Reeves Reference Kriner and Reeves2012; Larcinese, Snyder and Testa Reference Larcinese, Snyder and Testa2014; Matakos and Xefteris Reference Matakos and Xefteris2013).
In particular, Kriner and Reeves (Reference Kriner and Reeves2012) explore the influence of federal spending on US Presidential elections. They study Presidential elections from 1998 to 2008 and they find that voters tend to reward parties (and their presidential nominees) for increased federal spending in their communities. Furthermore, they find that this relationship is stronger in swing-states, something that resonates well with previous theoretical findings on targeted spending on swing voters (e.g., Dixit and Londregan Reference Dixit and Londregan1996). Hence, they conclude that “although voters may claim to favor deficit reduction, presidents who deliver such benefits are rewarded at the ballot box.”
In the same vein, Larcinese, Snyder and Testa (Reference Larcinese, Snyder and Testa2014) test a model of redistributive politics using exit-poll data from US elections. They only find modest support for the conjecture that politicians will favor financially their core constituencies. Yet, as they note, their findings “[…] might reflect features of distributive politics that are particular to the US” and in particular the federal structure of the American government that places multiple checks and balances to political actors. As a result, “[t]he President may have relatively little influence over the distribution of federal expenditures. Perhaps, even though he would like to target […] voters, he cannot.” It is exactly this notion of constraints, institutional or otherwise, which are present in most advanced democracies that our model wants to highlight as important determinants of party-system fragmentation and political power-sharing.
In the context of less advanced party-systems, Stokes (Reference Stokes2005) provides an extensive account on machine politics with an application to Argentina. Stokes finds strong evidence that machine parties target poor voters and among them especially those whose support is in doubt. That is, instead of targeting their core constituencies, as most formal literature suggests (e.g., Dixit and Londregan Reference Dixit and Londregan1996), she finds that machine parties target those swing voters that are the most vocal.Footnote 4 In the same vein, Golden and Picc i examine “whether […] ruling parties direct spending to core or marginal electoral districts” (Reference Golden and Picci2008) and find that districts that elect officials from the governing (dominant) parties receive more public money, as those politicians possess greater political resources and can reward their core constituencies by directing more pork in their districts. In another related essay, Pop-Eleches and Pop-Eleches (Reference Pop-Eleches and Pop-Eleches2012) provide empirical evidence on machine politics from Romania. They find that “incumbents can buy political support through targeted public spending” as the beneficiaries of government hand-outs “were significantly more likely to support the incumbent parties.” Finally, Gans-Morse, Mazzuca and Nichter (Reference Gans-Morse, Mazzuca and Nichter2014) provide a formal framework to evaluate different varieties of clientelism and analyze the strategies that machine (clientelist) parties employ in order to achieve their targets. The main difference of those studies with this paper is the following: we are not solely interested in the re-election probability of the incumbent; rather we are interested in identifying the structural effects of imposing exogenous constraints on the opportunistic behavior of machine parties and on the overall allocation of electoral and political power within a party-system.
In the section that follows, we first develop our theoretical mechanism in more detail and we explain how we can use the information shock in order to get identification. Then, in Data and Identification Strategy: Going NUTS section we present our econometric estimation model and the main results. Discussion and Concluding Remarks section concludes.
Constraining the Political Machines: The Case of Greece
The choice of Greece as a case study is ideal both for methodological and theoretical reasons. First, we can exploit the action of the Greek government to fiddle the books (under-report the deficit figures for 2005–2008) and the subsequent retrospective revision by Eurostat as a natural experiment (information shock) that altered voters’ expectations on future government “pork-barrel” spending. Moreover, throughout its recent political history (1974–2012), Greece has been exclusively governed by stable single-party governments led by one of the two dominant parties (either the center-left Pan-Hellenic Socialist Movement (PASOK) or the center-right Nea Dimokratia (ND)), thus strengthening our argument that the causal relationship is reversed.Footnote 5 Finally, the Greek party-system is characterized by its clientelistic nature and its strong patronage linkages (e.g., Petropulos Reference Petropulos1968; Lyrintzis Reference Lyrintzis1987; Petmezas Reference Petmezas1990; Mouzelis Reference Mouzelis1996; Koliopoulos Reference Koliopoulos1997; Kostis Reference Kostis2005; Elcock Reference Elcock2008) both at the national and (especially so) at the local levels. In the sections that follow we elaborate on each of these points separately.
The Information Shock: Timing of Events
In this section, we present a brief account of the events that took place between the two electoral contests (2009 and 2010) in order to illustrate the nature of the information shock and how we can exploit this retrospective revision in order to get identification.Footnote 6 The sequence of events is as follows:
-
1. August 2009: The conservative Greek government (ND) calls for early elections scheduled for October. The main reason was that the 2009 deficit, previously forecasted at 5 percent, was significantly revised upwards (projected to exceed 10 percent) by the Bank of Greece.Footnote 7
-
2. September 2009: Eurostat publishes the results of the fiscal audit and revises upwards the 2009 deficit estimates by almost 9 percent (~13.8 percent). Following this first revision, elections take place right afterwards (October 2009) and the then-incumbent center-right ND government (in office since April 2004) is largely defeated in the polls by the main challenger, the other dominant party, the center-left PASOK, which gained the absolute majority of seats in the Greek Parliament and formed a single-party government.Footnote 8 Yet, electoral fragmentation remained at previous low levels and the two dominant parties got a joint 80 percent of the vote (very close to their historical average). Moreover, there was no differential impact across regions with high and low public sector size (see Figure A1(a)).
-
3. May 2010: A second revision is published by Eurostat. This new audit, covering the period from 2005 and onwards, is conducted in collaboration with EU’s statistical agency Eurostat.Footnote 9 According to the new estimates, the deficit in 2009 soared at 15.5 percent (1.7 percent more than anticipated, mainly due to measurement error). More interestingly, the audit revealed that the government’s budget deficit for the period 2005–2008 has been systematically under-reported by the previous center-right ND government. In comparison with the previous estimates (September 2009), the overall revision (for the 2005–2008 period) is an astonishing 23 percent.Footnote 10 Moreover, 9 percent of this revision is solely attributed to the concealed deficit from FY 2006 alone. In October 2010, the revised Eurostat report is finalized (see Figure A3).
-
4. November 2010: Elections take place. The incumbent center-left PASOK (in office since October 2009) does not pay a heavy price at the polls for the fiscal misdeeds of the previous center-right ND administration. As a result, it wins convincingly the mid-term elections, securing eight out of 13 regional gubernatorial posts (including the Athens metropolitan region with more than three million registered voters) and almost all major municipalities. Yet, electoral fragmentation rises to a new high (up to 69 percent from 65 percent within a year) and support for the two dominant parties reached a then-historic low.
Main Mechanism and Theoretical Framework
The reason that we can exploit this retrospective revision as an information shock is that the actual deficit figures for 2005–2008 were concealed by the Greek authorities and were only uncovered by Eurostat retrospectively, before the November 2010 elections. Hence, in the period from November 2009 to October 2010, while information concerning the current economic situation remains virtually unchanged,Footnote 11 new information concerning the real size of the 2005–2008 budget deficits becomes available (see Figure A3). As this retrospective revision concerns deficits that were incurred mainly in 2005 and 2006, but were not reported, it is clear that this additional increase in government debt between these two electoral contests cannot be attributed to policies followed by the newly elected PASOK administration during the last couple of months. Rather, it is attributed to the disclosed information that both the voters and the markets previously ignored (see Figure A4).Footnote 12 Hence, this revision was a pure information shock that changed expectations over the government’s ability to engage in extensive pork-barrel spending and rent distribution in the future. That is, not only was Greece ruled by a single-party government since 1974, but on the top of it, it was information about past, not current, fiscal performance that triggered this change in voters’ expectations. This shift in expectations over future rents, caused by new information, allows us to address any concerns over reverse causality and identify the effect of expected government spending on fragmentation.
In this particular context, where the two big machine parties (PASOK and ND) dominated the political landscapeFootnote 13 establishing a very extensive clientelistic network, the politicians supported by those parties apart from policy proposers also constitute centers of clientelistic networks (Elcock Reference Elcock2008). That is, before each election candidates make promises regarding the size and composition of their network. Obviously, these promises depend upon the size of the “pork” that they can attract from the central government, which, in turn, depends (a) on how much pork there is available; and (b) on how well connected the local candidate is with the central government.Footnote 14 Hence, candidates supported by the two big parties enjoy an advantage compared with all other candidates. They tend to better connected with central government and as evidence shows (see, e.g., Golden and Picci Reference Golden and Picci2008) they can attract more pork to their districts, thus making their promises of distributing rents to the voters more credible compared with other competitors. As a result, they were able to attract more votes (see, e.g., Stokes Reference Stokes2005) and their vote share was significantly higher (and fragmentation was lower) than what would have otherwise been, if those voters were to make their decision solely based on ideological terms in the absence of those transfers.
Nevertheless, after the revelation of new information and the resulting foreign fiscal monitoring from the Troika, their promises lost credibility. That is, the information shock acts as an exogenous fiscal constraint placed by the markets that limits the ability of dominant parties to credibly promise more electorally motivated government spending and rents. As a result, rent-seeking voters, who used to vote for the two machine parties, are now anticipating that the central government will have less pork available for distribution as expected spending cuts will reduce the size of rents and public sector employment.Footnote 15 Therefore, the advantage that dominant parties and their candidates enjoyed as compared with others was eliminated. Thus, support for dominant parties is also expected to drop (and electoral fragmentation is expected to rise) relatively more in the patronage-intensive (high public sector) regions that are the ones most affected (see also Hicken Reference Hicken2011).
But, why should rent-seeking voters abandon those parties – thus causing a differential increase in electoral fragmentation in these regions that used to receive relatively more pork – especially since other candidates cannot credibly promise more pork?Footnote 16 The answer is simple: assume that the central government cuts by half the pork allocated to two regions. If in one region the before-cuts allocated pork was one billion euros (and could finance a large clientelistic network) while in the other region it was just one million (and can hence finance a very small network), then the electoral effect of the cut should be dramatic in the first region while in the second one it should be negligible. That is, in this context of multi-dimensional electoral competition (where the first dimension is social ideology and the second is the size of rents)Footnote 17 the reduction in the size of pork that can be distributed in the first region reduces the importance of the clientelistic network and increases the salience of the traditional dimension. In that respect, “client-voters” are now “liberated” from their dependence on pork. This implies that their electoral behavior resembles more to that of the voters in the second region: it is now driven relatively more by the traditional social ideology dimension.Footnote 18 Hence, those voters who abandon the dominant parties do so not because the other parties have something more to offer but because their voting behavior is now determined to a greater extent by their social ideology. As a result (ceteris paribus), electoral fragmentation is expected to decline by more in those regions. In the section that follows, we develop a very simple model that spells out in a more formal way the theoretical arguments presented above.
A Parsimonious Model of Multi-Dimensional Choice
To fix ideas further, assume that each region is characterized by the level of public money—“pork”—that they receive. In any such representative region, candidates run for office. The space of electoral competition is bi-dimensional. That is, there is one non-monetary (e.g., social ideology) and one monetary (transfers) dimension. In the first dimension (non-monetary), candidates’ platforms are assumed to coincide with the platforms of the parties they are affiliated with. Candidates, apart from social ideology, are also free to promise transfers to individuals or to groups of voters (job and project contracts, targeted public facilities, etc.) in order to get their votes (Stokes Reference Stokes2005). In a centralized state where all transfers depend on central government, the effect of these promises on the electoral support of each candidate obviously depends on three factors as follows: (i) on the health of the central government finances, (ii) on previous allocation of funds to that region, and (iii) on the “ability” of the candidate to attract funds from the central government, which depends on her partisan identity. It is hence straightforward that candidates who are supported by governing parties (present or future) are better connected with those who control pork-barrel transfers and can attract more pork-barrel spending in order to reward their clientele (Golden and Picci Reference Golden and Picci2008).
In the case of Greece, which certainly fits the description of a centralized state (see also Supplementary Appendix), we observe that (a) from 1974 until 2010 Greece only experienced single-party governments of PASOK and ND and (b) during each of the two most recent local administrations electoral terms (2002–2006, 2006–2010) both PASOK and ND governed the country for at least a year each.Footnote 19 That is, candidates in local elections supported by PASOK and ND could more credibly make transfer-related promises compared with other candidates. For a comprehensive description of the role of local authorities in Greece and their manipulation by party interests, see Elcock (Reference Elcock2008).
Following the literature on multi-dimensional electoral competition (e.g., Groseclose Reference Groseclose2007; Anesi and de Donder Reference Anesi and de Donder2009; Krasa and Polborn Reference Krasa and Polborn2010; Dziubiński and Roy Reference Dziubiński and Roy2011; Krasa and Polborn Reference Krasa and Polborn2012; Krasa and Polborn Reference Krasa and Polborn2014; Matakos and Xefteris Reference Matakos and Xefteris2013), we consider the following specification. Voters in each region have symmetric single-peaked preferences on a one-dimensional social ideology space (say the [0,1] segment), but at the same time they also receive utility from direct transfers (in the form of rents).Footnote 20 Their ideal policies are distributed uniformly on the policy space. Formally, a voter with ideal policy i derives utility:
 $$U_{i} \left( {p_{J} ,\,t_{J} } \right)={\minus}\left| {i{\minus}p_{J} } \right|{\plus}t_{J} ,$$
if a candidate who is supported by a party J with social ideology platform p
J
is elected and promises a transfer of size t
J
from the central government to the region (this can be thought of as the average or else as the per capita transfer toward a representative voter). In line with these assumptions consider, for expositional simplicity, a four candidates specification such that J∈{L, PASOK, ND, R} and that t
PASOK
=t
ND
>t
j
for every J∈{L, R}. Moreover, assume that each candidate J is arranged on the segment [0,1] such that
 $$ p_{L} \,\lt \,p_{{PASOK}}\, \lt \,p_{{ND}} \,\lt \,p_{R} $$
. To analyze this situation and compute how each party’s vote shares varies with t
J
and p
J
, one needs to identify the voter I who is indifferent between voting for candidate L and PASOK, between PASOK and ND and finally between ND and R.Footnote
21
Then, by indifference and t PASOK =t ND we have that:Footnote 22
 $$ i_{{L,PASOK}} ={{p_{L} {\plus}p_{{PASOK}} } \over 2}{\minus}{{(t_{{PASOK}} {\minus}t_{L} )} \over 2},$$
 $$i_{{PASOK,ND}} ={{p_{{PASOK}} {\plus}p_{{ND}} } \over 2}{\minus}{{(t_{{ND}} {\minus}t_{{PASOK}} )} \over 2}={{p_{{PASOK}} {\plus}p_{{ND}} } \over 2} ,$$
 $$i_{{ND,R}} ={{p_{{ND}} {\plus}p_{R} } \over 2}{\minus}{{(t_{R} {\minus}t_{{ND}} )} \over 2}.$$
For expositional simplicity, we let
 $$p_{L} =0,\, p_{{PASOK}} ={1 \over 3},\, p_{{ND}} ={2 \over 3},\, p_{R} =1$$
and
 $$ t_{L} =0,\, t_{{PASOK}} =\tau ,\, t_{{ND}} =\tau , \,t_{R} =0$$
.Footnote
23
Then, from (1), (2) and (3) above one can easily solve for the indifferent voters between L and PASOK, PASOK and ND and ND and R, which are respectively:
 $$i_{{L,PASOK}} ={1 \over 6}{\minus}{\tau \over 2},\,i_{{ND,PASOK}} ={1 \over 2}\,{\rm and}\,i_{{ND,R}} ={5 \over 6}{\plus}{\tau \over 2}$$
Then, for every
 $$\tau \, \lt \, 1/3 $$
it is easy to show that all voters with ideal policy from 0 to
 $${1 \over 6}{\minus}{\tau \over 2}$$
prefer the candidate supported by party L to each of the other three candidates, all voters with ideal policy from
 $${1 \over 6}{\minus}{\tau \over 2}$$
to
 $${1 \over 2}$$
prefer the candidate supported by PASOK to each of the other three candidates, all voters with ideal policy from
 $${1 \over 2}$$
to
 $${5 \over 6}{\plus}{\tau \over 2}$$
prefer the candidate supported by ND to each of the other three candidates and all voters with ideal policy from
 $${5 \over 6}{\plus}{\tau \over 2}$$
to 1 prefer the candidate supported by party R to each of the other three candidates.
Therefore, a straightforward computation yields the following vote shares for each candidate:
 $$v_{L} ={1 \over 6}{\minus}{\tau \over 2}$$
, for the candidate supported by party L;
 $$v_{{PASOK}} ={1 \over 3}{\plus}{\tau \over 2}$$
, for the candidate supported by PASOK;
 $$v_{{ND}} ={1 \over 3}{\plus}{\tau \over 2}$$
, for the candidate supported by ND; and
 $$v_{R} ={1 \over 6}{\minus}{\tau \over 2}$$
, for the candidate supported by party R. Hence, the cumulative vote share of the candidates supported by PASOK and ND is given by:
 $$V_{{PASOK{\plus}ND}} =2/3{\plus}\tau .$$
In turn, the Rae (Reference Rae1968) index of electoral fragmentation is given by:
 $$F=1{\minus}v_{L}^{2} {\minus}v_{{PASOK}}^{2} {\minus}v_{{ND}}^{2} {\minus}v_{R}^{2} ={{13} \over {18}}{\minus}{\tau \over 3}{\minus}\tau ^{2} .$$
We can now perform a comparative statics analysis and see what would happen to electoral fragmentation if t
J
, for J∈{PASOK, ND} were to decrease by a fraction s∈(0,1). That is,
 $$t'_{J} =\tau (1{\minus}s)$$
. In such a case the cumulative vote share of the candidates supported by PASOK and ND would become:
 $$\tilde{V}_{{PASOK{\plus}ND}} =2/3{\plus}\tau (1{\minus}s).$$
Also, electoral fragmentation would become:
 $$\tilde{F}={{13} \over {18}}{\minus}{{\tau (1{\minus}s)} \over 3}{\minus}[\tau (1{\minus}s)]^{2} .$$
Therefore, the change in the cumulative vote share of these two candidates (after the announcement level minus before the announcement level) would be:
 $$\Delta V_{{PASOK{\plus}ND}} =\tilde{V}_{{PASOK{\plus}ND}} {\minus}V_{{PASOK{\plus}ND}} =-\tau s\, \lt \, 0.$$
Similarly, the change in the levels of the electoral fragmentation (after the announcement level minus before the announcement level) would be:
 $$\Delta F=\tilde{F}{\minus}F={1 \over 3}s\tau \left[ {1{\plus}3\tau (2{\minus}s)} \right]\gt 0.$$
Notice that (a) fragmentation increases when promised transfers decrease (i.e., when s increases), (b) the cumulative vote share of the candidates supported by PASOK and ND decreases when promised transfers decrease and most importantly (c) the absolute value of each of these changes is increasing in τ. That is, the larger the value of τ (size of transfers before the announcement of the cut) the larger the increase (decrease) that will be observed in the degree of electoral fragmentation (cumulative vote share of the candidates supported by PASOK and ND).
Given that the pre-cut size of public sector transfers τ is directly analogous to the intensity of patronage linkages in that specific region (see, e.g., Keefer Reference Keefer2005; Hicken Reference Hicken2011), our results suggest that patronage-intense (high public sector) regions will be impacted relatively more from those cuts. The intuition should also be clear. In those low public sector regions (regions with low initial τ), dominant parties did not rely a lot on those transfers in order to get additional votes and voting behavior was mostly driven by voters’ preferences in the second (non-monetary) dimension. Hence, the effect of a spending cut on their vote shares (and fragmentation) is negligible. Contrary to that, in the high public sector regions dominant parties relied heavily on those transfers to get a relatively larger amount of additional votes as voters who were otherwise relatively more inclined (on social ideology grounds) to vote for either party L or R would now rather vote for them. Obviously, when those transfers are reduced the relatively more distant voters abandon the dominant parties not because other parties can offer them more rents but because in absence of sizeable transfers the social ideology component of their preferences (e.g., immigration, religion and race) dominates their choice. Thus, spending cuts have a relatively greater impact in those regions where voting behavior was mostly driven by rent seeking rather than ideology.
To see this point more clearly, we provide a stylized example. Assume that there are only two regions (one high and one low public sector, respectively) such that in the first one τ
1=0.1, whereas in the second τ
2=0.2. That is, the size of the public sector is twice as much in the second region. Then a straightforward computation reveals that in the first region
 $$V_{{PASOK{\plus}ND}}^{1} =0.767$$
, whereas in the second one we have
 $$V_{{PASOK{\plus}ND}}^{2} =0.867$$
.Footnote
24
That is, the two dominant parties get an extra 10 percent of the vote in region 2. Now consider what happens if there is a 50 percent cut in those transfers in both regions (i.e., s
1=s
2=0.5).Footnote
25
As before one can calculate the post-cut cumulative vote shares in both regions and see that
 $$\tilde{V}_{{PASOK{\plus}ND}}^{1} =0.717$$
while
 $$\tilde{V}_{{PASOK{\plus}ND}}^{2} =0.767$$
.Footnote
26
That is, even though the two dominant parties still receive a larger share of the votes in the second region as compared with the first one, their cumulative vote share has decreased differentially by 5 percent more in region 2.
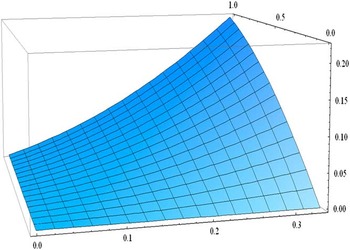
Moreover, notice that the fact that the change in fragmentation is increasing in τ does not imply that all rent-seeking voters will abandon those parties. Neither does it imply that the number of rent-seeking voters who support those parties in the high public sector regions is smaller in absolute terms than those who support them in the low public sector ones, as it is still the case that the two dominant parties get more votes in the high public sector regions. But, in relative terms, their vote shares decrease by a larger proportion and electoral fragmentation increases by more. In Figure A5 we present this result graphically. It is clear that fragmentation increases in both regions as spending cuts become deeper (when s is increasing). This corresponds to our first hypothesis. In addition, observe that for any given level of cuts s∈(0,1) the increase in fragmentation is larger the larger the size of pre-cut transfers τ was. This corresponds to our second hypothesis (the differential increase of fragmentation in high public sector regions).
Data and Identification Strategy: Going NUTS
In this section, we formulate and test our two hypotheses. Our first hypothesis is that expected government spending cuts caused an increase in electoral fragmentation in 2010. That is, the causal link runs from economic to political outcomes. Second, we identify the mechanism through which this effect operates (patronage and protest voting) and we hypothesize that the impact of those expected cuts (operating via the above mechanism) should be more pronounced on those patronage-intense (high public sector) regions. That is, the increase (decrease) in fragmentation (support for dominant parties) should be relatively larger there, since voters expect fewer rents from the machine parties as a result of the cuts. Moreover, by documenting this differential increase in electoral fragmentation we are also able to disentangle the effect of our proposed mechanism from that of simple economic or performance (accountability) voting (see, e.g., Kiewiet Reference Kiewiet1983; Kinder, Rosenstone and Hansen Reference Kinder, Rosenstone and Hansen1983), which we expect to be uniform across regions, as evidence seem to suggest (see Figures A6(a) and A6(b)). In the following section, we briefly describe our data and estimation model.
Data Description and Estimation Model
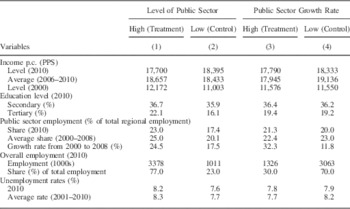
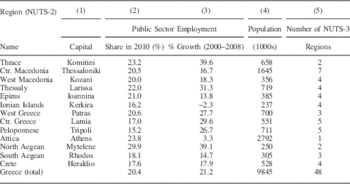
We organize our data at the regional (NUTS) level.Footnote 27 The data on regional electoral fragmentation are own calculations using official electoral data from the Greek Ministry of Interior that are publicly available. Electoral data in our sample are collected from 2007 to 2012. This includes four electoral races (three legislative in 2007, 2009 and 2012 and one regional in 2010).Footnote 28 We have also supplemented our data with a series of economic and socio-demographic indicators, which were retrieved from Eurostat’s online regional database and LFS survey (2014) and the Eurobarometer Surveys (data on trust).Footnote 29 We split the regions into two groups: those with public sector size above the national average and those below. From the 48 regions, 22 are classified as high public sector regions (quasi-treatment group), while the remaining 26 are the control group. We also employ two alternative specifications: one with continuous treatment effects and another where we split the regions based on the growth rate (not the overall share) of public sector employment from 2000 to 2008. Tables 1 and 2 present the summary statistics for those two groups.
Summary Regional Statistics for High and Low Public Sector Regions

Source: data on educational attainment are taken from ELSTAT (Greek Statistical Authority) Population Census (2011). Data on regional unemployment (NUTS-3 level), income and public sector employment statistics are taken from the Eurostat Online Regional Database (April 2014) and LFS Survey (2014).
Note: Income is measured in Harmonized PPP. Public sector employment is given as a share of total employment. Data on employment sectoral composition at the NUTS-3 level are only available until 2012. Data on educational attainment extend until 2011.
Summary Statistics of Population and Public Sector Employment at the Periphery Level

Source: data collected from HELSTAT 2011 Census, Greek Ministry of Interior and Public Administration and Eurostat’s Online Regional Database and LFS survey (2014).
Note: all data are reported at the regional level. Computation of growth rates in column 3 is from own calculations. We measure the size of the public sector as the share of public sector employment (central government, SOE’s and local government) over total regional employment. The public sector employment share levels reported in column 2 are the regional averages for 2010. Growth rates of public sector employment are calculated for the period from 2000 to 2008. Population statistics refer to registered voters that are eligible to vote (>18 years old). In total there are 22 NUTS-3 regions classified as high public sector level regions (note: from Thessaly we have excluded a single NUTS-3 region (Karditsa) for being predominantly agricultural), while there are 23 NUTS-3 regions categorized as regions with high growth rate of public sector employment (2000–2008).
Dependent variable: electoral fragmentation
Before presenting our econometric model we first describe how we have constructed our dependent variable. Formally, we measure electoral fragmentation at the regional (NUTS-3 and NUTS-2) levels according to the index proposed by Rae (Reference Rae1968) as:
 $$ F_{{it}} =1{\minus}\mathop \sum\limits_n (v_{{nit}} )^{2} ,$$
where v nit is the vote share of a party/candidate n, in region i, at electoral term t. Moreover, we also employ an alternative dependent variable: the sum of the vote shares of the two dominant parties, PASOK and ND. While previous literature (e.g., Persson, Roland and Tabellini Reference Persson, Roland and Tabellini2007) has solely relied on the Rae index to measure electoral fragmentation there are good reasons why one would like to use this alternative dependent variable. As electoral fragmentation is an aggregate variable, it can still vary when voters switch their choice between the two dominant parties. Suppose for instance that some fraction of the ND voters (the incumbent dominant party in 2009) have decided to punish the incumbent (perhaps because it fiddled the books) by voting mainly for the main challenger PASOK (the other dominant party) while few others chose to vote for smaller parties. This should also increase fragmentation but such an “accountability” story is a bit mechanical. Therefore, it is neither very interesting nor surprising. That is, the aggregate electoral fragmentation index is not immune to such mechanical explanations.
On the other hand, our identification strategy is based on a totally different mechanism. Our claim is that rent-seeking voters have abandoned both dominant parties in expectation of less “pork due to the information shock.” Hence, in order to rule out such mechanical explanations, we repeat all our estimates using the sum of vote shares of the two dominant parties (TOP-2 as we call it).Footnote 30 This alternative variable is completely insensitive to vote swaps between the two major parties, thus successfully addressing the concerns raised above regarding the mechanical part of the “accountability” story. Such vote swaps will be fully ignored by our variable that only records the net voter diffusion from both big parties toward the minor ones. This leaves us with only two other competing (to our patronage and rent seeking) mechanisms: protest and economic (or performance) voting. We take up on them in the section following the presentation of our results.
Finally, in order to further insulate our estimates we take one additional step in the way we operationalize the measurement of our dependent variables. We sum the vote shares of rebel candidates Footnote 31 together with those ones of their mother-parties for the 2010 (post-shock) elections. As a result, we underestimate (overestimate) electoral fragmentation (the sum of vote shares of the two big parties) in 2010.
Econometric model
In order to test our hypotheses, we estimate a standard Differences-in-Differences model:Footnote 32
 $$F_{{it}} =\beta _{0} {\plus}\beta _{1} {\asterisk}(POST)_{t} {\plus}\beta _{2} (HIGH\,PUB. SECTOR{\asterisk}POST)_{{it}} {\plus}\gamma _{i} {\plus}X_{{it}}^{'} {\plus}{\varepsilon}_{{it}} ,$$
where POST is a dummy variable taking the value of 1 for all the post-information shock periods (i.e., for 2010),
 $$HIGH\,PUB.SECTOR{\asterisk}POST$$
is the interaction dummy,
 $$X_{{it}}^{'} $$
is the set of other controls and γ
i
are region dummies (fixed effects).Footnote
33
The coefficients of interest are β
1 and β
2. They capture the effect of the information shock (less expected “pork”) and its differential impact on high public sector regions, respectively. We expect both of them to be positive when electoral fragmentation is our dependent variable (and negative when we replace electoral fragmentation with the sum of the vote shares of the two dominant parties).
One concern over our identification strategy is related to the nature of the information shock and how to identify the net effect of spending cuts. While we address successfully the issue of reverse causality, by the means of the natural experiment, there might still be some worry over the fact that in the months between November 2009 (post-2009 elections period) and October 2010 (pre-2010 elections period) in addition to expectations about the size of future rents, other things that could potentially affect electoral fragmentation (and support for dominant parties) might have changed as well.Footnote
34
While this is certainly not true for some variables, such as educational attainment, urbanization levels and other socio-demographic characteristics that affect voting behavior but are almost impossible to change within 11 months, the same cannot be argued for economic variables (e.g., unemployment, income, migration rates) or perceptions and sentiments. As a result, anything else changing in those 11 months, and positively correlated with government spending cutsFootnote
35
would bias the effect of expected spending cuts on electoral fragmentation upwards.Footnote
36
Therefore, in order to account for those variables that might change in the period under consideration we have decided to include in our regressions a vector of controls
 $X_{{it}}^{'} $
, which includes variables such as unemployment, income per capita, migration and a dummy variable controlling for incumbent re-election. Moreover, in some specifications we interact the control variables with the HIGH PS dummy in order to account for the possibility that some variables might have a differential impact on high public sector regions.
In addition to the steps taken above, we also estimate our model using population weights for each region. But instead of using the number of registered voters, we weight our sample using the number of voters who turned out in the 2010 elections.Footnote 37 This ensures that the metropolitan region of Athens, the region that exhibited the biggest increase in fragmentation in 2010, is deliberately under-represented in the sample.Footnote 38 Second, in some specifications we completely exclude this region to account for heterogeneous, unobservable demographic characteristics (e.g., urbanization and education levels) that allow voters to acquire and process information regarding the economic situation faster. The general idea of all these steps is to be very conservative in estimating the increase (decrease) in electoral fragmentation (support for dominant parties) for the 2010 election, especially for the high public sector regions. If we can still get statistically significant, large in magnitude and positive coefficients on the POST and the HIGH PS∗POST variables, then this would imply that the effect we are capturing is important. In addition to the specification in Equation 4 we also estimate a model with continuous treatment effects. That is, we replace the HIGH PS dummy variable with the variable that was originally used to construct it: the actual size of the public sector, measured by the size of public sector employment as in Hicken (Reference Hicken2011). Formally, we estimate the following equation:Footnote 39
 $$\Delta F_{{i,t}} =\alpha _{0} {\plus}\beta _{1} POST_{t} {\plus}\beta _{2} F_{{i,t{\minus}1}} {\plus}\beta _{3} Public\,Sector\,Size{\plus}\gamma _{i} {\plus}X_{{it}}^{'} {\plus}\xi _{{it}} ,$$
where ΔF i,t =F i,t −F i,t−1.
Clearly, at least in the two-election models (i.e., when t=2010) this specification is exactly equivalent to the standard difference-in-difference specification in (4) and allows the estimation of continuous intensity to treatment effects. Therefore, we should also expect β 3>0 (and β 3<0 when we replace electoral fragmentation with the sum of the vote shares of the two dominant parties). Finally, in order to check the common trends assumption we estimate a series of placebo regressions where we move exposure to treatment (information shock) two electoral periods into the past using data from elections before 2007 (i.e., from 2006, 2004 and 2002).
Results: Two-Election Sample (2009–2010)
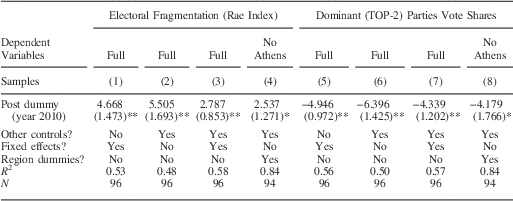
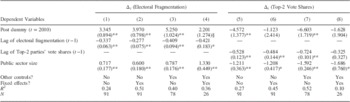
Tables 3–5 present the estimates of the above models using the small sample (2009 and 2010 elections). In Table 3, we estimate a simplified version of the model without the inclusion of the interaction term HIGH PS*POST in order to verify our first hypothesis: the positive (negative) effect of the information shock on electoral fragmentation (on the cumulative vote shares of the two dominant parties). Under all alternative specifications, expected government spending cuts (the coefficient on the time dummy) caused a 3–5 percentage point increase in fragmentation across all regions or a 4–6 percentage point decline in the vote shares of the two dominant parties. Moreover, the coefficients are statistically significant at least at the 5 percent level and always have the expected signs. Moreover, in columns 4 and 8, the exclusion of Athens metropolitan region from the regressions does not change our estimates significantly.
Weighted-Ordinary Least Squares Regressions on the Effect of the Information Shock on Electoral Fragmentation and Support for the Dominant Parties: Two-Election Sample (2009–2010)
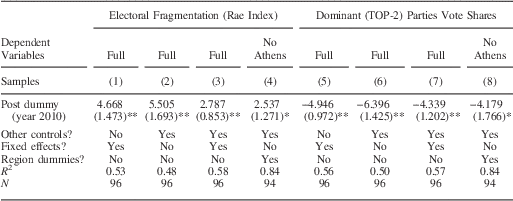
Note: robust standard errors clustered at the region (NUTS-3) level reported in parentheses. Other controls include regional unemployment rates (%), the natural log of the regional income per capita (in EU harmonized purchasing power standard terms) reported at the NUTS-3 level, regional (statistically adjusted) net migration rate (in %) and a local elections dummy. In columns 4 and 8 Athens metropolitan region was excluded from the regressions. In columns 1, 3, 5 and 7 a simple fixed effects estimator was employed using the estimation command xtreg (i.e., no region dummies).
*p<0.05, **p<0.01.
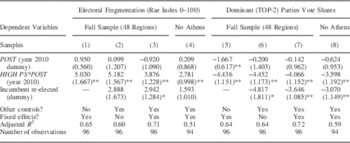
Weighted-Ordinary Least Squares Regressions (2009–2010) on the Differential Impact of the Information Shock (Expected Government Spending Cuts) on High Public Sector Regions

Note: robust standard errors clustered at the region (NUTS-3) level reported in parentheses. Other controls include regional unemployment rates (%), the natural log of the regional income per capita (in EU Harmonized Purchasing Power Standard terms) reported at the NUTS-3 level, regional net migration rate (in %), a dummy variable indicating high public sector regions and a local elections dummy. In columns 4 and 8 the Athens metropolitan region was excluded from the regressions. In columns 1, 3, 4, 5, 7 and 8 a simple fixed effects estimator has been employed using the xtreg command. Dominant (TOP-2) parties’ vote shares variable is calculated by summing the vote shares of the two dominant parties: PASOK and ND.
*p<0.05, **p<0.01.
Weighted-Ordinary Least Squares Regressions with Continuous Intensity of Treatment (Public Sector Size) Effects on Electoral Fragmentation and Support for Dominant Parties (2009–2010)

Note: robust standard errors clustered at the region level reported in parentheses. In columns 1–4 the dependent variable is the difference in electoral fragmentation (measured by the Rae index) between the 2010 and 2009 elections. In columns 5–8 the dependent variable is the difference in the cumulative vote shares of the two dominant parties (PASOK and ND) between the 2010 and 2009 elections. Other controls include regional unemployment rate (%), the net (statistically adjusted) regional migration rate (%) and a dummy variable indicating whether the incumbent was re-elected.
*p<0.05, **p<0.01.
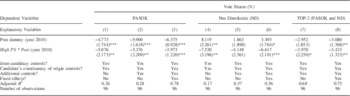
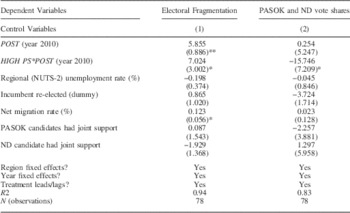
In Table 4, we present the results from estimating Equation 4 on the small sample (with two elections, 2009 and 2010, and without the use of lead and lag terms) under various alternative specifications. In columns 1–4 our dependent variable is Electoral Fragmentation, while in columns 5–8 we replace it with the sum of vote shares of the two dominant parties (TOP-2) for the reasons presented in detail before. Under all specifications, the two coefficients of interest are positive (negative for the case of TOP-2) and statistically significant even at the 1 percent level. In columns 1–2 and 5–6 we estimate Equation 4 using a simple fixed effects estimator (with no controls and no region dummies) in order to test our second hypothesis: the differential impact of those cuts on high public sector regions (less expected rents weakened the patronage links, which in turn imply less support for clientelist parties). In columns 3–4 and 7–8 we include additional controls as a robustness check and also in order to control for unemployment, income and migration, which may have changed over the course of those 11 months and might be driving the effect. We find no such evidence.
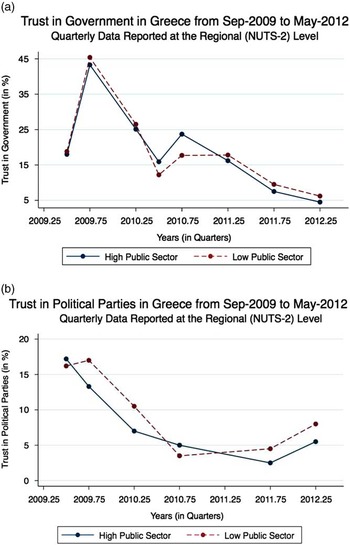
Moreover, as we can observe from columns 3–4 and 7–8 almost all of the documented increase (decrease) in fragmentation (support for dominant parties) in Table 3 is attributed to the differential impact that expected cuts had in the high public sector regions. That is, electoral fragmentation (support for dominant parties) rose (decreased) differentially by almost 5 percentage points. This finding further enhances our point on the reverse link and also on our proposed causal mechanism. Hence, even though the coefficient on “expected cuts” β 1 is a time dummy, leaving open the possibility that something else might have changed during that period, the fact that trust moved in parallel across the two regions (see Figures A6(a) and A6(b)) while fragmentation changed differentially makes it very unlikely for trust or any other type of performance and accountability arguments to be driving this effect. If one adds to that the fact that we have found no evidence that other economic variables (that also vary over time) can explain this effect, we are left with the conclusion that the single-most plausible explanation that can account for the differential impact on high public sector regions is our patronage mechanism.Footnote 40 It is clear that the accountability (performance) or protest voting stories cannot explain this differential decline in the vote shares of the two dominant parties in the 2010 elections.Footnote 41
In Table 5 we present the estimates of our model using the continuous values of the variable that measures the size of the public sector (intensity of treatment variable).Footnote 42 Again, one can observe that the results we are getting are not substantially different from those presented in Tables 3 and 4, even though we use a continuous measure of the intensity of clientelistic linkages (the share of public sector employment in each region). All our estimates are statistically significant at any conventional level. Moreover, our coefficient estimates are large in magnitude, which implies that they are also politically and economically relevant: on average dominant parties experienced an additional 6 percentage point decline in their electoral support in a region whose public sector size is 1 SD above the mean. That is, our estimates in Table 5 are almost identical with those in Table 4.
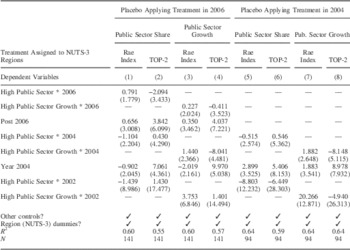
Finally, in Table 6 we present the results of our placebo estimates where we apply the treatment to past voting outcomes (in the 2004 and 2006 elections) in order to establish that the parallel trend assumption is satisfied.Footnote 43 As it can been seen, in all the specifications, the coefficients on the interaction terms High Public Sector*2006 and High Public Sector*2004 fail to be statistically significant at any conventional level, thus confirming our identifying hypothesis of the parallel trend of electoral fragmentation (and support for dominant parties) across high and low public sector regions.
Weighted-OLs Placebo Regressions (Data only Before 2007 Election)

Note: robust standard errors clustered at the NUTS-3 level reported in parentheses. Other controls include the natural log of regional (NUTS-3 level) GDP per capita (in PPP terms), regional unemployment rate (%), a dummy variable for local elections, a dummy variable accounting for incumbent re-election and electoral period (year) dummies. Athens metropolitan region is excluded from all specifications. All data are before the 2007 elections (that is from the 2002, 2004 and 2006 elections).
*p<0.05, **p<0.01.
Identification Revisited: Addressing Competing Mechanisms
While our findings so far provide some strong evidence in favor of our hypotheses, in this section we provide further conclusive evidence that will help us rule out any competing alternative explanatory mechanisms such economic or protest voting. Initially, we focus on protest voting and trust, which was briefly discussed in the section above. We take several steps to address such concerns. First, we collect data on trust (both toward the government and the party-system at large) in order to identify whether trust changed differentially across the two groups of regions in 2010. As Figures A6 shows, we find no evidence for that.Footnote 44 In fact, trust declines in parallel across the two groups of regions (there is no differential effect) while electoral fragmentation (and support for dominant parties) change differentially (see Figure A9). Hence (lack of), trust for the political parties cannot explain the observed pattern.
Second, we extend our model to cover four electoral races (we use data from the 2007 and 2012 elections). This allows us to estimate a version of Equation 4 where we also include treatment leads (anticipatory effects) and lags (post-treatment effects) in order to account for pre-existing trends and make sure that the effect we are picking up in 2010 is indeed attributed to the information shock (and the expectations for less “pork”) and not some other source of variation. We also introduce electoral year dummies (λ t ) to account for time-specific trends.Footnote 45
Moreover, by extending our analysis to include the May 2012 elections, where trust toward dominant parties and government collapsed (see Figures A6(a) and A6(b)), we can disentangle the impact that these two effects had. Given that Greece continued to be shut-off from the financial markets in 2012 as well, the information and the resulting expectations regarding the ability of PASOK and ND to engage in clientelistic spending have not been revised or updated. Therefore, if our mechanism (that the information shock changed expectations on future rents thus causing fragmentation to rise more in certain regions in 2010) is accurate, then one should expect that there should be no such gap in fragmentation (support for dominant parties) between the two groups in the election before the treatment (2007) while in the election following the treatment (2012) the gap that was observed in 2010 has to be of equal magnitude, in the absence of new updated information. The reason is that, as we claim, the 2010 information shock is unique and its effect on the support for dominant parties (fragmentation) operates via the rent-seeking mechanism in those patronage-intense regions. Therefore, even if an increase (decline) in electoral fragmentation (support for dominant parties) was observed before or after the 2010 elections, it should have no differential effect across regions. This is exactly what we intent to document by estimating a version of the model with leads and lags.
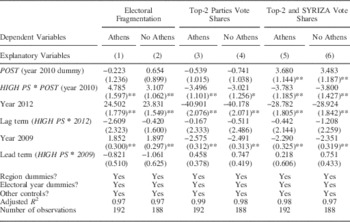
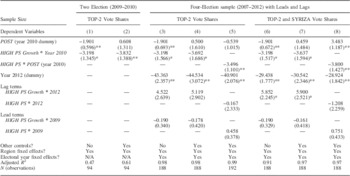
In Table 7 we present our estimates when we employ the expanded four-election sample (which contains additional electoral data from the 2007 and 2012 legislative elections). This allows us to introduce treatment lead (for 2007 and 2009) and lag (for 2012) terms. In practice, it allows us to determine whether such a differential change in the support for dominant parties (or electoral fragmentation) has also occurred in the past. If our identification strategy (information shock) and the link via which it operates are accurate then all the coefficients on the interaction (lead and lag) terms should fail to be different from 0, in a statistically significant way. We find that the effect of the increase (decrease) in fragmentation (support for the two dominant parties) in 2010 is accounted for almost exclusively by the differential increase in the high public sector regions (NUTS-3). Nevertheless, this is not the case for 2012, where the significant decline of more than 30 percentage points (increase of more than 20 percentage points) in the support for the two dominant parties (in fragmentation) that was recorded does not vary differentially across the two groups of regions. Clearly, this further decline (rise) in support for the two dominant parties (fragmentation) observed in the 2012 elections is mainly attributed to the decline in trust. Yet, the effect we document in 2010 is solely due to our information story as the accountability (economic performance) or the protest voting story cannot account for the differential change across regions that we only observe in 2010 (but not in 2012 or 2009). Therefore, while the decline (increase) in support for dominant parties (fragmentation) in 2009 and 2012, by 3 and 40 percentage points, respectively, is statistically significant and can certainly be attributed to more mechanical accountability stories (e.g., voters sanctioning bad economic outcomes or expressing disappointment for both big parties) or even protest voting (e.g., against the ND government that fiddled the books in 2009), this cannot be the case for 2010. On the one hand, protest or accountability voting stories, as evidence in columns 1–4 (Table 7) shows, are not associated with differential changes in the patterns of electoral support for PASOK and ND across the two groups of regions. On the other, in 2010 the increase (decrease) in fragmentation (support for dominant parties) is fully accounted by the differential change across the two groups of regions (note that the coefficient on the term HIGH PS*2010 is always statistically significant even at the 1 percent level under any specification). That is, the differential effect that we document is unique to the 2010 elections. Thus, it can only be explained by the information shock operating via the patronage mechanism as we suggest.
Weighted-Ordinary Least Squares Regressions (Four-Election Sample 2007–2012) on the Differential Impact of the Information with the Inclusion of Treatment Lead and Lag Terms

Note: robust standard errors clustered at the region level (NUTS-3) reported in parentheses. Other controls include the log of regional (at NUTS-3 level) income per capita (in harmonized PPS terms), the regional net migration rate (%), a dummy variable controlling for incumbent re-election and a local elections dummy. Unemployment rates for 2012 were not yet made available by Eurostat at the regional (NUTS-3) level. Electoral Fragmentation is calculated according to the Rae (Reference Rae1968) index. Dominant (TOP-2) parties’ vote shares in columns 3 and 4 are calculated by summing the vote shares of the two parties: PASOK and ND. In Columns 5 and 6 we also add SYRIZA’s vote shares.
*p<0.05, **p<0.01.
An additional explanatory mechanism that also needs to be examined is one that is closely related to that of economic voting. That is, the differential increase in fragmentation in those high public sector regions might simply reflect the discontent of some voters (e.g., civil servants) who are unhappy with economic performance of the government, especially when it comes to their individual finances.Footnote 46 Hence, it is likely that civil servants punish the government (and perhaps both dominant parties) for reducing their benefits or salaries. In such a case, as the number of public employees is larger in those high public sector regions (see Table 1), the effect that we find, even after controlling for changes in per capita income, might still be—at least partially—a result of standard economic voting behavior. In order to address those concerns, and also highlight the indispensable role that our mechanism plays in explaining this effect, we use an alternative method to identify patronage-intense regions: we use the growth rate of public sector employment. In order to identify the patronage-intense regions, instead of using those regions with the highest levels of public sector, we use regions that experienced the fastest growth in public sector employment from 2000 to 2008.
The rationale is as follows. Recall that the fiscal derailment that occurred in 2005–2008 (see Figure A1) was mainly due to a large expansion of public employment, mostly in the form of fixed, short-term, renewable job contracts. As those who got hired in that period represent the more recent clientele of two big parties, there should be the ones that are mostly affected by the prospect of less “pork” in the future (e.g., their fixed-term employment contracts might not be renewed).Footnote 47 Hence, we can identify the regions that will be affected the most by the reduction in clientelistic rents by splitting the sample into two groups along those lines. As our main identifying hypothesis is that fragmentation increased differentially in some regions because “voter-clients” abandoned the big parties in anticipation of fewer rents, we can re-estimate Equation 4 using the regions that experienced the highest growth rate (from 2000 to 2008) in this type of public employment. This way, we can identify with greater precisionFootnote 48 the regions with the most recent beneficiaries of this clientelistic surge and who are more likely to abandon the dominant parties in anticipation that it is less likely that their job contracts will be renewed (less rents). At the same time though, some of those high (public sector) growth regions did not have high levels of public sector employment in 2010 (see Tables 1 and 2). In fact, in 2010 the share of public sector in terms of overall regional employment in those high growth regions was identical to the low ones (21 versus 20 percent), while in terms of overall share of public sector employment, high growth regions account for only the 30 percent (and low growth regions account for the remaining 70 percent). Hence, if simple economic voting was taking place, then the observed effect should be absent or even reversed when we estimate this model. Moreover, this alternative identification strategy further eases any additional concerns over endogeneity.Footnote 49
In Table 8, columns 1–4 present the results of estimating this version of the model (column 5 reproduces the estimates of column 3 in Table 4 to act as a benchmark). A thorough inspection of all the coefficients reveals that the general picture remains virtually unchanged. While the magnitude of the main coefficient of interest HIGH PS*2010 is slightly smaller in absolute terms (support for dominant parties declined by 3.2–3.8 as opposed to 3.5–4.5 percentage points), it is still significant at the 5 percent level and statistically indistinguishable. The same is also true for β 1, which is negative and identical in magnitude (−1.9). Again, the coefficients on all lead and lag terms (columns 3–5) are statistically indistinguishable from 0, implying that the differential change in our dependent variable is uniquely associated with the 2010 elections and information shock operating via our proposed mechanism. If other more mechanical stories (e.g., accountability, trust, protest or economic voting) were taking place, we should have observed a gap appearing in 2009 (accountability story) and further widening in 2012 (due to economic voting or trust).
Weighted-Ordinary Least Squares Regressions on the Effect of the Information Shock on Regions that Experienced the Fastest Growth Rate of Public Sector Employment in 2000–2008

Note: robust standard errors clustered at the region level (NUTS-3) reported in parentheses. Other controls include income per capita (in harmonized PPS terms) at the regional (NUTS-3) level, regional net migration rate (in %), a dummy variable controlling for incumbent re-election and a local elections dummy. Regional unemployment rate data for 2012 are not yet available by Eurostat. Weights are calculated based on the number of registered voters who turned up in 2010. Dominant (TOP-2) parties’ vote shares in columns 1 and 3–5 are calculated by summing the vote shares of the two parties: PASOK and ND. In columns 6 and 7 we also add SYRIZA’s vote shares. Columns 5 and 7 are identical with columns 3 and 6 in Table 4 (i.e., the treatment group is regions (NUTS-3) with high level of public sector employment). Athens metropolitan region is excluded from all specifications.
*p<0.05, **p<0.01.
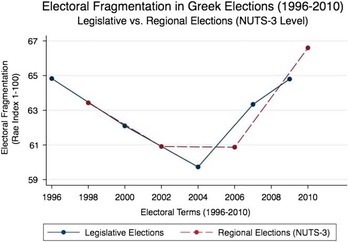
Finally, one might be concerned on how relevant is to compare legislative (2007, 2009 and 2012) with regional elections (2010). Despite the fact that evidence shows that electoral fragmentation in regional elections follows an identical pattern with legislative ones (see Figures A7 and A8) and, in fact, regional elections are a good proxy for mid-term elections, we still need to present our argument in greater detail. First, let us clarify that we do not need such a strong assumption to hold (that regional elections are a proxy to legislative ones) for our identification to be valid. Rather, we need something weaker: it suffices that electoral behavior between regional and legislative elections does not vary across these two groups of regions (high and low public sector).Footnote 50 As our main identifying hypothesis is that our mechanism caused a differential change in electoral fragmentation across high and low public sector regions, it suffices to show that such a differential change is not driven by the fact that the 2010 elections were regional ones. Clearly, this is true as evidence presented before shows (see, e.g., Figures A7, A8 and A9). Moreover, as the results of our placebo regressions indicate (Table 6, columns 1–4) when we move treatment into the 2006 regional elections, the parallel trends assumptions is satisfied. While issues such as rebel or independent candidates, joint-support candidacies, local issues dominating the agenda or the candidate’s constituency of origin were always prevalent in local elections and (to a certain degree) important determinants of voting behavior, they did not seem to vary differentially across high and low public sector regions. That is, we do not observe this gap being an outcome of the regional nature of the electoral competition. Otherwise, this pattern should have also been observed during past regional electoral contests (e.g., in 2006 regional elections). Yet, we find no such evidence (see Table 6).
Nevertheless, in addition to the evidence presented above and the steps we thoroughly presented in Constraining the Political Machines: The Case of Greece section (e.g., concerning rebel candidates), we present some additional evidence in support of our claim here. First, if one observes the political discourse and the issues raised during the 2010 regional elections it becomes evident that the whole campaign was dominated by issues of the national (e.g., the bail-out agreement) rather than the local agenda. Second, the 2010 elections were the first regional elections that took place at the periphery (NUTS-2) level. This implied that the vote had a more national than local flavor compared with previous local elections. As a testament to this, the number of non-affiliated or joint-party candidacies was one of the smallest in the history of local elections.Footnote 51 Finally, in addition to all the above, in order to control for the variability in the party-support patterns for each candidate, we estimate a modified version of our econometric model in Equation 4 where we control for two additional characteristics: whether a candidate enjoyed the joint support from more than one party and also the NUTS-3 (Nomarchia) constituency where a politician used to be politically active in the past (what we call constituency of origin) before standing as a candidate at the Peripheral elections.
In Table 9, we present those estimates. Consistent with our story, and after controlling for any joint-candidacy and constituency origin effects, our results show that both dominant parties suffered a differential decline in their vote shares in those high public sector regions of ~4–6 percentage points (the coefficients on HIGH PS*2010 are negative, ranging from −4 to −5.4 for PASOK and from −4.2 to −7.5 for ND, respectively). Moreover, while the main opposition party of ND seems not to be losing any (or in fact even winning some) votes overall, in those high public sector regions its decline in electoral support is identical with that of PASOK. This might be a surprising finding if one tries to interpret solely based on accountability (trust) or economic voting stories but is very consistent with our mechanism. Rent-seeking voters are abandoning both dominant parties as they anticipate that less “pork” is available for them. Hence, the differential effect that we document is not due to an accountability or economic voting mechanism, rather it exists despite their (potential) presence.
Weighted-Ordinary Least Squares Regressions on the Effect of the Information Shock on the Electoral Performance of the Two Dominant Parties (PASOK and ND) in 2010 Elections

Note: robust standard errors clustered at the region (NUTS-3) level reported in parentheses. In all specifications we include a dummy variable indicating whether the PASOK (or ND) candidate was jointly supported in the 2010 regional elections by another minor party (there were no joint PASOK–ND tickets in the 2010 regional elections) and a dummy variable indicating whether or not the PASOK (or ND) supported candidate in the election for the wider periphery (NUTS-2) used to be politically active in (or originated from) this specific NUTS-3 constituency in the past. Additional controls include regional unemployment rate (in %), regional income per capita (in harmonized PPS terms), regional net migration rate, a dummy variable controlling for incumbent re-election and a local elections dummy.
*p<0.1, **p<0.05, ***p<0.01.
The Rise of a New Dominant Party?
On a final note, there is an additional structural element that sounds a note of caution for our identification strategy and needs to be addressed. As the May 2012 electoral results reveal, perhaps what we witnessed in 2010 was just the beginning of the “new” Greek party-system and the rise of a new dominant party, SYRIZA.Footnote 52 As a result, one might assume that the decline in vote shares of the two dominant parties in 2010 was just the prelude of this effect. This would have been problematic for our identification strategy. As our goal is to establish that the increase in fragmentation in 2010 was due to rent-seeking voters abandoning the dominant parties (that had access to “pork”) for smaller ones (that did not have), we want as few structural parameters as possible varying in the period prior from May 2010 to the November elections. And while our claim is that this rent-seeking mechanism is an important determinant of voting behavior in 2010, we do not want to go as far as arguing that our findings document the collapse of the “old party-system.” If a “new party-system” emerged in 2010 then it would have been difficult to identify which are the dominant parties in a party-system under transition. That is, how can we identify whether rent-seeking voters did in fact abandon the dominant parties or whether they simply switched to a new emerging dominant party?
In order to check this claim, we treat SYRIZA as a dominant party not only in the 2012 but also in the 2010 elections and we re-estimate our model in Equation 4 by using a new dependent variable: TOP-2 plus SYRIZA vote shares. We present those estimates in Table 7 (columns 5 and 6) and Table 8 (columns 6–8). We find no evidence supporting the claim that the effect in 2010 is driven by the emergence of SYRIZA as a dominant party. If that was the case, then after adding the vote shares of SYRIZA the coefficient on the interaction term HIGH PS*2010 should have been statistically indistinguishable from 0. Instead, what we observe is that the results that we obtain in columns 5 and 6 (Table 7) are almost identical in magnitude with columns 3 and 4 (a minor change from −3.5 to −3.8). Similarly, in line with our previous results, all the other lead and lag terms (and especially the interaction term HIGHP PS*2012) are not statistically different from 0 (compare column 4 with 6), which implies that this alternative story cannot explain neither the overall change nor the differential increase of fragmentation in high public sector regions.Footnote 53 In fact, it is clear that while support for dominant parties collapsed in 2012 (even if one includes SYRIZA’s vote shares in the analysis the magnitude is about 26 percentage points) the difference between high and low public sector regions that was observed in 2010 (and which, by conservative estimates, is ~4 percentage points) is maintained almost intact in 2012 (see also Figure A9).
Additional Competing Mechanisms: A Final Note
In the previous section of the paper, we have already addressed some of the most pressing threats to the validity of our identification strategy. We have also examined three alternative mechanisms (accountability, economic and protest voting) that could potentially explain our finding of a differential decrease in the support for dominant parties in patronage-intense regions. Yet, by presenting a series of arguments, robustness checks and modifications in our econometric model, we have ruled them out as possible explanations to our findings.Footnote 54 Moreover, declining trust cannot account for the differential change across regions, as trust moves in parallel over the whole period under consideration (see Figure A6).Footnote 55 In addition to these concerns, we have also addressed some other more “mechanical” stories that could run against our main mechanism (rent seeking). Finally, as a robustness check, we have also utilized an alternative identification strategy (growth rate of public sector employment in 2000–2008 instead of levels) in order to strengthen our mechanism.
Nevertheless, there are some additional competing mechanisms that we would like to address in this section. One such alternative story is related with decreased turnout in the 2010 elections, which appears to have dropped more in what we have categorized as high public sector regions. Then, this implies that the increase in fragmentation (decrease in dominant parties vote shares) might not be an outcome of rent-seeking voters abandoning those parties in expectation of less spending and rents, rather it can be the case that some of their past voters, frustrated and angered with those parties systematically lying about the true status of the economy, decided to abstain from the polls. In such a case the increase in fragmentation and the decline in the vote shares of those parties might be an outcome of this alienation and discontent story. Fortunately, we can account for this by using weights in our regressions that depend not on the number of registered voters but on the number of actual voters who turned up in the polls in 2010. As a result of our choice of weights, regions that experienced relatively lower turnout (and especially the high public sector ones) are significantly under-weighted in the sample. Therefore, plausible as it may be, this story cannot drive our empirical results.
There is a final set of competing stories that we need to consider before concluding the discussion. Suppose for instance that regions with a large public sector had voted for the ND party in higher numbers in the past and thus abandoned it in higher numbers too, once they realized that it had deliberately misreported the fiscal data. So, some of them might have abandoned it in 2009 while most of them did so in 2010. This explanation would also produce the observed effect of increased fragmentation (reduced support for dominant parties). Nevertheless, as evidence shows this is not the case as support for the ND party was not particularly higher in those regions. In fact, support for ND in high public sector regions was standing on average (2009–2010) at 36 percent, as opposed to 38 percent in the remaining regions. Hence, the above story does not seem very plausible. Perhaps, an alternative story is that such regions benefited from the fiscal cheating by the ND government disproportionately and do not want to abandon them that easily, which would go against the observed effect. While this might sound plausible, evidence do not seem to support this claim either, as electoral support for ND in those regions reached an all-time low of 35 percent in 2010 (until of course the 2012 elections). Moreover, the regions that benefited the most from cheating are not those ones with the highest level of public sector employment but those with the highest growth rate over that period. In fact, this is exactly what we control for in the estimates presented in Table 8.
Discussion and Concluding Remarks
Our findings go beyond the point of simply reversing the causal link between electoral fragmentation and government spending. By pinpointing the mechanism (patronage and political clientelism) that is responsible for this differential change in those patronage-intense regions, our study uncovers the critical role that machine politics and rent seeking play in determining electoral outcomes. Thus, our work helps us to better understand some recent findings about Greece’s exceptional case of economic hysteresis with respect to other EU member states (see, e.g., Campos, Coricelli and Moretti Reference Campos, Coricelli and Moretti2014). Our findings clearly point to a political economy explanation of this phenomenon: the important role of transparency and inclusive (non-clientelistic) political institutions in achieving better economic and political outcomes. The political and economic significance of our results lies in the above statement. By quantifying the impact of our mechanism we were able to show the relative importance of clientelism and patronage in Greek politics. According to our estimates, the electoral effects of rent seeking and machine politics are instrumental. We have found that one in six voters that has abandoned the two big parties in 2010 did so for purely opportunistic reasons as a result of anticipating less “pork.” Of course, this is not to say that all other possible mechanisms (such as protest voting, performance voting, accountability, polarization, trust, etc.) that affect voters’ behavior in the Greek context are not relevant determinants of electoral support. Rather, what we find and document is that an important part of the electorate (even though not the majority) is actually driven by the distribution of “pork.” This fraction of voters is large enough in order to play a pivotal role in an electoral contest and thus it can be instrumental in determining the outcome of an electoral process.
Moreover, while the collapse of the old status quo in Greece in 2012 was clearly an outcome caused by more than one parameter, by focusing on the 2010 elections, we have managed to disentangle the electoral effect of the two main mechanisms (patronage/rent seeking and trust/accountability). Thus, we were able to show that the weakening of the once powerful clientelistic linkages was an important factor that contributed, together with other factors, in the gradual collapse of the old two-party-system, a process which started in 2010 and was completed in the 2012 elections. Additional channels, then, had an additive impact on the extreme fragmentation of the party-system that was recorded in May 2012, which was also marked by the rise of many extremist parties. But, this does not diminish the role that our documented mechanism has played.
Furthermore, by disentangling the two main mechanisms through which the financial crisis impacted upon electoral outcomes we can shed some light on the determinants of the success of those radical parties. In that respect our findings suggest that, in addition to those “traditional” channels (e.g., trust and voter disaffection, accountability and performance voting) that are responsible for the observed rise in the electoral support of more extremist (leftist or rightist) parties, there might also be a significant institutional aspect to this political phenomenon. Hence, the consequences of more fragmentation can potentially have more long-lasting effects, which might persist even when the financial crisis is over. Thus, in light of the recent rise of populists and radical parties all over Europe, our results can provide an insight for some of the reasons behind their emergence, success and electoral consolidation. Yet, this current study does not aspire to have such a broad scope and on that note, we defer those important questions for future research.
Finally, our findings yield more support to the link between controls on governments and the dispersion of electoral and political power among parties (Acemoglu and Robinson Reference Acemoglu and Robinson2012). Clearly, the financial crisis in 2010 placed an exogenous constraint on machine politics and the ability of dominant parties to distribute more pork-barrel spending. This, in turn, undermined the position and the political power that the “old” dominant parties enjoyed. Hence, our work highlights the importance of constraints (fiscal or institutional) in limiting the prevalence of machine politics and in reshaping the structure of the party-system.
Supplementary Material
To view supplementary material for this article, please visit http://dx.doi.org/10.1017/psrm.2015.50
Appendix
(a) The evolution of electoral fragmentation (Rae index) across high and low public sector regions (NUTS-3) in Greek elections (1996–2010). (b) Electoral support (% of votes) for dominant parties (PASOK and ND) across high and low public sector regions (NUTS-3) in recent Greek elections (2006–2010) Source: Ministry of Interior and own calculations.

The evolution of Greek government spending and revenues (as % of GDP) from 1996 to 2012 Source: Eurostat and HELLStat.

The information shock on Greek deficit (2005–2008): actual versus reported data Source: Eurostat and HELLStat. Note: reported values include estimated two-year projections.

The evolution (May 2008–May 2013) in the spread on the yield of the Greek (green) against the German (black) ten-year government bond Source: Bloomberg.

The increase in the degree of electoral fragmentation—height—as a function of (a) the pre-cuts size of public sector transfers—length—and (b) the size of the cuts—width

(a) Evolution of trust toward the government in Greece. Quarterly data from Q.2 (2009) to Q.1 (2012). (b) Evolution of trust toward the political parties in Greece. Quarterly data from Q.2 (2009) to Q.1 (2012) Source: Eurobarometer surveys. Note: statistics for NUT-3 regions are nor reported due to insufficient sample size (<50 respondents).

(a) The parallel trend of electoral fragmentation between legislative and regional elections in high public sector regions (NUTS-3) from 1996 to 2010. (b) The parallel trend of electoral fragmentation between legislative and regional elections in low public sector regions (NUTS-3) from 1996 to 2010 Source: Ministry of Interior and own calculations.

Comparison of the trend of electoral fragmentation between legislative and regional elections in Greece from 1996 to 2010 Source: Ministry of Interior and own calculations.

(a) Electoral support (% of votes) for dominant parties (PASOK and ND) across high and low public sector regions (NUTS-3) in Greek elections (2006–2012). (b) Electoral fragmentation (Rae index) in Greek elections (1996–2012) across high and low public sector regions (NUTS-3) Source: Ministry of Interior and own calculations.

Weighted-Ordinary Least Squares Regressions on the Differential Impact of the Information Shock at the Nuts-2 Level (Six Election Sample 2002–2010) with the Inclusion of Treatment Lead and Lag Terms