
I. INTRODUCTION
Graphene is a single-atom-thick two-dimensional (2D) honeycomb carbon nanomaterial with a hexagonal lattice. Its sp 2-bonded carbon gives it exceptional properties. It possesses strong structural and mechanical properties,Reference Lee, Wei, Kysar and Hone1 high thermal conductivity,Reference Zhao, Kim, Chen, Einarsson, Wang, Song, Wang, Chiashi, Xiang and Maruyama2 and very high electron mobility,Reference Mayorov, Gorbachev, Morozov, Britnell, Jalil, Ponomarenko, Blake, Novoselov, Watanabe, Taniguchi and Geim3 which make it useful for numerous applications. Presently, chemical vapor deposition (CVD) has the greatest promise among graphene fabrication methods for the large-scale production of high-quality large-area graphene. Other methods using exfoliation are limited in the size they can produce, while sublimation from carbides is very resource intensive.
CVD goes back to the 1950s, when it was first introduced by Union Carbide for the synthetic production of diamond.Reference Eversole4 Although interest in CVD synthesis of diamonds has waned in recent years, interest in CVD has increased for the production of other materials, such as silicon deposition for use in electronics. Despite its high energy cost, CVD remains the dominant technology for industrial scale production as opposed to other recently developed methods. CVD remains attractive for the deposition process, as its processing parameters can be precisely controlled and easily observed.Reference Miao, Zheng, Liang, Xie and Mikhailov5,Reference Azam, Zulkapli, Dorah, Raja Seman, Ani, Sirat, Ismail, Fauzi, Mohamed and Majlis6 However, as a result, CVD becomes a complex method that requires precise control of synthesis parameters, such as the pressure,Reference Wang, Hibino, Suzuki and Yamamoto7–Reference Yang, Sasaki, Suzuki and Miura9 temperature,Reference Weatherup, Dlubak and Hofmann10–Reference Yamazaki, Wada, Kitamura, Katagiri, Sakuma, Saito, Isobayashi, Suzuki, Sakata, Kajita and Sakai12 type of hydrocarbon gas,Reference Cushing, Johánek, Navin and Harrison13 deposition time, and gas mixture ratio. During the deposition process, every controlled variable is important, as they affect the graphene growth rate and its quality. Additionally, graphene grown on various metal substrates, such as nickel (Ni),Reference Lu, Jin, Lin, Huang, Suenaga and Chiu14–Reference Kozlova, Niilisk, Alles and Sammelselg18 palladium (Pd),Reference An, Liu, Jung and Kar19 iridium (Ir),Reference Dangwal Pandey, Krausert, Franz, Grånäs, Shayduk, Müller, Keller, Noei, Vonk and Stierle20 platinum (Pt),Reference Ping and Fuhrer21–Reference Nam, Kim, Yun, Shin, Nam, Lee, Hwang, Lee, Weman and Kim23 and copper (Cu),Reference Choi, Choi, Kim, Jeong, Yu, Kim, Kim, Shin, Cho and Choi24–Reference Frank, Vejpravova, Holy, Kavan and Kalbac52 have been reported with varying results. Generally, most reports have used Cu or Ni substrates with hot-walled CVD either at atmospheric or low pressures. In addition, modifications of the CVD reactor, such as plasma enhanced CVDReference Jacob, Rawat, Ouyang, Bazaka, Kumar, Taguchi, Iwamoto, Neupane and Varghese53,Reference Braeuninger-Weimer, Brennan, Pollard and Hofmann54 or flame deposition CVD,Reference Ismail, Sirat, Hamid, Othman, Abid and Ani55,Reference Memon, Tse, Al-sharab, Yamaguchi, Goncalves, Kear, Jaluria and Andrei56 have also been reported for graphene production.
Optimization of these parameters is the initial stage for mass producing graphene. At this stage, the reaction kinetics of graphene deposition will be established. This will then be followed by the next stage in which the fluid dynamic parameters are studied, which will provide valuable information for developing and scaling up an optimized reactor. A thoroughly optimized reactor will be able to efficiently produce a homogenous deposit, vital for the synthesis of high-quality large-area graphene. Presently, there is still not much attention given to the study of fluid dynamics parameters to explain the influence of the gas flow behavior during graphene deposition, especially when a mixture of different types of gases is involved. Here, this review attempts to answer a few basic questions:
(i) What is the gas mixture flow regime in a conventional CVD graphene reactor?
(ii) How will the gas composition affect the fluid properties?
(iii) How does gas flow behavior relate to the quality of the graphene?
(iv) What is the optimal gas composition for high-quality graphene growth?
By addressing these 4 questions, we intend to correlate gas dynamics to the resulting graphene quality. We start by outlining the basic principles of fluid dynamics in CVD and then the characterization methods used. Then, the literature data for CVD graphene are compiled and analyzed. In our case, we consider conventional CVD with a horizontal hot-walled tubular reactor. We further limit the scope by focusing on atmospheric pressure (AP) CVD (APCVD) using Cu as the substrate and methane (CH4), argon (Ar), and hydrogen (H2) as the only gases used. This paper will serve as a reference point for CVD graphene researchers to become more aware of the importance of fluid dynamics in CVD deposition.
II. FLUID DYNAMICS IN CVD
We start this segment with the development of silicon deposition by CVD as an example. The microelectronics industry has made significant progress due to the development of CVD, which allows the easy deposition of semiconductor thin films. It is beneficial to consider how industrial-scale CVD reactors were developed as a guideline for the similar development of industrial-scale CVD graphene. While CVD was not developed with thin-film deposition in mind, it has found wide use in the microelectronics industry due to a breakthrough in depositing metal thin films though the application of metal–organic ligands, which allows materials once thought to be nonvolatile to be easily turned into volatile species. Once the reaction mechanism was well understood with a suitable kinetic model, research and development (R&D) moved on to scaling up the CVD reactor for the mass production of semiconductor thin films.
At this point, the focus for R&D shifted to designing a system that would perform the efficient and controlled deposition of high-quality deposits. A vital step in achieving this is having a thorough understanding of the fluid dynamic properties during the deposition process. Mass transfer, heat transfer, and fluid flow need to be properly understood to obtain uniform deposition across the substrate. Currently, there is software that performs computational fluid dynamics (CFD), giving detailed insight into the fluid flow. This makes the design of a deposition reactor easier since the geometries that give the most homogenous gas flow throughout the whole substrate can be found by simulation. There are already various reports on the optimization of CVD for diamond, silicon,Reference Coltrin, Kee and Miller57–Reference Cavallotti and Masi60 carbon nanotubes,Reference Musso, Porro, Rovere, Giorcelli and Tagliaferro61 and nanoparticles.Reference Reuge, Bacsa, Serp and Caussat62
Comparing the state of R&D for graphene production, it is still at the stage of understanding the reaction mechanisms, as there is still no consensus on the role of hydrogen gas during deposition. However, increased demand for graphene, especially large-area high-quality monolayer graphene, creates a need for a CVD process capable of mass production. The following sections will provide a practical guide to the basics of fluid dynamics in CVD and reveal the best conditions suited for the optimal growth of graphene through fluid dynamics analysis.
A CVD process for graphene deposition involves reactions in the gas phase and subsequently on the substrate surface. While the deposition reaction does not have a direct relation to fluid dynamics, the surface adsorption of the reactants is dependent upon diffusion. Slow enough diffusion could change the rate-limiting step from surface kinetics to mass transport kinetics. Changes in the graphene deposition mechanism in low pressure (LP) CVD (LPCVD) and APCVD have been reported and will be elaborated later.Reference Li, Huang and Li63 While heterogeneous reactions occurring on the substrate are not significantly influenced by fluid dynamics, apart from diffusion and surface adsorption, reactions occurring in the gas phase are greatly influenced by the fluid dynamics. A myriad of factors originating from the gas properties and the reactor design will control the mixing and reaction rates. This ultimately controls the reaction kinetics and the transport phenomena.
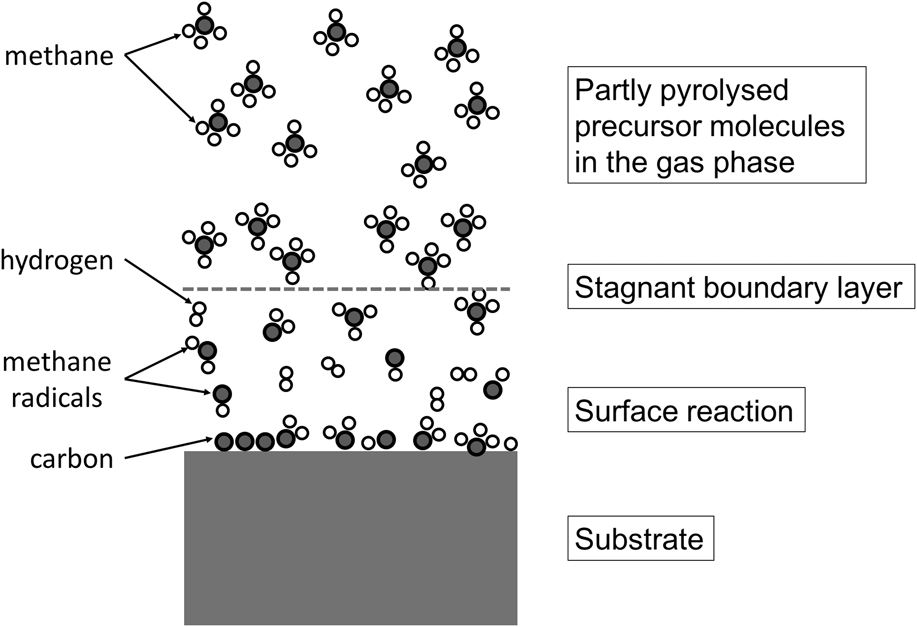
Of a particular interest is the fluid dynamics for a high-temperature APCVD reaction. OhringReference Ohring64 noted that a high-quality epitaxial thin film could be achieved by using high-temperature APCVD and that it is favorable for large-area deposition. Increasing the temperature and pressure from low to ambient pressure will increase the importance of the gas-phase reactions. Consequently, in this state, the roles of the gas properties become major influencing factors during the deposition. This will be explained using Fig. 1, which illustrates the phenomena involved in a deposition process in APCVD at high temperature. Gas entering the reactor is heated and undergoes pyrolysis producing activated carbon species. The gas velocity and temperature will determine the amount of pyrolysis. Next, as the pyrolyzed species diffuses toward the substrate, a boundary layer forms at the interface of the solid substrate and the gas-phase reactant. This layer is the depletion of reactants, which occurs as the pyrolyzed species is adsorbed and fresh reactants diffuse into it from the bulk gas phase. Depending on the substrate, the adsorbed species will then undergo dehydrogenation followed by diffusion onto the bulk metal or immediately recombines reaction to form graphene. Similarly, by-products from the surface, such as H2, gas will also diffuse through the boundary layer. In CVD, this boundary layer plays a significant role in the deposition mechanismReference Ritala, Niinisto, Krumdieck, Chalker, Aspinall, Pemble, Gladfelter, Leese, Fischer, Parala, Kanjolia, Dupuis, Alexandrov, Irvine, Palgrave, Parkin, Jones, Hitchman, Jones and Hitchman65 and is subject to the influence of various processing parameters, especially gas viscosity.
Simple schematic representation of the graphene CVD mechanism. Adapted from Ref. Reference Ritala, Niinisto, Krumdieck, Chalker, Aspinall, Pemble, Gladfelter, Leese, Fischer, Parala, Kanjolia, Dupuis, Alexandrov, Irvine, Palgrave, Parkin, Jones, Hitchman, Jones and Hitchman65 by permission of The Royal Society of Chemistry.

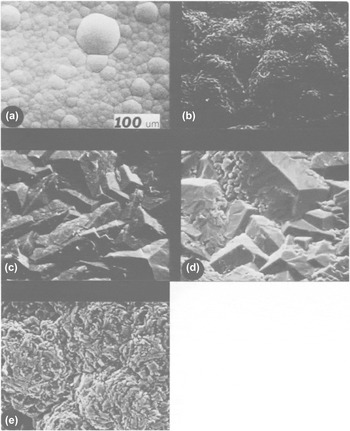
In fact, there are instances where fluid dynamics actually has an even larger effect than the chemical kinetics. An example can be found in Dirkx and Spear’s “Emergent Process Methods for High-technology Ceramics”,Reference Dirkx, Spear, Davis, Palmour and Porter66 which reports that during the deposition of silicon boride (SiB4) from boron tetrachloride and silane, changing the carrier gas from H2 to Ar leads to a significant change in the SiB4 morphology, as shown in Fig. 2. However, when helium (He) was used instead of Ar, no significant change was observed. While He and Ar are both inert gases, the difference between Ar and He is that He has similar thermal and flow properties to H2 gas. Therefore, they concluded that it is not the chemical properties of the H2 that influenced the morphology but rather the flow behavior and the thermal properties. Applying this fact to the CVD synthesis of graphene, there is a high possibility of gaining improvements in deposition quality if Ar carrier gas and, to a certain extent, H2 gas is changed to a gas with suitable gas dynamics. Unlike the morphology study of SiB4 deposition here, the effect of diluent/carrier gas types in terms of fluid dynamic properties on graphene deposition is still not well understood.
Variation of deposition morphology with carrier gas composition: (a) 1000 sccm H2, 0 sccm Ar; (b) 800 sccm H2, 200 sccm Ar; (c) 500 sccm H2, 500 sccm Ar; (d) 200 sccm H2, 800 sccm Ar; and (e) 0 sccm H2, 1000 sccm Ar. Reproduced from Ref. Reference Dirkx, Spear, Davis, Palmour and Porter66 by permission of Springer.

The previous paragraph highlights how gas properties can change the deposition morphology of a deposit. Another aspect that can be controlled is the reactor design. Every study uses CVD reactors with a certain unique geometry, which leads to different gas flow dynamics. For example, the furnace length, diameter, sample position, and angle, or any other additional modification that physically changes the reactor shape, will affect the fluid dynamics inside the reactor, such as the gas flow velocity, gas flow regime, residence time, gas temperature distribution, and gas flow pattern. It is clear that there are many parameters that need to be optimized to ensure a fluid dynamic state that leads to a high growth rate with uniform deposition.
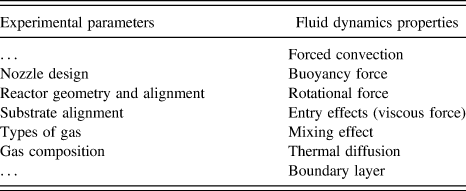
Aside from the gas-phase reactions, there are three main factors that govern the performance of any CVD reactor: the fluid flow, heat transport, and mass transport (as tabulated in Table I). These are the three factors that should be thoroughly optimized to achieve an efficient and homogeneous reaction across the whole substrate. At the same time, the deposition process needs to be precisely controlled to give the desired thickness and composition. It is beneficial to consider these governing factors in terms of dimensionless numbers.Reference Holstein67
Experimental parameters that influence the fluid dynamics properties of the CVD reactor.

Understanding the effects of these parameters experimentally presents many challenges. Therefore, it is more convenient to do simulations and empirical calculations to understand the deposition phenomena within a certain system. Empirical research will help to validate the assumptions of the simulation process. All of these will help to achieve the main goal of developing a favorable CVD geometry, producing an economically viable process for graphene.
A. Dimensionless numbers related to the conventional CVD process
In fluid dynamics, dimensionless numbers are important in determining the behavior of the flowing gas. Important descriptors used in fluid dynamics are the Knudsen number (Kn), Reynolds number (Re), Grashof number (Gr), Prandtl number (Pa), Peclet number (Pe), Damköhler number (Da), and Rayleigh number (Ra).Reference Kuczmarski68,Reference Thiart, Hlavacek and Viljoen69 These numbers are typically expressed in terms of diffusivity, viscosity, thermal conductivity, heat capacity, and density,Reference Cengel and Cimbala70 as shown in Table II, with their interpretations and typical values in LPCVD and APCVD. Although a complete computational model can provide comprehensive information about the system, dimensionless numbers analyzed from the experimental data provide additional quantifiable data about how variations in the gas flow pattern affect the growth quality. Two major assumptions are required to validate these fluid dynamics analyses: the fluid needs to be continuous and laminar. Among these numbers, the Knudsen number and Reynolds number are the two most relevant dimensionless numbers for the fluid mechanics of CVD as it will validate the gas flow assumptions used for CFD. Using the Knudsen number, a continuum or noncontinuum flow can be identified.Reference Ritala, Niinisto, Krumdieck, Chalker, Aspinall, Pemble, Gladfelter, Leese, Fischer, Parala, Kanjolia, Dupuis, Alexandrov, Irvine, Palgrave, Parkin, Jones, Hitchman, Jones and Hitchman65 A laminar flow or turbulent flow can be verified from the Reynolds number. Other dimensionless parameters provide additional details about the gas mechanisms that occur in both multicomponent and homogeneous systems during the deposition process. For example, the Damköhler number represents the chemical reaction rates among the gas species and determines when the system achieves thermodynamic equilibrium. The Peclet number determines whether the transport process is dominated by convection or diffusion, while a large Grashof number favors natural convection.Reference Ohring64,Reference Kuczmarski68
Established dimensionless numbers in fluid dynamics applicable for a CVD reactor with the definition, field of use, and typical values obtained for LPCVD and APCVD.

ρ is the fluid density, V is the characteristic velocity, D is the characteristic diameter, μ is the fluid viscosity, λ is the mean free path length, g is the gravitational acceleration, β is a coefficient of thermal expansion, ΔT is the characteristic temperature difference, c p is the specific heat capacity, k is the thermal conductivity, and W is the chemical reaction rate.
Overall, the two essential parameters, temperature and pressure, govern the whole deposition process. The pressure in the reactor affects the diffusivity, viscosity, and density of the gas species. In 1980, BloemReference Bloem71 noted that the pressure in CVD mainly determines the hydrodynamics of the gas flow and rate of reactant diffusion.Reference Bloem71 At lower pressures, surface kinetics predominates, but reactions done at ambient pressure have rate-limiting mass transport. APCVD processes limited by mass transport are influenced by the boundary layer that forms on the solid–gas-phase interface. Within this region, gas diffusivity plays a major role in the resulting deposit quality. This has been proven theoretically and, later, experimentally as well.Reference Manke72,Reference Ban73 At AP, the temperature and diffusion boundary layers cause depletion of the reactants and inhomogeneity in the deposition rate. However, with a well-developed system, this depletion problem can be counteracted, making it very efficient in terms of reactant usage.
Therefore, it can be seen how pressure plays a big role in the dynamics of gas flow. CVD reactions are diffusion limited when at AP and the surface reaction limited when at lower pressure. This difference could be explained by the Knudsen numberReference Jensen, Einset and Fotiadis59 which describes whether the flow is continuum or noncontinuum. As shown in Table II, Knudsen number is defined by the gas mean free path divided by the length of the reactor. At APs, there are many gas molecules which constantly collide with each other rather than the reactor wall. Here, the molecules’ path is very short due to the collisions giving rise to a very small Knudsen number. When Kn < 0.01, the gas could be treated as a single homogenous bulk as it is continuous, allowing it to be considered using continuum mechanics which is the model for conventional fluid dynamics.Reference Ritala, Niinisto, Krumdieck, Chalker, Aspinall, Pemble, Gladfelter, Leese, Fischer, Parala, Kanjolia, Dupuis, Alexandrov, Irvine, Palgrave, Parkin, Jones, Hitchman, Jones and Hitchman65 On the other hand, at very low pressures, there are fewer molecules allowing molecules a much longer travel path before collision. Such conditions have a very large Knudsen number where molecules are more likely to collide with the reactor wall rather than with another molecule. When Kn > 10, there are too little gas molecules for it to be considered as flow of a single homogenous bulk.Reference Ritala, Niinisto, Krumdieck, Chalker, Aspinall, Pemble, Gladfelter, Leese, Fischer, Parala, Kanjolia, Dupuis, Alexandrov, Irvine, Palgrave, Parkin, Jones, Hitchman, Jones and Hitchman65 This condition requires a different model which is statistical mechanics used by the rarefied gas flow theory. In the case of a CVD reaction, gas flow remains in a continuous state at pressures above P > 0.0001 atm and performing reactions lower than this pressure creates a noncontinuous gas flow. At the present moment, understanding of fluid dynamic studies is limited to continuum approach only where most studies using computer modeling use a continuum approximation and a viscous gas model. When considering an ultrahigh vacuum chamber, these two assumptions are no longer valid.
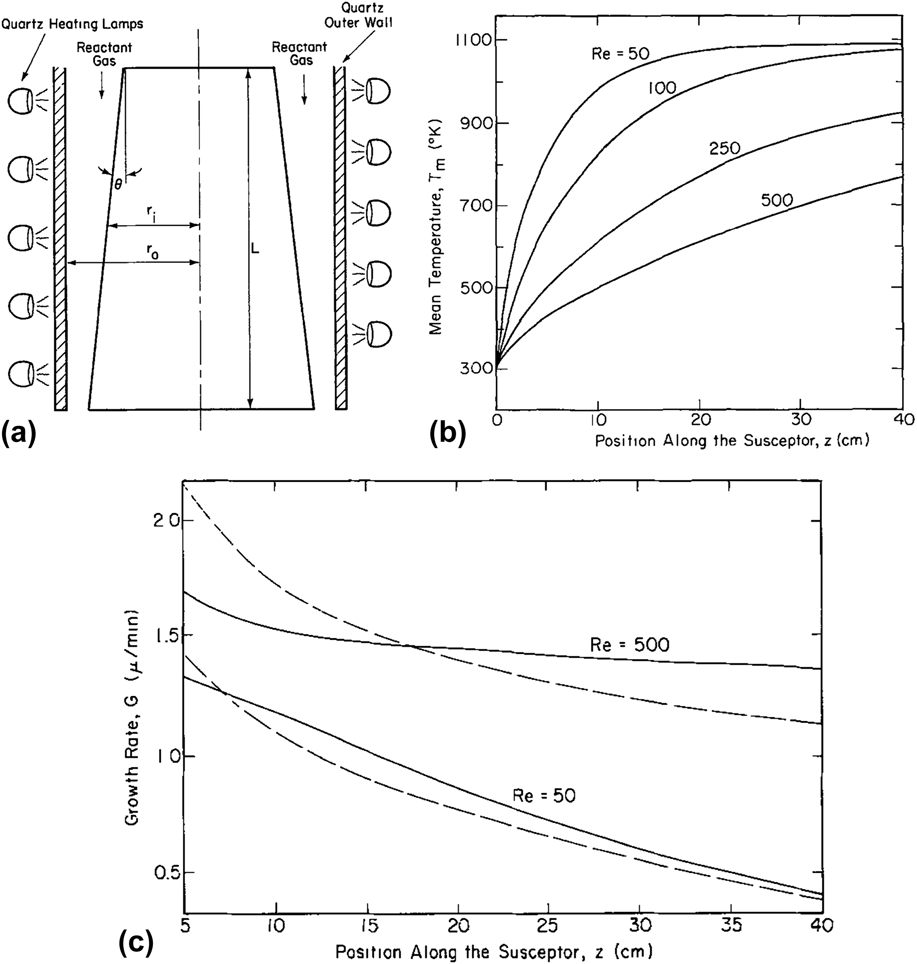
Subsequently, the Reynolds number is an empirical approach to describe the gas flow characteristics in conventional CVD. Many studies discuss the importance of calculating the Reynolds number in conventional CVD to determine the gas flow regime in CVD at any temperature. A few authors have stated in their books that the Reynolds number in a conventional CVD is in the range of 0–100, which suggests laminar flow.Reference Jensen, Einset and Fotiadis59,Reference Asafa, Tabet and Said74 They reported that, for temperatures up to 1273 K, the Reynolds number in CVD is always below a few hundred, and the flow is laminar for each gas, regardless of the different compositions of the gas mixture. Most CVD studies assume that the flow is laminar, but there is no solid computational evidence to back up all these claims. Further calculations of the Reynolds number in CVD that consider the composition of each individual gas in the gas mixture will be discussed in detail in Sec. II.B. Focusing on atmospheric conditions, Manke in 1977Reference Manke72 considered how the Reynolds number influences deposition in the case of a vertical tube reactor with a conical graphite susceptor as the substrate, placed as shown in Fig. 3(a). For an AP reactor, they first noted that at a higher Reynolds number, the temperature gradient decreases, meaning that the gases are not sufficiently heated, as can be seen in Fig. 3(b). This temperature variation affects the growth rate of the substrate. They then provided two types of models, which show how the growth rates differ along the furnace for different Reynolds numbers, as shown in Fig. 3(c). At higher Reynolds numbers, a reduced temperature gradient prevents the gas temperature from reaching the desired reaction temperature, ultimately yielding a reduced deposition rate.
(a) Vertical cylinder reactor, (b) variation of the gas temperature with position along the susceptor, and (c) comparison of the growth rate variation predicted by the constant temperature modes (dashed lines) and developing temperature modes (solid lines). Reproduced from Ref. Reference Manke72 by permission of Electrochemical Society.

Several authors have tried to understand the heat convection in CVD during the deposition process using the Grashof number. GilingReference Giling76 concluded that it does not reflect the nature of gas flow in his horizontal radio-frequency induction-heated furnace. However, Chen et al., in Crystal Growth Technology,Reference Chen, Prasad, Zhang, Dudley, Byrappa, Ohachi, Michaeli, Warlimont and Weber75 described the importance of the Grashof number for buoyancy and advection coming from sublimated species within a vertical tube furnace. It was noted that for a furnace with diameters less than 100 mm, the Grashof number was less than 1, meaning that natural convection is negligible in these dimensions. However, when furnaces are scaled up to the point where their heights exceed 500 mm, the Grashof number increased drastically to 3000. At this point, natural convection due to buoyancy effects can lead to complex flow patterns. In essence, this particular dimensionless number becomes important for scaled-up production where the reactor size becomes larger than a typical lab-scale reactor.
Analyses using dimensionless numbers are useful for providing the overall state within the reactor. Of all the methods available, this is the simplest way to give all kinds of information when the basic parameters are known. While useful for understanding the bulk state, they are, however, unable to provide information at a specific location and time during the reaction. Recent progress has allowed CFD to do so when coupled with reaction kinetics. For example, the change in concentration of the reactant species with reaction time, starting from initiation of the reaction until it reaches steady state, can be easily calculated.
B. Analytical methods for fluid dynamics in CVD
Studying fluid dynamics in CVD is an important factor to control the deposition process in flowing gas. For industrial purposes, to set up an efficient large production CVD, it becomes even more vital to understand the fluid dynamics to achieve a uniformly grown large-area thin film. The main purpose of these studies is to look into fluid dynamics and understand how the gas flow behaves in CVD and how it influences the deposition rate, uniformity, and quality of the thin film. The fluid dynamics of the gas flow, which is hard to observe through experiments, can be easily calculated using CFD. It can use numerical simulations to help explain the movement of the gas flow corresponding to reaction parameters such as pressure, temperature, and total flow rate. From the CFD results, details of the flow field, such as the velocity and pressure profiles, can be validated by comparison with experimental data.
Recent developments in CFD allow a relatively easy way of gaining insight into the flow behavior during the deposition reaction with the use of simulation software such as ANSYS FLUENT (ANSYS, Inc., Canonsburg, Pennsylvania). As an example, Reuge et al.Reference Reuge, Bacsa, Serp and Caussat62 developed a FLUENT model that accurately predicted the experimental yields of zinc oxide (ZnO) nanoparticles. They reported that the synthesis of the ZnO nanoparticles was influenced by the reactor configuration, either parallel or cross flow, and that the yield was dependent on the reactor configuration and on the air injection position. They then successfully optimized the processing parameters to obtain a production rate 7 times higher than the reported nominal value.
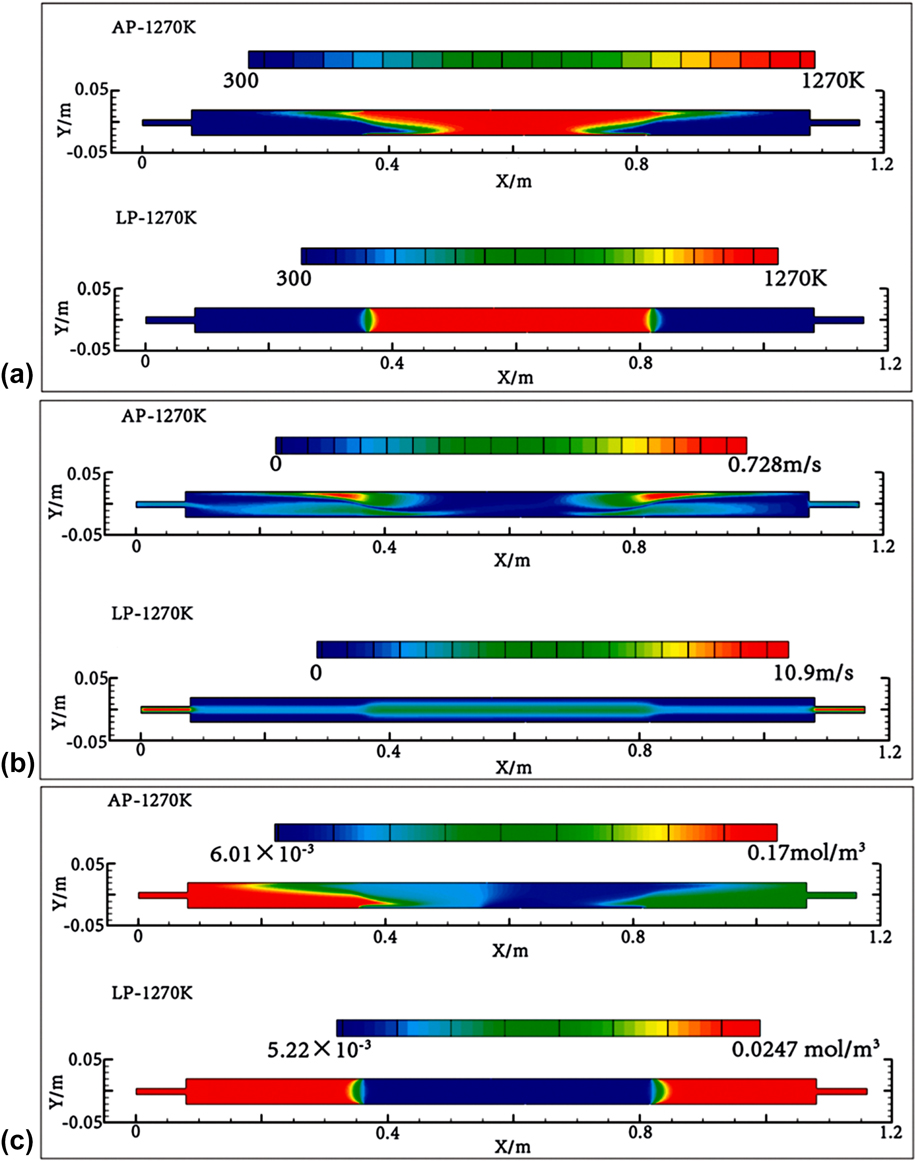
A CFD of CVD must follow the assumption of laminar flow when simulating gas-phase processes. Li, Huang, and LiReference Li, Huang and Li63 stated that gas-phase dynamics processes are important in determining the type of reaction that takes place. They systematically performed CFD at 1273 K using two different conditions, LP and AP. The results showed that at AP, the graphene growth is controlled by mass transport and at LP, it is controlled by the surface reaction. From the CFD results, contour plots of the temperature, velocity, and molar concentration of methane were calculated as shown in Figs. 4(a)–4(c). It is seen that at AP, nonuniform distributions in the temperature and velocity occur at the boundary of the furnace zone. This is because of thermal buoyancy arising from the large density change at high temperature. For the methane concentration distribution, in the case of AP, there is a gradient above the reaction wall with a lower concentration of methane at the surface caused by the thermal buoyancy effect.
(a) Contours of temperature, T; (b) velocity, v; and (c) molar concentration of methane distribution on the symmetry plane at different pressures. Reproduced from Ref. Reference Li, Huang and Li63 by permission of The Royal Society of Chemistry.

At LP, a uniform distribution for the temperature, velocity, and methane concentration was observed at the surface and in the bulk. In their findings, the simulations show that the gas-phase mechanism differs with different pressures. The results thus confirm that gas-phase reactions are an important element of the mechanism of graphene synthesis in CVD. However, the partial pressure of each gas at LP and AP is very different, making them incomparable. The methane, hydrogen, and argon partial pressures at AP are 4.2 × 10⁻³ atm, 0.1 atm, and 0.9 atm, respectively, while at LP, they are 5.6 × 10⁻⁴ atm and 2.6 × 10⁻⁴ atm (without Ar flow).
CFD using commercial software packages has been widely implemented in the study of CVD systems. However, CFD calculations are done based on the Navier–Stokes model. The validity of this model for use in CFD analysis of CVDs depends on these few assumptions which are as follows: (i) continuum flow, (ii) Newtonian fluid, and (iii) incompressible flow. Hence, modeling fluid flow for CVD conditions involving ultrahigh vacuum requires caution since these assumptions are no longer valid and thus accuracy of the model is not guaranteed for LPCVD at pressures below 0.0001 atm.
While simulation software allows unprecedented insight into the state of the reactor during deposition, having experimental verification of the simulated results is still necessary to prove the validity of the proposed model. One approach developed for observing the flow behavior within the reactor is using optical methods. The optical methods mentioned hereafter are similar to Schlieren photography methods, which rely on diffraction phenomena due to density variations in the gas. Several examples are given to show the various methods that were developed to allow in situ observation of the gas flow inside a reactor.
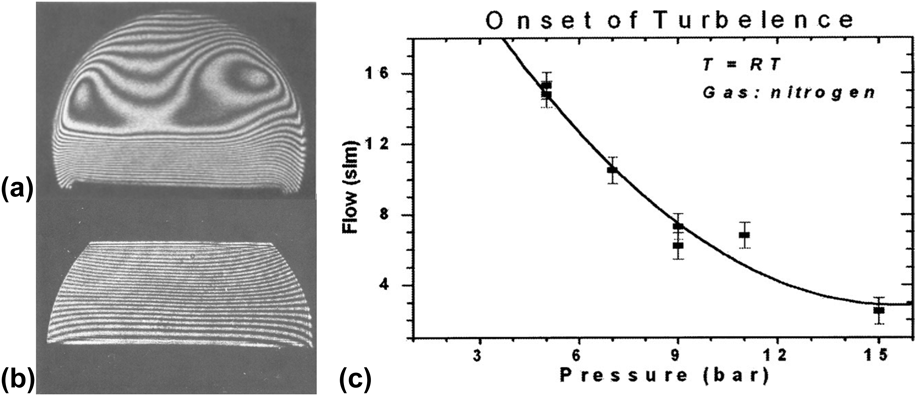
Using lasers, GilingReference Giling76 developed an interference holography method for observing gas flow in a radio-frequency induction-heated cold-walled CVD reactor. In Fig. 5(a), for nitrogen (N2) and Ar, a large temperature gradient is observed between the wall and the heating element. The susceptor creates unstable flow patterns where a laminar region is present near the substrate, but turbulent flow is present above it, providing one of the earliest experimental demonstrations of the existence of boundary layers. In comparison, H2 and He are always stable, albeit without a developed temperature profile at higher flow rates, as shown in Fig. 5(b). The gas flow pattern is also influenced by the reactor design, so by proper design of the reactor, the effects can be reduced, with only laminar flow maintained along the reactor. Based on these results, he concluded that a well-developed laminar flow works best for homogeneous deposition and provided recommendations for an optimized reactor cell that provides stable laminar flow, which has no temperature gradient and displays a well-developed temperature and flow profile.
Optical-based fluid characterization (a) N2 and Ar, medium flow velocities 4 ≤ v ≤ 0.1 ms−1. Temperature = 1350 K, susceptor length = 20 cm, and (b) H2 and He, all flow velocities 0.9 ms−1. Temperature = 1148 K, susceptor length = 20 cm. Reprinted from Ref. Reference Giling76 by permission of AIP Publishing LLC. (c) Transition from laminar to turbulent flow conditions as determined by LLS intensity measurements. Reproduced from Ref. Reference Woods, Born, Strassburg and Dietz77 by permission of Electrochemical Society.

Similarly, Woods et al.Reference Woods, Born, Strassburg and Dietz77 also developed a high-pressure CVD system with integrated real-time optical characterization. They identified the flow behavior using laser light scattering (LLS) and determined the onset of turbulence for N2 gas in relation to the flow rate and pressure. This is shown in Fig. 5(c), where the region above the line will always cause turbulence. The onset of turbulent flow occurs at a lower flow rate for increased pressure, which correlates with the Reynolds number equation via the increase in density. However, there are no calculations of the Reynolds number provided to support their findings. While all these provide a direct way of observing the gas flow, an in situ observation in a closed heated reactor presents various challenges that prevent its widespread use, severely limiting its usefulness.
Based on the above, it could be seen that while CFD plays an important role in CVD, caution is required when certain conditions bring the fluid state close to the noncontinuum region. A major factor would be the gas pressure, which determines whether the deposition rate is limited by diffusion or by the reaction kinetics. At AP, the fluid dynamics have a rather complex role on the deposition rate. Under these conditions, the system setup itself will have an effect, where a vertical furnace might have to consider buoyancy effects, while such effects are negligible in a horizontal furnace. Additionally, generally, a furnace should have a well-developed temperature and flow profile, with laminar flow and a minimal temperature gradient to achieve an accurate epitaxial deposition. In other words, to evaluate the fluid dynamics of CVD, it is vital to know the current gas flow regime in conventional CVD experiments. The gas flow regime in a circular tube can be determined through the calculation of dimensionless numbers that are significant in determining the behavior of the fluid flow.
C. Effects of CVD modification on the fluid dynamics in graphene growth
Recently, researchers have begun to realize the significance of the gas flow during the CVD growth of graphene and have started to explore the dynamics of the gas flow, especially the effect of various gas flow patterns on the graphene deposition. A few studies of modified gas flow states in CVD for graphene deposition have shown promising results, indicating the importance of fluid dynamics on the graphene deposition. The addition of disturbance and a nozzle to generate a specific gas flow pattern in CVD during deposition process were observed. Coupled with CFD analysis, the changes in the flow pattern caused by these modifications and its effect on the deposition could be thoroughly understood.
Generally, conventional CVD that uses tubular horizontal reactors possesses laminar flow under any conditions. As an example, our calculations revealed that a high flow rate of 1500 sccm, as achieved by Wu et al.,Reference Wu, Yu, Peng, Liu, Bao and Pei47 only has a Reynolds number of 72. As shown in Fig. 5(c), a very high pressure or flow rate is required to produce turbulence in the reactor, clearly exceeding the flow rate used in CVD. Therefore, we can safely conclude that extreme conditions are needed to be able to generate turbulent flow in conventional CVD. To induce turbulence, some form of physical disturbance of the gas flow is needed in the CVD setup. When there is disturbance added in the flow path, Reynolds number is not applicable for this type of experiment due to the presence of obstacle within the reactor. It seems that research on graphene is starting to explore the fluid dynamics in CVD. This growing interest is a good sign that researchers have started to realize the importance of fluid dynamics. In this section, we will discuss other modifications to conventional CVD, performed by several authors, to produce a different type of gas flow pattern.
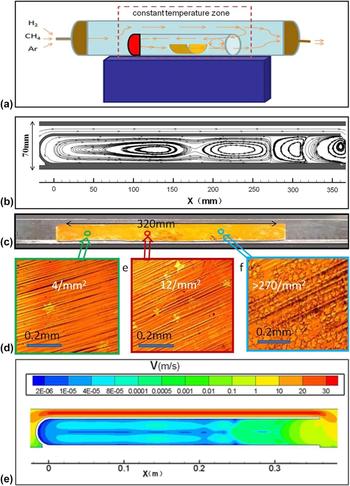
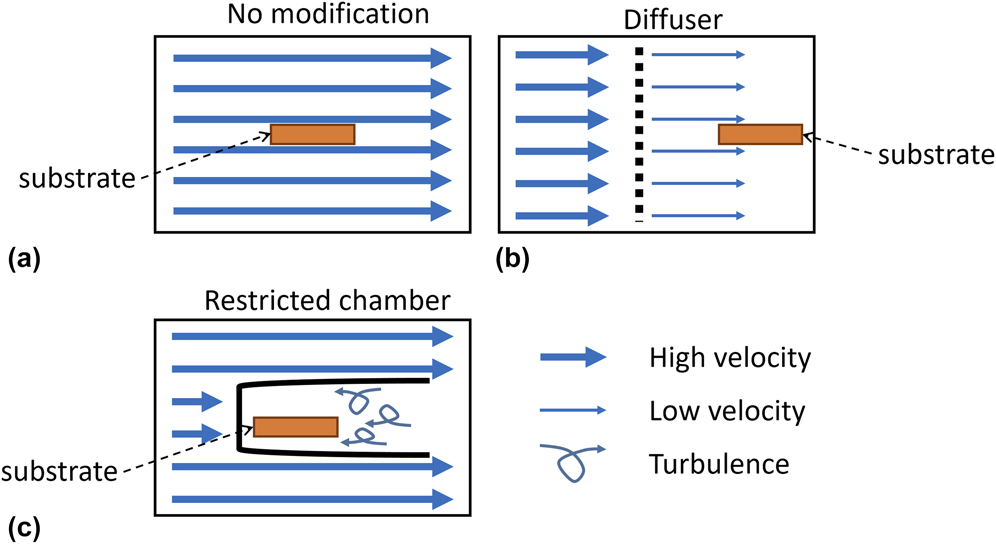
One form of modification involves inserting the substrate into a test tube-like chamber with the open end facing away from the gas in-flow, as shown in Fig. 6(a). This design creates a circumfluent flow where the gas flows around the chamber and backflows toward the substrate. This significantly reduces the gas flow velocity reaching the substrate while creating an unsteady gas flow. Alternatively, there are also papers reducing the gas flow velocity by adding a diffuser or a showerhead. The details about each paper will be discussed and summarized in Table III.
(a) Schematic diagram of a circumfluent CVD system, (b) CFD of gas flow streamlined in the inner tube, (c) copper substrate after reaction, (d) optical images of graphene domain at three different spots along the reactor, and (e) fluid field velocity distribution in the inner tube. Reproduced from Ref. Reference Wang, Chen, Han, Wang, Tang, Tang, Wang, Zou, Chen, Zhang, Qin, Chang and Wang78 by permission of Nature Publishing Group.

Modification and experimental conditions for graphene deposition in the literature, showing the reaction temperature (T), pressure (P), and composition of methane, hydrogen, and argon in the volumetric flow rate (Q) with the graphene quality.

First, Wang et al.Reference Wang, Chen, Han, Wang, Tang, Tang, Wang, Zou, Chen, Zhang, Qin, Chang and Wang78 showed that slowing the gas flow and thus reducing the gas velocity near the Cu foil surface interface during the CVD process significantly reduced the nucleation density of graphene. Low nucleation densities reduce the grain boundaries, thus increasing the quality of graphene. In their setup, a small close-ended tube containing Cu foil was placed within the reactor to create the circumfluent CVD system shown. The system was at a LP of 100 Pa operating at 1323 K, and the Cu substrate was placed near to the closed end. The observation of a flow field distribution in the inner tube using CFD, as shown in Fig. 6(b), illustrates the gas flow close to the Cu substrate during the deposition process. The velocity in the inner tube was reduced by a factor of 5 compared to the outer gas flow velocity. From Figs. 6(c) and 6(d), it can be seen that a low nucleation density of 4 domains mm−2 was obtained on the left side of the Cu substrate close to the closed end of the tube, which has the lowest gas flow velocity. Along the length of the Cu substrate, the nucleation density increased to 32 domains mm−2 in the middle and 270 domains mm−2 close to the open end. Since the desired quality of graphene should be as close to a monolayer single-crystal graphene, grain boundaries should be reduced as much as possible. Therefore, CVD conditions that give low nucleation densities will give minimal grain boundaries. According to the report here, the velocity that produces better quality graphene is in the range of 1 × 10⁻⁵ to 4 × 10⁻⁵ ms−1 as calculated by the CFD analysis in Fig. 6(e). At this velocity, the nucleation density was reduced by a factor of 70 times when compared to 270 domains mm−2 obtained when the velocity was 0.1 to 0.01 ms−1. At the open end of the tube, where the velocity is higher and approaches the outer gas velocity, the nucleation density growth is also higher.Reference Wang, Chen, Han, Wang, Tang, Tang, Wang, Zou, Chen, Zhang, Qin, Chang and Wang78 As a result, with the use of a restricted chamber inside the furnace tube, uniformity of the graphene thin film is improved as the nucleation density is reduced, yielding larger grain size. Reduction of the velocity of the gas flow in CVD is really helpful for better quality of graphene produced. By controlling the gas flow velocity with a circumfluent gas flow pattern, the graphene quality can be improved, implying that the fluid dynamics of CVD is an important aspect of the reaction.
Similarly, Song et al.Reference Song, Pan, Cheng, Wang, Zhao and Wang79 placed a chamber made from a quartz cuvette in the furnace tube with the Cu substrate placed inside. They concluded that an effect, which they termed the vapor blocking effect, formed inside the restricted chamber and that this changes the gas flow velocity distribution, significantly influencing the gas ratio effects and changing the grain size and the nucleation density of graphene. It is, in effect, an extended boundary layer with very low diffusivity caused by the reduced velocity. As a result, the uniformity of the graphene thin film and the grain size increased with the use of a restricted chamber inside the furnace tube.
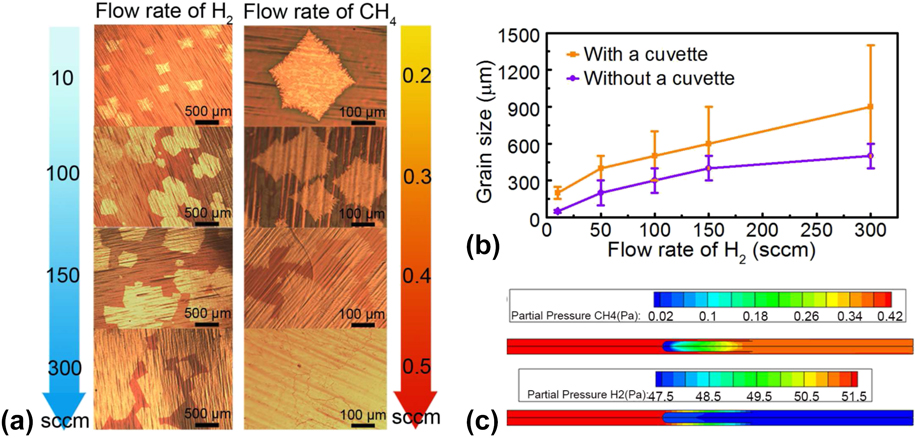
While using the restricted chamber, the effects of the H2 and CH4 concentrations on the grain size and nucleation density were observed, and the results are shown in Fig. 7(a). A larger grain size of graphene was achieved with a high concentration of H2, while reduced nucleation density was obtained with a low concentration of CH4. The insertion of the cuvette increased the grain size of the graphene compared to the normal CVD graphene shown in Fig. 7(b). The CFD analysis in Fig. 7(c) shows the concentration distribution for both gases. There is a marked decrease in the partial pressure for both as the gas flows into the chamber. Similar to Wang et al.,Reference Wang, Chen, Han, Wang, Tang, Tang, Wang, Zou, Chen, Zhang, Qin, Chang and Wang78 the closed end of the restricted chamber, with the lowest concentrations of CH4 and H2, produced a better quality of graphene. From this experiment, the quality of the graphene thin film can be improved by changing the velocity distribution of the gas flow field, which reduced the diffusivity of the gas to the substrate.
(a) The influence of H2 and CH4 gas concentrations on the nucleation density, (b) increase in the grain size of graphene using a restricted chamber, and (c) partial pressure of CH4 and H2 inside the furnace tube with a cuvette. Reproduced from Ref. Reference Song, Pan, Cheng, Wang, Zhao and Wang79 by permission of Elsevier.

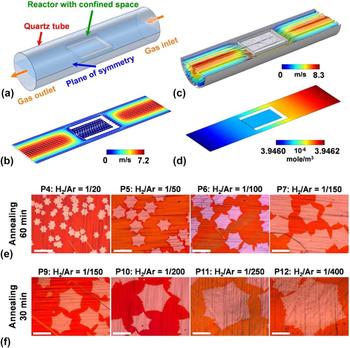
Similar to previous studies, a confined reaction space in CVD was developed by Chen et al.,Reference Chen, Kuo, Liao, Chang, Tseng, Liu and Chen80 inspired by the achievements on the reduction of nucleus density in Wang et al.Reference Wang, Chen, Han, Wang, Tang, Tang, Wang, Zou, Chen, Zhang, Qin, Chang and Wang78 and Song et al.Reference Song, Pan, Cheng, Wang, Zhao and Wang79 A chamber with one open end, creating a confined reaction space with dimensions of 22 mm × 13 mm × 50 μm, was built in a 2.54-cm-diameter CVD, where the sample was placed inside, as illustrated in Fig. 8(a). They showed that the velocity of the flow field was greatly reduced to 2.5 × 10⁻¹² ms−1, approximately 10 orders of magnitude lower compared to the outside bulk velocity of 7.2 ms−1 shown in Fig. 8(b). The transport of the reactants and the concentration distributions are reduced in the confined space, as shown in Figs. 8(c) and 8(d). They also observed that by reducing the H2/Ar concentration ratio at several different annealing times, the nucleation density decreases monotonically by a factor of 100, as shown in Figs. 8(e) and 8(f). However, this contradicts previous studies of the effects of the hydrogen concentration. While it might seem that the claim made by Song et al.Reference Song, Pan, Cheng, Wang, Zhao and Wang79 contradicts the claim made by Chen et al.Reference Chen, Kuo, Liao, Chang, Tseng, Liu and Chen80 in terms of the hydrogen concentration, it should be noted that both obtained better quality graphene when the flow rate was increased. Song et al.Reference Song, Pan, Cheng, Wang, Zhao and Wang79 increased the hydrogen flow rate itself whereas Chen et al.Reference Chen, Kuo, Liao, Chang, Tseng, Liu and Chen80 increased the argon flow rate to achieve better results. This is a good indication that the gas flow velocity distribution plays a major role in the graphene growth. This suggests that there is an optimal gas velocity, that is, not too slow or too fast to achieve a high growth rate of high-quality graphene.
(a) Schematic diagram of LPCVD with a one open end confined space with opposite gas flow direction, (b) velocity distributions of the gas flow, (c) velocity distribution of the reactant, (d) concentration distribution of the reactant, (e) effects of H2 concentration on the nucleation density for a 60 min annealing time, and (f) for a 30 min annealing time. Reproduced from Ref. Reference Chen, Kuo, Liao, Chang, Tseng, Liu and Chen80 by permission of American Chemical Society.

Li et al.Reference Li, Magnuson, Venugopal, Tromp, Hannon, Vogel, Colombo and Ruoff81 obtained a 0.5-mm crystal of single-layer graphene by LPCVD with a copper foil enclosure as the substrate. The copper foil enclosure was formed by 2 large copper foil sheets crimped on three sides. The graphene deposited inside the enclosure has a lower density of nuclei and a large domain growth, which is ∼30 times larger than previously reported. These results show that the graphene growth inside the enclosure is due to surface growth, while the growth outside is due to bulk diffusion from the carbon dissolved in the copper. They discovered that the growth inside the enclosure is not well understood and highly related to the low methane concentration in the process. From this, it can be concluded that the graphene growth and quality can be enhanced by controlling the gas velocity.
Another form of modification is to use a diffuser to supply methane in CVD for continuous roll-to-roll growth of graphene, as done by HesjedalReference Hesjedal82 in 2011. A schematic of a diffuser is shown in Fig. 9(b). A diffuser placed upstream will supply methane into the reactor along with hydrogen and argon from the main tube. This already has industrial applications in the large-scale productions of silicon wafers. The role of the diffuser is to control the fluid dynamics in CVD during the reaction because the diffuser can reduce the gas flow velocity and provide a homogenous supply into the reactor, giving an even distribution of the gas mixture. As the result, HesjedalReference Hesjedal82 was able to obtain mostly homogeneous monolayer graphene.
(a) Gas flow in conventional CVD, (b) slower gas flow after a diffuser, and (c) a slower and circumfluent gas flow created with the addition of a backward-facing restricted chamber.

Rahimi et al.Reference Rahimi, Tao, Chowdhury, Park, Jouvray, Buttress, Rupesinghe, Teo and Akinwande83 introduced a showerhead heater into their CVD to provide a uniform homogeneous heat distribution throughout the reactor, which is crucial for a low defect density and uniform graphene quality. They reduced reaction temperature to 873 K. 150-mm-sized graphene domains were produced with average values of 2.62 for I 2D/I G with a standard deviation of 0.19 and for I D/I G, 0.06 with a deviation of 0.008 obtained, indicating a good quality of graphene with high uniformity. Through the use of the heated showerhead, it was expected that the reactant gas was heated sufficiently, giving a well-developed temperature profile within the furnace similar to Fig. 3(b). This yields a well-mixed reactant that has sufficient time to decompose and deposit. Additionally, the use of a showerhead nozzle will modify the flow, directing it in a specific manner toward the substrate. As a result, the depletion problem mentioned by BloemReference Bloem71 is effectively removed, giving a facile and homogeneous deposition of graphene. For clarity, an illustration of the gas flow in conventional CVD is shown in Fig. 9(a), and the change in the gas flow after modification is shown in Figs. 9(b) and 9(c). As a summary, the results of these modifications are tabulated in Table III.
As a result, it is clear that the fluid dynamics plays a major role in determining the resulting graphene grown on a substrate by CVD. Through the reduction of the gas flow velocity, by as much as 10−12 ms−1, the graphene quality has been improved. From here, the modification of CVD is mainly to reduce the velocity of the gas flow, as well as modifying the pattern of the gas flow. This yields a huge impact on the nucleation density of the graphene growth. Additionally, through the introduction of physical obstacles inside the reactor, the gas flow was interrupted to produce turbulence in the gas flow. The results of the papers presented here show a tendency for better graphene deposition through the introduction of turbulence in low-velocity gas flows. It is necessary to have a clear understanding of the influence of the CVD fluid dynamics to precisely control the graphene grown, especially for large-scale production.
III. GAS FLOW REGIME OF A GAS MIXTURE IN CONVENTIONAL CVD
It is imperative to further inspect the behavior of the gas flow, especially when it is a gas mixture of three different gases (methane, hydrogen, and argon). In this paper, we have calculated the Reynolds number of gas mixtures in CVD for graphene deposition based on the parameters reported in the literature. The gas flow regime in CVD is evaluated using the Reynolds number. The Reynolds number is defined as a ratio of inertial forces to viscous forces in a fluid flow corresponding to the relative internal movement due to different fluid velocities. This relation is shown in Eq. (1)Reference Cengel and Cimbala70:
 $${\mathop{\rm Re}\nolimits} = {{\rho VD} \over \mu }\quad ,$$
where ρ is the gas density, V is the gas velocity, and μ is the viscosity of the gas mixture, while D is the diameter of the tube. The gas flow regime can be identified as laminar flow when Re < 1800, turbulent flow when Re > 4000, or transitional flow when 1800 < Re < 4000.
To calculate each variable to produce the Reynolds number, the properties of the gas mixture composition need to be considered according to each of the parameters reported in the literature. There are several assumptions that must be made, including that each gas and gas mixture is an ideal gas, that each gas and gas mixture is a Newtonian fluid, that the conservation of mass is satisfied, and finally, that the gas is incompressible. The gas density, gas viscosity, and gas velocity for the gas mixture differs for each experiment reported. The gas densities for the individual gases were obtained using the ideal gas law. For a gas mixture, the gas density was calculated using Eq. (2):
 $${\rho _{{\rm{mix}}}} = {{\Sigma {X_i}{\rho _i}} \over {\Sigma {X_i}}}\quad ,$$
where X i is the mole fraction and ρi is the density of component i, respectively.
The gas flow in CVD mostly relies on the gas viscosity. The viscosity of a gas increases with increasing temperature. The viscosity of a pure monoatomic gas can be obtained from the already available data provided by previous studiesReference Hanley, Intemann and Mccarty84,Reference Hanley, Intemann and Mccarty85 or using the equation correlated as a function of temperature by Ernest E. Ludwig: μG = A + BT + CT 2, where A, B, and C are regression coefficients for various chemical compounds compiled in “Ludwig’s Applied Process Design for Chemical and Petrochemical Plants, Fourth Edition”Reference Coker86 and T is temperature. The viscosity of the gas mixture can be evaluated using the extended Chapman–Enskog theoryReference Themelis87:
 $${\mu _{{\rm{mix}}}} = {{\Sigma {X_i}{\mu _i}{{\left( {{M_i}} \right)}^{1/2}}} \over {\Sigma {X_i}{{\left( {{M_i}} \right)}^{1/2}}}}\quad ,$$
where X i is the mole fraction, μi is the viscosity, and M i is the molecular weight of component i, respectively. The gas viscosity is not sensitive to pressure, but the density is very dependent on pressure. For the velocity of gas flow in a pipeline, the average velocity (V avg) is considered. V avg in terms of the volumetric flow rate can be calculated using Eq. (4):
 $${V_{{\rm{avg}}}} = {Q \over {{A_{\rm{c}}}}}\quad ,$$
where Q is the volumetric flow rate and A c is the cross-sectional area of the tube.
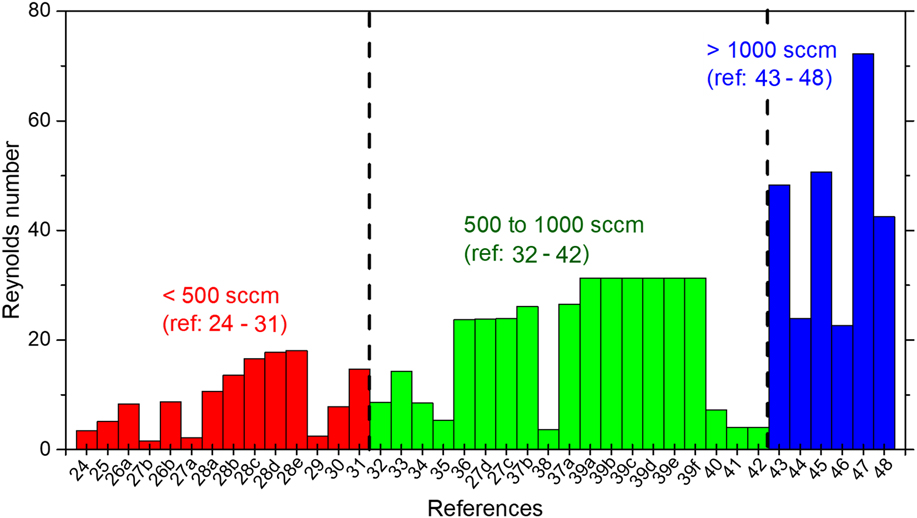
After all the variables for the gas mixture in the APCVD are attained, the Reynolds numbers were calculated for a horizontal hot-walled tubular APCVD for graphene from previous studies. Previous studies used as references are APCVD-grown graphene on a Cu substrate using methane, hydrogen, and argon gases in a temperature range of 1123–1323 K with different reactor geometries. Figure 10 illustrates the calculated Reynolds numbers from 25 references from between 2008 and 2016, grouped based on their total flow rate. These calculations of the Reynolds number based on the parameters from previous studies have proven the claim that the gas flow regime in CVD is laminar flow as none of the conditions exceeds Re > 100.Reference Choi, Choi, Kim, Jeong, Yu, Kim, Kim, Shin, Cho and Choi24–Reference Vlassiouk, Fulvio, Meyer, Lavrik, Dai, Datskos and Smirnov48
Calculated Reynolds numbers for horizontal hot-walled tubular APCVD of graphene as reported in the literature.Reference Choi, Choi, Kim, Jeong, Yu, Kim, Kim, Shin, Cho and Choi24–Reference Vlassiouk, Fulvio, Meyer, Lavrik, Dai, Datskos and Smirnov48 Note that the conditions are only for 1273 ± 100 K on a copper substrate with various gas compositions.

It should be noted that the total flow rate and the geometry of the reactor will also affect the Reynolds number. If we rewrite the velocity in the Reynolds number equation, we get Re = 4ρQ T/πDμ. We can see that the total flow rate is directly proportional to the Reynolds number, while the diameter of the reactor is inversely proportional to the Reynolds number. This can be seen from Fig. 10, where some Reynolds numbers were significantly different even when the flow rates were in the same range. A higher total flow rate will give a higher Reynolds number, whereas a larger reactor diameter will reduce the Reynolds number.
Following this, in their paper, Lewis, Derby, and KinlochReference Lewis, Derby and Kinloch51 analyzed the Reynolds number for the precursor gas and found them to be below the critical value for turbulence, meaning that the flow was laminar across the entire parameter space. They observed the state of the gas flow for each of the individual gases at various temperatures under ambient conditions. The Reynolds number of acetylene gas was 5–10 times higher than that of hydrogen. Their findings show that the Reynolds number of acetylene gas is smaller than that of methane, which means that the type of hydrocarbon also generates different Reynolds number values.
Other Reynolds number calculations for CVD-grown graphene are reported by Zhang et al.,Reference Zhang, Hu, Wang, Wang, Liu, Yang and Cao88 who in their CVD experiments on graphene obtained Reynolds numbers of 17–17.9. They therefore concluded that the mixed flow in the tube is typical laminar flow. Additionally, Vlassiouk et al.Reference Vlassiouk, Fulvio, Meyer, Lavrik, Dai, Datskos and Smirnov48 report Re < 10 in their 15.24-cm-diameter reactor with a total flow rate of 5000 sccm. Therefore, the gas flow regime in CVD remains laminar even at an extremely high total flow rate. From the CFD analysis of CVD graphene done by Li, Huang, and Li,Reference Li, Huang and Li63 the observation of a uniform distribution of velocity regimes during deposition provides computational confirmation of the laminar gas flow.
There are some other factors that maintain the laminar flow state in hot-walled CVD. Back to 1982, CFD simulations were still under development and GilingReference Giling76 had visualized the gas flow pattern in a cold-walled horizontal reactor using interference holography for several gases, showing complexity in the gas flow pattern. Figure 5(b) clearly shows that the gas flow is laminar throughout the reactor during the reaction for H2 and He gases. However, for Ar and N2 gases, there was a region of unsteady flow formed due to convection. There are many factors that contribute to the complexity of the gas flow pattern, and from his paper, it seems that the convection motion was caused by a temperature gradient between his susceptor heating element and the cold wall of his reactor. A gas with a higher molar mass, such as Ar or N2, will be easily affected by the temperature gradient between the gas and the wall, while a gas with a lower molar mass will maintain laminar flow even in the presence of a temperature gradient throughout the reactor. Hot-walled CVD provides more uniform heating and prevents heat loss, thus creating a temperature profile that is well developed. It is important to keep the temperature constant throughout the reactor to prevent disturbance to the laminar flow.
These visualizations agree with the theoretical calculated flow regime that can be predicted based on the Reynolds number and the Grashof number. Since then, with the introduction of CFD simulation, most studies simply take the gas flow in CVD to be laminar without exploring the gas flow dynamics and behavior of CVD in detail. As mentioned in Sec. II.B, GilingReference Giling76 gave insight into the importance of the fluid dynamics in CVD from the aspect of gas composition.
Our analysis of the parameters taken from the literature proves that the gas flow regime in a conventional APCVD process under any conditions is laminar flow. From the equation for the Reynolds number, a higher total flow rate of gas will give greater Reynolds numbers under the same conditions, a trend that is reflected in Fig. 10. Furthermore, it is observed that the gas composition will influence the properties of the gas mixture. The correlation between the Reynolds number and the gas composition will be discussed in Sec. IV. What needs to be emphasized here is that it is important to identify the type of gas flow in CVD during the reaction because while transport and reaction processes influence the deposition, it is ultimately related to the gas flow regime, as this will affect the whole deposition process.
IV. EFFECT OF GAS COMPOSITION ON THE REYNOLDS NUMBER
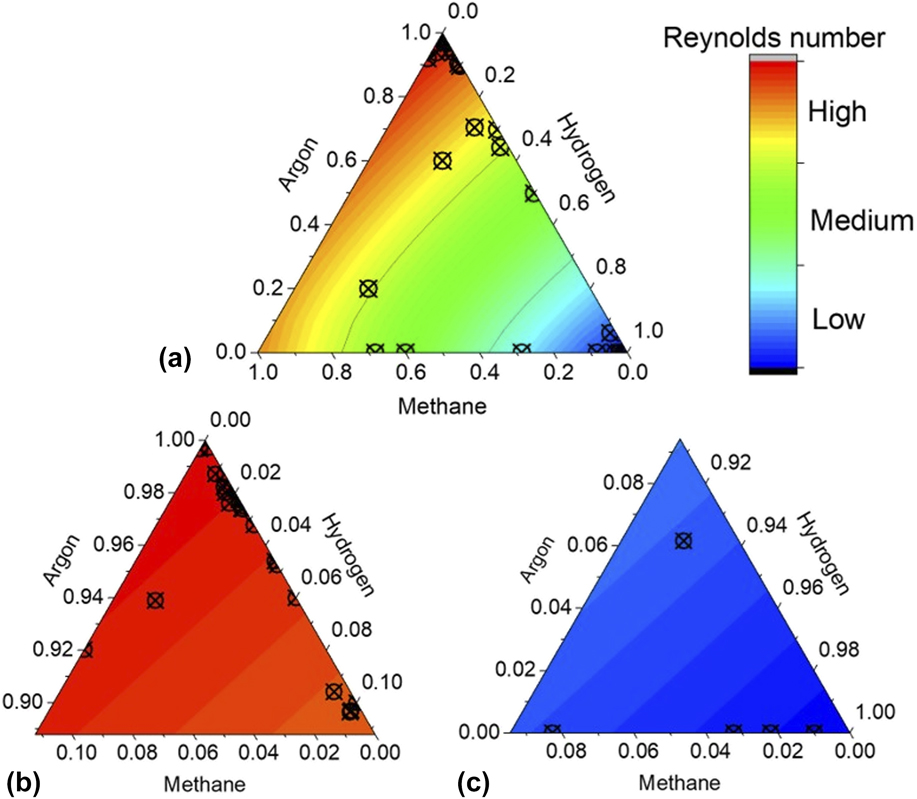
The gas flow regime in conventional APCVD has been identified as laminar flow under any conditions since calculated Reynolds numbers below 100 are obtained under all conditions. In the equation for the Reynolds number, the gas flow regime is highly correlated with two gas properties, density, and viscosity. These two properties act in different ways depending on the type and amount of each gas used. In graphene deposition, 3 types of gases are generally used, methane, hydrogen, and argon, which mix together inside the reactor, decompose into active carbon species, and then deposit onto the substrate. The amount of each gas in the reaction will influence the deposition process and the fluid dynamics of the gas flow. This paper focuses on APCVD graphene using a copper substrate. The relationship between the composition of each gas and the Reynolds number can be visualized using a ternary contour plot of the Reynolds number, illustrated in Fig. 11. The three axes are the fractions of methane, argon, and hydrogen composition from 0.0 to 1.0. It can be seen that the highest Reynolds number, represented by the red contour, occurs in the argon-rich region, while the lowest Reynolds number, represented by the blue contour, occurs in the hydrogen-rich region. Intermediate Reynolds numbers, represented by the green contour located in the middle of the triangle, occur where there are approximately equal compositions of the three gases.
Ternary contour plot of the Reynolds number showing the effect of the gas composition at an arbitrary temperature and total flow rate, plotted together with the reported gas compositions in the literature.Reference Choi, Choi, Kim, Jeong, Yu, Kim, Kim, Shin, Cho and Choi24–Reference Vlassiouk, Fulvio, Meyer, Lavrik, Dai, Datskos and Smirnov48 Note that the total gas composition for all gases is 1.

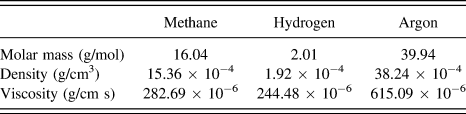
It can be seen from the Reynolds contour plot that Reynolds number can be controlled by the gas composition in the reaction. The properties of the gases at 1273 K are listed in Table IV. Argon has the largest molar mass among the gases, while hydrogen has the smallest molar mass. Although it seems that Argon has the highest molar mass, as well as density and viscosity, the behavior in CVD is highly correlated with the hydrogen gas, which is the lightest and has the smallest values of density and viscosity. A small amount of hydrogen will give the highest Reynolds number, while increasing it will reduce the Reynolds number to the smallest value at the highest amount of hydrogen. We know that Argon is used as a diluent and the buffer gas for the CVD process, but it is important to realize that most influential gas for the fluid dynamics in graphene CVD is the hydrogen gas.
Gas properties of methane, hydrogen, and argon at 1273 ± 100 K.

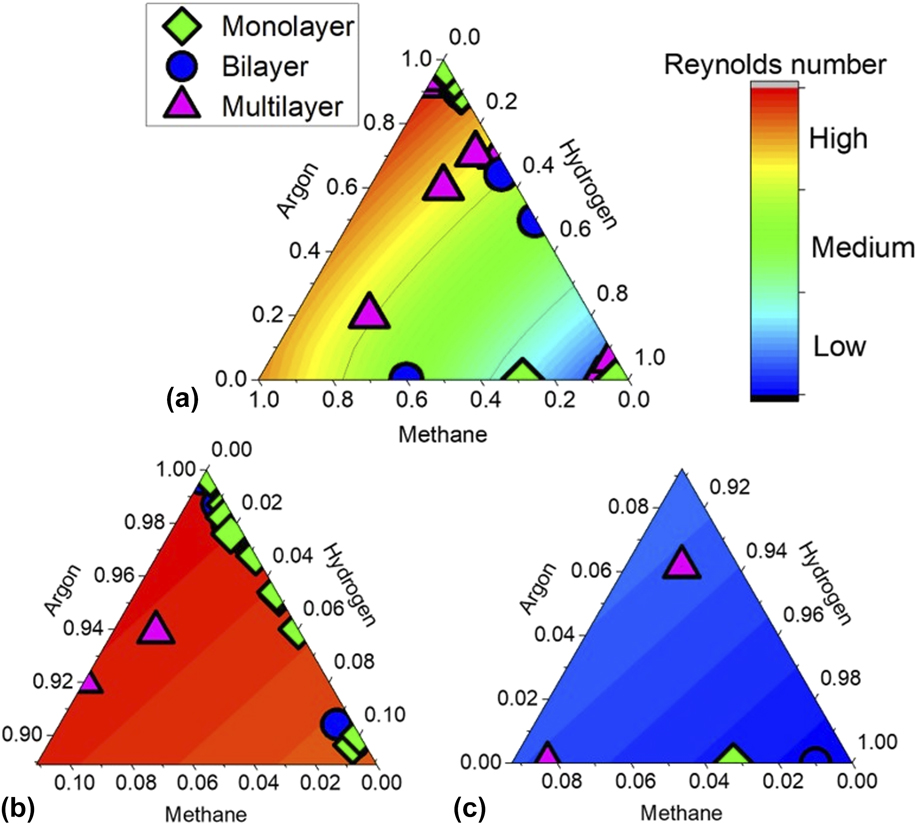
From Sec. III, where the Reynolds numbers were calculated, the gas compositions from those studies were overlaid onto the ternary plot, as shown in Fig. 11. After combining all the references, we can see that most studies were performed on certain gas compositions. Most of the previous experiments focus on the high Reynolds number region with high concentrations of argon and on the low Reynolds number region, which has a high concentration of hydrogen gas.
Thus, after the effect of the gas composition on the Reynolds number is understood, a suitable design could be made with required aspects that yield the optimal deposition conditions. For instance, to obtain a high Reynolds number, a smaller cross section or diameter of the furnace tube is needed with a high total flow rate in the tube. It is preferable to have a large argon flow rate compared to the other two gases. Understanding these factors will provide the basis for designing a suitable setup for graphene growth. The appropriate gas composition and flow rate for a given reactor geometry can be easily estimated from the ternary plot.
V. EFFECTS OF THE REYNOLDS NUMBER ON THE GRAPHENE QUALITY AND GROWTH
The graphene quality was plotted into the Reynolds number triangle to illustrate the connection between the gas composition and the graphene quality. Figure 12 displays a compilation of the graphene quality obtained at certain reported gas compositions in the APCVD process, from the prior literature, in the Reynolds number ternary plot. In the red region, with the highest Reynolds number, mostly monolayer- and bilayer-deposited graphene is obtained. In the blue region, with the lowest Reynolds number, graphene produced is mostly multilayered. As a result, we know why most of the CVD graphene studies since 2011 on Cu at AP focus on the region with a high composition of argon and a low composition of hydrogen and methane. From this ternary plot, the Reynolds number and quality of graphene can be predicted for all gas compositions. The gas composition that gives the highest graphene quality has been identified. Therefore, the development of future graphene synthesis by APCVD needs to focus on this particular gas composition, in which the methane concentration is on the order of parts per million (ppm).
(a) Graphene quality for the APCVD hot-walled furnace versus the gas composition of methane, argon, and hydrogen on Cu at 1273 ± 100 K as reported in the literature,Reference Choi, Choi, Kim, Jeong, Yu, Kim, Kim, Shin, Cho and Choi24–Reference Vlassiouk, Fulvio, Meyer, Lavrik, Dai, Datskos and Smirnov48 (b) enlarged methane-rich region (red), and (c) hydrogen-rich region (blue). Note that the total gas composition for all gases is 1.

Low concentrations of methane were used to limit the deposition reaction rate, preventing the excessive formation of graphene domains and layers. The literature reviewed here also uses a low methane concentration. Interestingly, a diluent that is mostly argon yields better quality graphene than when a mostly hydrogen diluent was used. Comparing both these gases, it would be beneficial to recall the experiment done by Dirks and Spear,Reference Dirkx, Spear, Davis, Palmour and Porter66 in which they noted that hydrogen and helium share similar fluid properties compared to argon. It may be that certain fluid properties of argon contribute positively to the CVD-grown graphene. Additional studies are definitely needed to verify if conclusions similar to those of Dirks and SpearReference Dirkx, Spear, Davis, Palmour and Porter66 can be drawn for the case of CVD grown graphene, on which the gas composition plays a major role. These will determine whether the chemical properties of the gas or its fluid properties have a larger effect.
VI. CONCLUSIONS
In this account, we have reviewed certain aspects of the fluid dynamics in the APCVD of graphene on a Cu substrate where at AP, the gas-phase reaction plays an important role in the deposition process. The pressure of the CVD during the reaction will determine the rate-limiting step for the deposition process. At AP, the deposition is controlled by the diffusion of gas species, while at LP, the deposition is controlled by the reaction kinetics. Studies of the fluid dynamics in CVD mostly modified the CVD to obtain a slower gas flow velocity with a certain pattern flow that improved the graphene quality.
In a conventional APCVD, calculation of the Reynolds number based on the experimental parameters from the literature proves that the gas flow regime in the APCVD of graphene is laminar flow, as all calculated values were below 100. The Reynolds number can also be controlled by controlling the gas composition. From the ternary plot, the highest Reynolds numbers were obtained in the region with the lowest hydrogen concentration, while the lowest Reynolds numbers were obtained in the region with the highest hydrogen concentration. This shows that the most influential gas for fluid dynamics in APCVD is hydrogen. Most of the studies on the APCVD of graphene have focused on the region with the highest Reynolds number (lowest hydrogen concentration) and mostly produced monolayer and bilayer graphene. Using more hydrogen in the reaction reduces the graphene quality and creates a lower Reynolds number. From this ternary plot, the Reynolds number and quality of graphene can be predicted for all gas compositions. The gas flow behavior is influenced by the total volumetric flow rate, reactor geometry, and gas composition. These factors will change the Reynolds number, which results in different qualities of deposition.
We conclude that the quality and graphene growth rate can be improved by altering the fluid mechanics of the system. This gives huge advantages to the industrial production of graphene by reducing the growth time and the usage of precursor gas. It is to be hoped that this work will be beneficial as a process design tool, reducing the time and effort required to develop a CVD system for graphene deposition. Additionally, it will contribute to the understanding of transport processes in a horizontal cylinder reactor for the CVD of graphene on Cu at AP.
In this review paper, it has been shown that while good quality graphene is easily obtainable by CVD, time and energy requirements remain as the biggest barrier for large-scale production of graphene through CVD. It has been shown here that in terms of gas dynamics, alternative carrier/diluent gas should be explored as mechanical properties of the gas also influences deposition of graphene. In fact, gas composition could be customized to provide certain specific properties for the deposition. Also, reactor designs that further control gas velocity are also potential avenues to be explored for achieving uniform gas delivery and low nucleation densities. Unrelated to gas dynamics, development of suitable catalysts which has lower activation energies, better conversion, and selectivity for graphene synthesis still has room for improvement.
ACKNOWLEDGMENTS
This work was financially supported by Long-term Research Grant Scheme (LRGS15-003-0004), Research Initiative Grant Scheme (RIGS17-054-0629), Fundamental Research Grant Scheme (FRGS17-035-0601) from Ministry of Higher Education Malaysia (MOHE), and International Islamic University Malaysia (IIUM).