

1. INTRODUCTION
Despite the vast amount of research that has been published on the life experiences of the poor in the final century of the Old Poor Law, historians have only relatively recently begun to undertake detailed investigations into the functioning of the poor law at a ‘micro-level’ within the parish, and (in particular) whether it was playing an increasing role in supporting labourers' household economies across the life-course after the turn of the nineteenth century.
While the recent emphasis on the many overlapping and contradictory ‘experiences’ of eighteenth-century poverty has brought a welcome focus on particular groups of recipients, such as female wage-earners,Footnote 1 illegitimate children,Footnote 2 the elderly poorFootnote 3 or the chronically sick,Footnote 4 this may have come at the expense of an understanding of the composition or changing needs of the totality of recipients in any particular parish. This holistic approach has been pursued most extensively in the studies of Barry Stapleton, Thomas Sokoll, Steve King, Pamela Sharpe, Samantha Williams and Samantha Shave.Footnote 5 So far, only Susannah Ottaway, Samantha Williams and Samantha Shave have reconstructed these life-time experiences of poor relief recipients, by assembling ‘pauper biographies’ and assessing the flows of relief across the life-course between 1760 and 1834.Footnote 6
Ottaway demonstrates the expansion in reliance on poor relief among elderly residents in Terling and Puddletown, compared with Ovenden, Halifax, but also the diminution in the intensity of care by the end of the eighteenth century.Footnote 7 Williams and Shave both conclude that the size and diversity in relief payments expanded in the period after 1795, but that dependence was by no means uniform or universal.Footnote 8 Williams's study of two Bedfordshire parishes, (rural) Campton and (small-town) Shefford, emphasised the importance of the life-course in driving demand for relief. Most regular pensioners were the elderly and lone parents.Footnote 9 Their numbers were swelled by couple-headed families who received family allowances during the agrarian crisis between ‘December 1799 and March 1802’.Footnote 10 However, she finds that ‘while the secondary literature assumes the widespread allocation of relief’ to such families after 1795, ‘such assistance was in fact far more sporadic and limited’ in practice.Footnote 11 Over time, though, rising levels of illegitimacy brought more lone women onto the relief lists, while men over 60 years of age were increasingly crowded out of the overstocked post-war labour market.Footnote 12 Even so, Williams found that ‘the vast majority of poverty was not inherited by children from their parents’.Footnote 13 Consequently, she concludes that ‘the pauper biographies provide strong evidence that such relief was restricted to economic crises and was largely supplementary in nature’, with only a minority of residents in Campton and Shefford (albeit a ‘substantial’ one) experiencing poverty that was more ‘life-time’ than ‘life-cycle’, extending across concentrated periods of years.Footnote 14
Shave's micro-historical investigation into the relief histories of eight paupers in the Dorset village of Motcombe questions many existing assumptions about the reasons why individuals received relief, and whether occasional payments actually indicated ‘dependence’. She reveals a very complicated relationship to relief, in which there were ‘notable absences of the poor law in adults’ lives, absences which complicate the idea of a blanket dependency’.Footnote 15 There was no invariable rule that those with large families would seek relief, or become reliant on it. There was no certainty that such families would come to depend on regular weekly or monthly pensions. Indeed, the earning capacity of older children, or their residence elsewhere, could reduce the dependency of larger families.Footnote 16 The Motcombe overseers displayed a tendency to employ single mothers as servants to the parish workhouse, but apart from that they shared the highly varied and intermittent patterns of relief experienced by other women, and men.Footnote 17 Consequently, she argues that ‘there was no solitary, universal experience of poverty within the context of the parish… [and] many welfares under the provisions of the old poor law, not just one’.Footnote 18
Such conclusions remind us that all relief decisions had a personal, human dimension, however neat and impersonal the records appear in the surviving overseers' account books. They also emphasise that we can impose distortions when we seek to abstract general trends from a series of specific and highly individualised relief decisions. Any assessment of the extent of households' dependence on poor relief is fraught with issues of definition. As Karel Williams observed in 1981, the old Poor Law never resembled a ‘social security system’, because it never comprehended all welfare needs (sickness, disability and residential care, income support, unemployment assistance, universal old-age benefits), and never attempted the necessary ‘detailed differentiation of beneficiaries’.Footnote 19 It provided some of these services, but generally to only a minority of possible beneficiaries, and did so intermittently and (often) inadequately. Apart from those profoundly disabled, chronically sick or in extreme old age, almost no one depended 100 per cent on the parish for their subsistence. Instead, most recipients' recourse to the parish was infrequent and partial – during intervals in which earning capacity was reduced by bereavement, desertion, accidents, sickness, pregnancy, inadequate employment opportunities or insufficient wage rates.Footnote 20 If the degree of ‘dependence’ was relative, then so must be our judgements about the adequacy of the institutional response. Unsurprisingly, therefore, historians have tended to divide between ‘optimists’ and ‘pessimists’ in interpreting the depth of poverty and the ‘generosity’ or otherwise of overseers in the late eighteenth and early nineteenth centuries.Footnote 21
As King notes, ‘generosity’ is a difficult analytical concept because it is so open-ended, and potentially subjective – ‘generous’ compared with what, or ‘generous’ according to whom?Footnote 22 In this study, we will focus instead on the related concept of ‘dependence’, because it appears possible to establish whether or not parish relief became more or less significant in labourers’ household economies without having to pass judgement on how such provision might have been perceived by its recipients. Relative levels of ‘dependence’ can be analysed by examining changes over time in: the age, gender profile and life-course experience of recipients; the frequency, value and purpose of payments; and the size of relief payments compared with levels of adequate household income. In doing so, this study attempts to integrate the approaches of Williams and Shave, in two ways. The first is to link Shave's forensic exploration of family circumstances to Williams’ awareness of the broader dynamics of economic change and the pressures on relief expenditure. The second is to try to strike the difficult balance between the depiction and recognition of the subatomic oscillations of individual relief decisions, and the identification of regularities in some of these movements, in certain circumstances, for particular categories of recipients, at specific points in the life-cycle.
2. THE SAMPLE
This study concentrates on a detailed analysis of poor relief payments in the Essex parish of Terling between 1762 and 1834. Terling is very well known in the social history of early modern England, because it was the subject of Keith Wrightson and David Levine's pioneering 1979 village study.Footnote 23 It has also featured in research on poverty in the eighteenth century by Richard Smith and Susanna Ottaway.Footnote 24 An important legacy of this previous research is that the Cambridge Group for Population and Social Structure (CAMPOP) holds a family reconstitution of the village, which has been consulted for this study.Footnote 25
In addition, this research is based on a full transcription of all poor law payments to named individuals in Terling between 1762 and 1834, whether these were in the form of weekly pensions, occasional payments or a third category of ‘additional allowances’.Footnote 26 Weekly pensions, or ‘weekly allowances’ as they were termed in the overseers’ accounts, were specific sums allocated to be paid weekly to particular recipients, listed at Michaelmas and Easter and adjusted through the year. ‘Additional allowances’ were first listed in 1808, as a form of regular, defined additional family allowance paid primarily to male householders, and were recorded for the years 1808–1809, 1816–1819, 1824–1829 and 1832–1833 inclusive. All other payments recorded by the overseers, described here as ‘occasional payments’, were irregular, responsive and discretionary. As Ottaway has shown, 40–50 per cent of these payments were made ‘in kind’ in Terling, but almost always had a cash value attributed to them.Footnote 27 The analysis is based on these cash values, throughout. There were 86,545 weekly pension payments transcribed for the period 1752 to 1834; 48,911 occasional payments between 1762 and 1834; and 8,345 additional payments between 1808 and 1834. In total, 143,801 payments were transcribed, paid to 1,498 separate recipients.Footnote 28
These payments were recorded in an Microsoft Access database, with a number of entry protocols.Footnote 29 First, all payments were attributed directly to a single named beneficiary rather than any intermediary recipient (such as a husband or parent). This might overstate the total number of recipients, but it avoids inflating the sums received by each recipient. Second, recipients were located within family groups identified by the CAMPOP family reconstitution. This helped confirm their identity by reference to parents, siblings and respective ages, as far as possible.Footnote 30 Inevitably, some of these identifications remain tenuous, particularly in a village where there were, for example, eight women called Mary Thurgood and five men called William White all in residence simultaneously! Third, the dates of each payment were converted to a weekly number, using a 53-week year to allow for years beginning and ending in mid-week. Payments were then summed per person, per denominated week, to create weekly totals that could add together payments of weekly pensions, occasional payments and additional allowances to the same person in the same week.
3. EIGHTEENTH-CENTURY TERLING: CONTEXT
Later eighteenth-century Terling was characterised by a sharp tripartite distinction between landlord, tenant farmers and waged agrarian labourers. Although 32 per cent of all household members in the village were employed ‘chiefly in agriculture’ in 1801, the majority were either agricultural day labourers, or casual field workers. By 1820, the Strutt family owned almost all the land in the parish. They rented their estate to approximately 20 tenant farmers, who controlled the parish vestry. In 1800, 9 out of the 12 largest ratepayers were John Strutt's tenants and the parish vestry was a tightly knit body in which the voices of 15–20 individuals predominated, even before it opted for ‘select’ status under Sturges Bourne's Act.Footnote 31 Although the Strutt family exerted considerable influence in the village, the vestry was capable of independent action. For example, in March 1824, the vestry thanked Col. Joseph Strutt for his offer of a parcel of land ‘rent free for the purpose of employing the Poor in spade husbandry’, but rejected it because they were ‘apprehensive that it is not likely to be beneficial to the Parish’.Footnote 32
Under the watchful eyes of the Strutts, the vestry attempted close regulation of the parish's relief recipients, but generally by copying relatively widely adopted initiatives.Footnote 33 In 1775, it had echoed its seventeenth-century forebears by cracking down on ‘idleness’ by regulating drinking in the village's alehouses.Footnote 34 In 1785, rising relief costs produced a requirement that recipients were to provide details of their earnings and employment, while the ‘principal parishioners’ were ordered to visit recipient households to enjoin church attendance.Footnote 35 As bills rocketed after 1794, the vestry initiated the first of a series of schemes to provide subsidised flour to the poor, and restricted gleaning rights to widows and poor families.Footnote 36 As in other parishes, in the winter of 1800 the vestry provided food supplements and substitutes (herrings and rice) to paupers, and created a rota by which the vestry members visited every recipient household each week.Footnote 37 It conducted surveys of relief recipients in 1801, 1803, 1809 and 1811, recording the structure of recipient households, their sources of income, and (in 1801) their state of health, as discussed below.Footnote 38 As shown above, it also instituted a ‘family allowance’ system in 1808.
After 1815, the parish provided road-mending work for unemployed male labourers, and in February 1819 the vestry agreed that the parish clerk should keep a list of labourers out of work.Footnote 39 By 1824 the vestry had been reconstituted as a ‘select’ one,Footnote 40 and in February of that year agreed to institute a labour rate on occupiers, by which such householders either employed labourers directly in proportion to their rateable liability, or reimbursed the overseers for doing so.Footnote 41 In 1827 the vestry agreed to rebuild the parish workhouse, but it remained small and between Michaelmas 1829 and Easter 1830, it accommodated only 9–10 persons.Footnote 42 After 1830 the vestry took more concerted steps to reduce the total numbers of recipients and costs, and in March 1835 Richard Ellis was congratulated by the vestry for his three years as assistant overseer, ‘under whose administration with Mr Strutt supported by the Vestry the rates have been reduced from 8s. 9d. to 4s. in the Pound’.Footnote 43
The general pattern of poor relief expenditure in Terling reflected the growth of the agricultural day-labour force, and supports existing depictions of a narrowing of alternative employment opportunities, particularly for women and children in southern and eastern England.Footnote 44 We can obtain an initial measure of the proportion of recipients in Terling compared with the total population by comparing the parochial returns to parliament of the number and status of relief recipients in the year 1802–1803 with parish population figures for 1801. As Sokoll's work on the Essex parish of Braintree suggests, such figures are likely to be underestimates, but they provide a fairly consistent basis for comparisons.Footnote 45 In Witham Hundred, in which Terling was located, the numbers relieved in the year Easter 1802–1803 were equivalent to 21 per cent of the 1801 population.Footnote 46 In Terling itself, the figure was 18 per cent. Proportions of between 10 and 20 per cent were common in south Essex (Barstable, Becontree, Chafford, Havering Liberty, Rochford, Thurstable, Waltham and Dengie Hundreds), west Essex (Uttlesford and Freshwell Hundreds), and around Colchester (Colchester borough, Tendring, Lexden and Harwich boroughs). The highest proportions of recipients (25–34 per cent of the 1801 population) were in the populous, former cloth-producing hundreds of Hinckford, Dunmow, and around Chelmsford, in the north and centre of the county. This echoes the distributions of exemptions observed in the county in the mid-seventeenth-century hearth taxes.Footnote 47
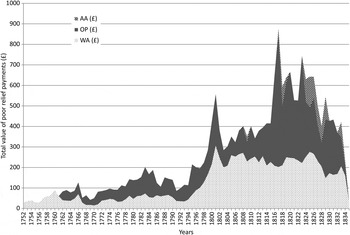
Figure 1 depicts the longer-term dynamic of relief levels in the parish by illustrating the total amounts paid per year to recipients of the three types of outdoor relief granted in Terling: weekly allowances, irregular ‘occasional’ payments and additional allowances, at constant 1778 prices. The chronology of change in Terling resembles Sokoll's study of Ardleigh (but not Braintree), Williams's Bedfordshire parishes, and Daniel Baugh's figures for southern England.Footnote 48 Before 1775, the parish spent generally less than £100 per annum, and made between 500 and 1,000 relief payments each year in total.Footnote 49 Between the late 1770s and the early 1790s, total expenditure regularly exceeded £100 per annum, with a shallower rate of increase in the number of payments made each year. With the onset of the wartime harvest failures and price inflation from 1794, total spending immediately doubled to £200 and then rose sharply to peak at over £500 in 1801. At the same time, the annual number of relief payments also doubled to over 2,000 per annum. Once the crisis of 1800–1801 had subsided, relief levels stabilised at approximately double their pre-war level until the winter of 1815. Relief levels peaked in 1816 at over £850 and nearly 5,000 payments (almost eight and five times the respective figures for 1760–1764). From then until 1825 expenditure never fell below £500, and was rarely below £600, with more than 3,000 payments per year being made until 1830.
Terling 1752–1835: distribution of value of different types of poor relief payments (£). AA, Additional allowances; OP, occasional payments; WA, weekly allowances. Source: Essex Record Office, Terling Overseers’ Disbursements, 1762–1834.

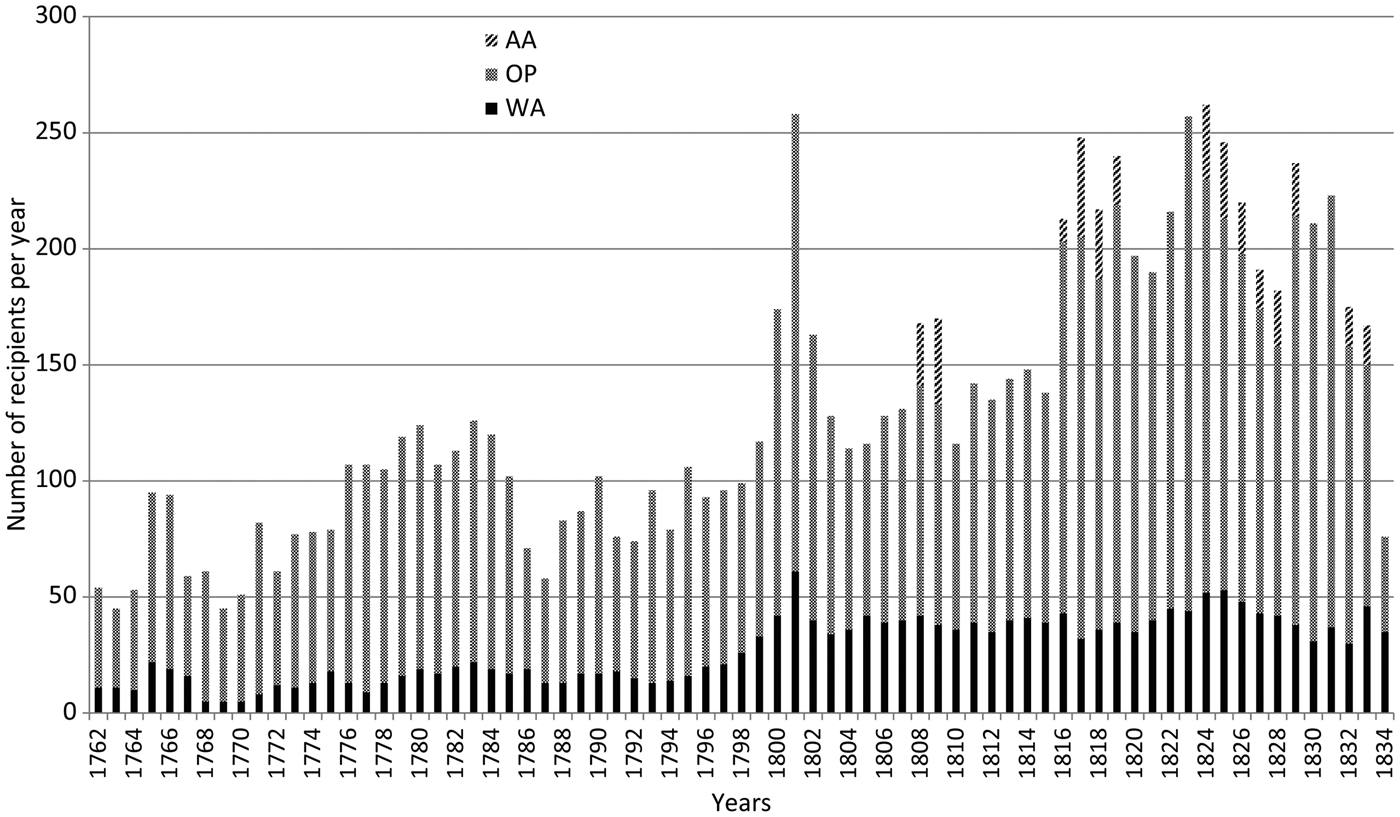
In general terms, there were similar changes in the numbers of actual recipients of this relief, shown in Figure 2.Footnote 50 On average, 65 persons had received some form of relief each year between 1770 and 1774, with around 10 receiving regular weekly ‘pensions’. Between 1816 and 1833, at least 150 persons per annum received poor relief of some sort, of whom over 30 were weekly ‘pensioners’. This total increase of 230 per cent was rather more than the 137 per cent increase in the village's total population (from approximately 650 to 890). On average, between 1820 and 1824, 22 persons per annum received relief for more than 50 weeks, where only 4 had done so in the early 1770s (an increase of 550 per cent).
Terling 1762–1834: total numbers of recipients per year for weekly allowances (WA), occasional payments (OP) and additional allowances (AA). Source: Essex Record Office, Terling Overseers’ Disbursements, 1762–1834.
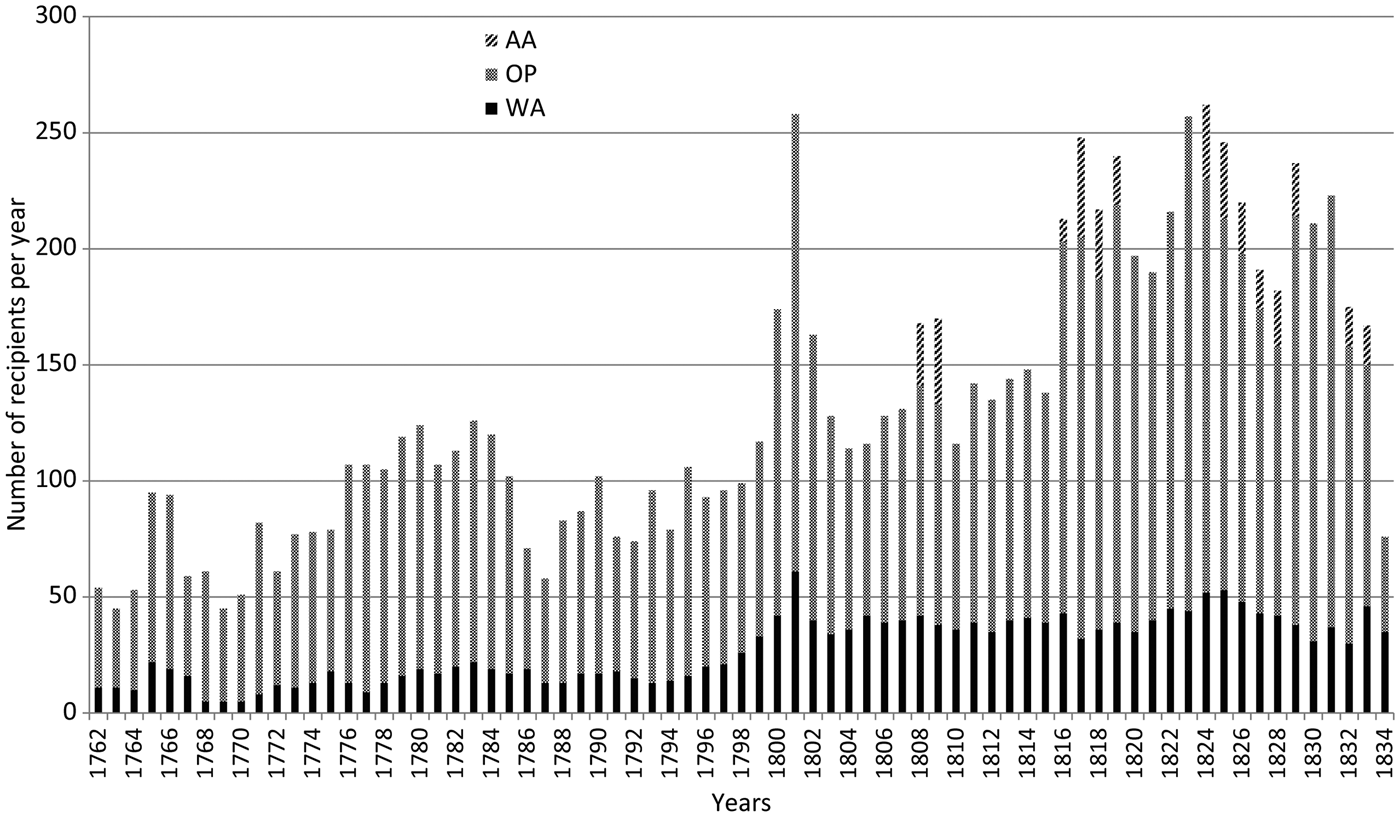
This evidence supports David Eastwood's contention that a fundamental shift occurred in the extent and patterns of poor relief after 1795.Footnote 51 In Terling, during the crisis years 1795–1801 and again between 1815 and 1818 relief bills and relief rolls ballooned, because increasing sums of money were paid to a larger number of people in more weeks each year.
4. WHO WERE THE POOR?
This secular deterioration provides the background for a more detailed examination of the potential role of poor relief within household economies, particularly in the period after 1795.Footnote 52 The recording practices in Terling made this task easier. In addition to recording census returns in the parish accounts in 1801 and 1811 (plus an informal parish census of 1809), the overseers also surveyed the resident family units of those in receipt of relief in 1801, 1803, 1809 and 1811.Footnote 53 In doing so, they recorded the composition of the resident family members, including ages, state of health (1801) and the number of children still at home.Footnote 54 They also required relief recipients to report their earnings, and distinguished between those of men, women and children, as well as allowances received from the parish.
This information provides a preliminary definition of the notion of ‘dependence’ in the village. The 1801 listing recorded 69 family groups, comprising 250 individuals. This represented 42 per cent of the 168 family units listed in the 1801 parish census, and 35 per cent of the 708 inhabitants.Footnote 55 In fact, as Sokoll has observed, such a snapshot measure under-records the total number of inhabitants exposed to poor relief within Terling.Footnote 56 Over time, 94 families (55 per cent) in the 1801 Census, comprising as many as 367 individuals (52 per cent), received some kind of parish relief.
Of the 69 pauper families listed in 1801, 15 were headed by women (21 per cent), mostly widows, 7 of whom were aged over 60 years. The 54 male-headed family units reflected a broader age range. In all, 4 were headed by men aged under 30 years, 20 by men aged between 30 and 40 years, 6 by men aged 40 to 50 years, 5 by men in their fifties, and 19 by men aged over 60 years. The proportion over 60 years old (38 per cent) was in line with the average of 34 per cent given by Ottaway for southern and eastern England.Footnote 57 This relatively wide spread of ages among male householders hints at the new situation in the parish after 1795, in which a majority of regular male recipients were able-bodied wage-earners, whose poverty was a result of changing economic circumstances rather than personal misfortune. In fact, only 2 out of the 35 male householders aged below 60 years were recorded as not being in ‘good’ health. By contrast, only 4 out of the 19 aged over 60 years old enjoyed such ‘good’ health.
Similarly, in 1801, although some pauper families were big, their mean size was little different from that of the entire parish, unlike in Ardleigh.Footnote 58 In 1801, the mean size of the 94 units who had, or would, receive relief was 4.3 (with a median of 4), while for the 74 families who never received relief it was 4.9 (median also of 4). The difference was probably caused by a lower number of resident adolescent children in recipients’ families. In the pauper list of 1801 no resident child was over 15 years old.Footnote 59 These figures were somewhat lower than in 1778, when Ottaway found that male-headed pauper households had 5.4 residents and female-headed households had 5.1. Perhaps adolescent children were being bound out to service more systematically in 1801, as Sokoll suggests in Ardleigh.Footnote 60
The 1801 listing also detailed earnings per household, including casual earnings by women and children, a practice repeated in 1803, 1809 and 1811. Obviously, there was an incentive to understate earnings. However, given that at least 66 out of the 94 pauper family units in 1801 (70 per cent) were employed in ‘husbandry’ by the farmers who made up the parish ‘committee’, the overseers could easily have checked these stated earnings.
Such considerations are important, because the figures reported in the 1801 pauper list appear relatively high, compared with other estimates for the county. The figures were gathered in January, so should not be distorted by harvest bonuses.Footnote 61 Among male householders aged 22–39 years old, mean weekly earnings were 9.58 shillings per head, and mean total household income per week was 11.9 shillings, compared with T. L. Richardson's findings of a mean of 8 shillings 8 pence for agricultural labourers in Essex in 1801.Footnote 62 Among men aged between 40 and 59 years old the figures were 10.1 shillings earnings and 13.1 shillings per week household income. This suggests that labourers achieving total household income levels in excess of county means were still in need of income supplements from the parish.Footnote 63 These high male wage rates echo the conclusions of Keith Snell, Sara Horrell and Jane Humphries, and Joyce Burnette that over the same period employment opportunities and wages were increasingly concentrated on the male ‘breadwinner’.Footnote 64 This may not fully have compensated for the corresponding reduction in women's and children's earnings, in the absence of by-employments such as straw-plaiting, stocking-knitting or spinning in mid-Essex.Footnote 65
The survey suggested that poor relief comprised only a small percentage of household income, making up only 9 per cent of income for households headed by men aged 22–39 years old (the same contribution as women's and children's earnings), and only 2 per cent for those headed by men aged 40–59 years old (compared with 13.5 per cent from women's and children's earnings). Relief was more significant among households headed by men aged over 60 years old, but still comprised only 27 per cent of total household income, similar to proportions in Campton and Shefford.Footnote 66 Even among this group male earnings made up 63 per cent of total income. In 1809, relief was still relatively marginal to the total household incomes of working-age men. Male householders aged 30–39 years old received only 5 per cent of their income in relief payments, while those aged 40–59 years old received only 10 per cent of their income in relief, compared with 18 per cent from women's and children's earnings. By contrast those aged over 65 years old now received 75 per cent of their income in relief payments, closer to the 90 per cent of ‘minimum wages’ observed by Ottaway among recipients of formal weekly ‘pensions’ in Terling, 1770–1794.Footnote 67
Women's and children's earnings in family units headed by men in 1801 amounted to only 1.8 shillings per unit in the 25 families (out of 55) in which they were recorded – or 16 per cent of total household income, in line with Nicola Verdon's findings for Essex in the period.Footnote 68 The situation was even bleaker in 1809. Even for women of working age (aged 30–59 years old), earnings made up only 7 per cent of their total household income. Children added another 10 per cent, but the remaining 83 per cent came from the parish, in line with the findings of Keith Snell and Jane Millar.Footnote 69 Only the contribution of children lifted these women out of the same plight as those aged in their sixties and seventies, who received 93 per cent of their household income from the parish.
Given these findings, how should we begin to define ‘dependence’ on poor relief? The outer parameters seem fairly clear. Female-headed households who derived 80 or 90 per cent of their income from poor relief were clearly dependent on the parish for their basic daily subsistence. Their situation was fundamentally different from that of households headed by men aged less than 60 years old, where relief provided less than 10 per cent of household income. However, we should perhaps distinguish between dependence (poor relief as the largest single source of subsistence) from reliance (poor relief as a significant and recurrent, but not sufficient, component of household income). Dependence and reliance can only be reconstructed through a dynamic rather than a static analysis, which assesses how often (as well as how much) relief was received in each year. The dataset enables this analysis to be taken further than in previous studies, because it allows us to calculate the precise number of weeks in which relief was received, by every recipient across the period 1762–1834. The patterns revealed also imply a deeper reshaping of household economies, particularly a loss of resilience (through declines in the value of alternative sources of income, from women and children), and the devotion of an increasing proportion of the weekly wage to food.
5. RECIPIENTS AND THE LIFE COURSE: 1775, 1801 AND 1810
We can obtain a more detailed understanding of these dynamics by examining three listings of inhabitants or relief recipients, for whom more detailed age and life-course information is available. The first, taken in 1775, lists 93 family groups, plus 14 families being relieved in outlying parishes and 4 fractured families in the workhouse.Footnote 70 Of these, 126 women and 108 men can be identified in the database, and baptism dates attributed to them. The second is the 1801 listing discussed above.Footnote 71 The third incorporates all those who received relief in the database in 1810, cross-referenced with listings of family groups taken on 4 February 1809 and 4 May 1811.Footnote 72 It includes the baptism dates of 40 women and girls, and 56 men and boys, of whom 72 can be identified in family groups.
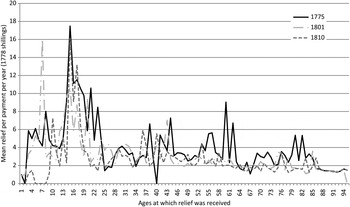
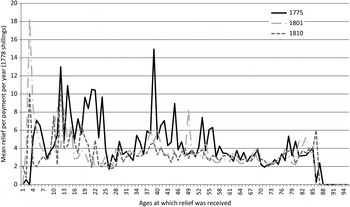
This additional information allows us to examine the relative value and intensity of relief for recipients from across the age spectrum among these three groups. Figures 3 and 4 illustrate the mean values for women and men in the 1775, 1801 and 1810 groups of each individual payment received by each person in each year between 1770 and 1835. These means have been distributed across the age range in each year, and controlled for the effects of inflation. While they follow the classic Seebohm Rowntree profile of increased expenditure in late adolescence, they also support George Boyer's argument that the real value of per capita relief did not increase in southern England during the later eighteenth and early nineteenth centuries, contrary to Baugh's findings.Footnote 73 If anything, the real per capita value of each payment declined slightly between 1775 and 1810, and tended to remain between 3 shillings and 4 shillings – that is, at approximately 25 per cent of total household income.Footnote 74 Although total relief bills increased enormously this was not because relief was being paid out to individual recipients in larger amounts.
Terling 1770–1834: mean amount of relief per payment per person per year at constant 1778 prices (shillings) according to age for women in 1775, 1801 and 1810 listings. Source: Essex Record Office, Terling Overseers’ Disbursements, 1762–1834.

Terling 1770–1834: mean amount of relief per payment per person per year at constant 1778 prices (shillings) according to age for men in 1775, 1801 and 1810 listings. Source: Essex Record Office, Terling Overseers’ Disbursements, 1762–1834.

Consideration of the proportion of the total sums paid to different age categories of women and men in the 1775, 1801 and 1810 groups reveals several changes over time. First, as Ottaway found, until the mid-1790s women in all three groups tended to receive a higher proportion of the value of poor relief than did men.Footnote 75 The total proportion of relief allocated to women peaked in the period 1790–1804, whereas for men the peak came between 1805 and 1820. After 1800 female recipients never received a greater proportion of the value of relief than men. Women may have sought relief more often between 1794 and 1800 because their earnings suffered more than men's in the first round of wartime inflation, possibly because men and boys took on their tasks as real wage costs fell. This shift might have been exacerbated after 1800 if payments to women were increasingly subsumed within ‘household’ relief payments to men.
Even so, between 1800 and 1825 the largest share of the value of relief clearly went to working-age men, aged 25–44 and 45–59 years old. Relief was paid to these men primarily in the form of occasional payments (income supplements) plus ‘additional allowance’ payments based on family size after 1808, rather than weekly pensions. As male householders in each of these groups reached old age in the 1820s and early 1830s, they received larger proportions of the total value of relief, whereas their female peers generally did not.
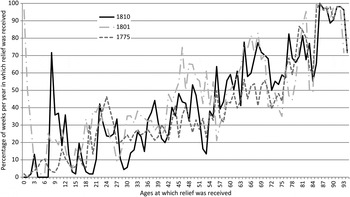
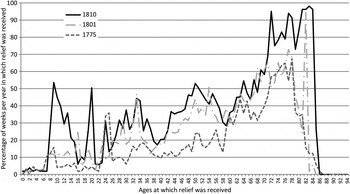
The cause of the rises in relief costs is suggested by one of the key findings of this research, shown in Figures 5 and 6. These depict the percentage of weeks per year in which relief was received by each age group. The contrast between the experiences of women and men is instructive. All other things being equal, we might expect the relief pattern for all recipients to match that of the women in these two groups. Figure 5 shows a relatively linear increase in the frequency of relief for women, from low levels of less than 5 weeks per annum before the mean age of first marriage (except for the spikes associated with leaving for service), to 10–15 weeks per annum in child-bearing years, to 20–25 weeks in later middle age, and 30–40 weeks per annum once over the age of 75 years old (the latter in line with Ottaway's findings).Footnote 76 The same pattern recurs among the other two groups, although adolescent girls in the 1810 group were much more likely to receive relief than their peers in the 1770s and 1780s, implying a diminution in either work opportunities or families’ capacity to equip them for service.
Terling 1762–1834: percentage of weeks per year in which relief was received according to age for women in 1775, 1801 and 1810 listings. Source: Essex Record Office, Terling Overseers’ Disbursements, 1762–1834.

Terling 1762–1834: percentage of weeks per year in which relief was received according to age for men in 1775, 1801 and 1810 listings. Source: Essex Record Office, Terling Overseers’ Disbursements, 1762–1834.

Significantly, the male recipients in Figure 6 contradict this relatively linear picture. The 1775 group illustrate a more expected trend, of relatively infrequent relief until the onset of illness and infirmity after the age of 60 years old, with rapid rises thereafter, to an earlier peak than for women – reflecting lower adult male life expectancy. The 1810 group follows the same overall trend, but with substantial increases in the frequency with which relief was received. The increases are most striking among working-age men, whose relief trajectory might have been expected to follow that of the 1775 group. Men aged 28 to 38 and 44 to 58 years old received relief in twice as many weeks as their peers in the earlier group, and about as often as women in the same group. Figure 6 also supports the 1809 income survey, by indicating that men over the age of 70 years old were now wholly excluded from the labour market in ways that had not been the case among the 1775 group.Footnote 77
Receiving relief for up to five weeks per annum cannot be equated with ‘dependence’, nor does it represent significant ‘reliance’. Instead, it is a short-term measure to plug a hole in the family finances. This appears to have been the character of relief for working-age men in Terling in the later eighteenth century. We might define ‘reliance’ on relief as the need to claim it for more than one-in-three, or one-in-two weeks per annum, so that it became a regular, unavoidable component of household budgets, even if it was not the primary source of subsistence. For men among the 1775 listing, this need was incurred after the age of 60 years old, and for women (particularly widows) after about the age of 45 years old. For men among the 1810 group, such reliance was reached in the same age range as for women, and even occurred in their late twenties, the age at which their daily labour capacity must surely have been at its maximum. Such men were not receiving more relief per payment in each age range, but they were now receiving twice as many payments per annum than the previous generation.
6. BETWEEN ‘RELIANCE’ AND ‘DEPENDENCE’
If the total income of a male-headed household after 1800 in Terling was approximately 12 shillings per week, what levels of relief indicate ‘reliance’ and ‘dependence’? We can draw arbitrary distinctions at the levels of 4 shillings per payment per person, and 8 shillings. The long-term, inflation-adjusted mean figure of 4 shillings per payment equates to a quarter of this weekly income for male households, but perhaps half the income allocated to large female-headed households, and more than the maximum normally allowed to lone males or females. A figure of 8 shillings per payment equates to 50–75 per cent of male-headed total household income, and the maximum normally allocated to larger female-headed households. If sustained over 10 or 20 weeks per annum, the former sum implies ‘reliance’ on relief for a regular, substantial portion of household income, while the latter suggests significant dependence.
There were significant trends in the distribution of the total value of payments above 4 shillings per week to recipients of different ages within these three recipient groups. The distribution of the total value of payments over 8 shillings per week follows a pattern illustrated by Sokoll in Braintree, because it suggests that those aged under 25 years old tended to receive the biggest share of the value of these payments, rather than middle-aged men and women with families.Footnote 78 In Terling, payments for adolescents were often inflated by clothing costs, and ‘boarding out’ payments incorporating subsistence. The value of payments to men in middle age increased after 1800, reflecting wartime inflation and the gradual ageing of the sample groups. By contrast, throughout the period, adult women rarely received payments equivalent to more than 50 per cent of the adult male wage, except for one-off costs such as clothing or medical bills.
Men aged over 45 years old absorbed the largest proportion of the value of payments of 4–8 shillings per week after 1800, particularly those recipients listed in 1801 and 1810. Again, this distribution may reflect both the gradual increase in the mean age of the sample over time, and also the crowding-out of older workers in an over-stocked rural labour market after 1815. This is more noticeable, because it does not occur among female recipients, whose share of the value of these payments dropped significantly in the years after 1800. Again, this highlights a wider shift of payments away from women in the 22–59 years old age range and towards men of the same age. While this may reflect growing dominance of the idea of the male ‘breadwinner’, it might also reflect changes in the patterns of need created by falling real wage levels.
Relief payments proliferated among labouring families in Terling not as a substitute for wages, but rather as a less dramatic supplement to household incomes. The pressure on household incomes came not from dramatic shifts, but from the slow and inexorable increases in the proportion of relief paid at 4–8 shillings per week to male household heads aged 45–59 and 60–74 years old. Among recipients in the 1775 group, approximately 10 per cent of the value of such payments had gone to these two age groups between 1770 and 1794. Between 1800 and 1820 the proportion was 40–50 per cent. Among the 1801 group, the proportions were closer to 70 per cent between 1820 and 1834, and were similar among the 1810 group. Some of these increases reflected the ageing sample groups, but they also demonstrate that poor relief was becoming an increasingly indispensable and unavoidable part of their household budgets.
7. INCREASING DEPENDENCE AMONG FEMALE-HEADED HOUSEHOLDS, 1795–1805
We can get a better sense of some of the reasons for these shifts, and the place of relief within labourers’ household economies, by focusing in detail on one of our three sample groups, the 1801 pauper listing. This group was recorded mid-way across the time period, allowing us to observe its fortunes for equal lengths of time back to 1762 and on towards 1834. It also experienced the brunt of the price rises after 1794 and was still economically active in the difficult decade after 1815. Consequently, this group provides a valuable case study of the relief history of a particularly vulnerable population.
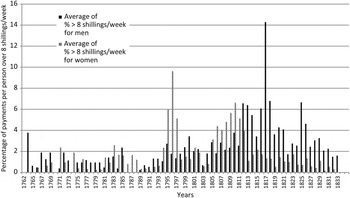
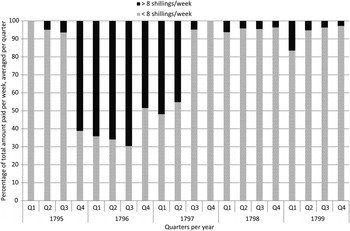
Figure 7 applies the 8 shillings per week threshold to women and men in the 1801 pauper list and reveals a sharp distinction between their experiences over time. For women, the peaks in relief came earlier, after the first price shock in 1794 and again in 1801. For men, the highest frequency of relief at this level was in the post-war slump after 1815, as in Campton and Shefford and most of southern England.Footnote 79Figure 8 illustrates the 1790s in greater detail. It shows that between the autumn of 1794 and the summer of 1797 half the payments to women in this group were at, or above, 8 shillings per week. By contrast, in the subsequent two years almost all payments were below this threshold. Much of the increase in these payments came from a larger amount of money being paid to widows in the form of additional ‘occasional payments’, with the largest increases being incurred for ‘general allowances’ to this group. In the five years after 1794 the largest increase in relief payments to the 1801 pauper-list women was in the 40–59 and over-60 years old age groups. In fact, the short-term ‘emergency’ occasional payments which began in the autumn of 1794 and spring of 1795 were eventually translated into increases in ‘weekly allowances’ by the winter of 1796–1797.
Terling 1762–1833: percentage distribution of payments per annum for all men and women listed in the 1801 pauper census (n = 194), averaging over 8 shillings per week. Source: Essex Record Office, Terling Overseers’ Disbursements, 1762–1834.

Terling 1795–1799: proportion of payments above and below 8 shillings per week paid to female recipients in the 1801 pauper listing (n = 34). Source: Essex Record Office, Terling Overseers’ Disbursements, 1762–1834.

The crisis was also felt particularly acutely by widows such Hannah Tyrrell, whose husband John died in the spring of 1796, when Hannah was aged 40 years old, with four children under 11 years of age. Although she was in good health in 1801, her earnings amounted to only 3 shillings per week, and she received 8 to 9 shillings per week in relief in 1796, settling at 7 shillings per week after June 1797. Her subsequent history is instructive, because it indicates the significance of these sums. ‘Widow Tyrrell’ continued to receive weekly allowances every year until 1829 (for more than 45 weeks per year in each year), and occasional relief until her death in 1831. Until September 1802, she received 6 shillings 6 pence per week, which was then reduced to 4 shillings 6 pence, and then to 3 shillings 6 pence per week in April 1803. In that year, three of her six children resided with her, undertaking husbandry tasks and earning 2 shillings per week, which supplemented the 1 shilling 2 pence she earned by weeding.Footnote 80 This gave the four of them a combined weekly income of 6 shillings 8 pence, equivalent to the sums she had received before 1802, when her son John (born in 1795), and possibly her twin daughters Hannah and Rhoda (born in 1791), were too young to work.
Until September 1807, Hannah continued to receive 3 shillings per week, falling in stages to 1 shilling 6 pence after April 1809. That year, 14-year-old John Tyrrell was still living with his mother, and was earning 3 shillings 6 pence per week.Footnote 81 Hannah was not recorded as having any earnings, but was paid a 3 pence per week supplement because of the prevailing high prices, giving them a total weekly income of 5 shillings 3 pence. Hannah continued to receive 1 shilling 6 pence per week until December 1817, presumably because (as in May 1811) she was able to earn an additional 2 shillings per week in husbandry.Footnote 82 Thereafter, at the age of 61 years, Hannah received between 2 shillings 6 pence and 3 shillings per week each week until 1829, which probably represented her sole source of income. The payments to other widows, without resident children, support these assumptions.Footnote 83
This trend may indicate that female householders, whose incomes in 1801 averaged only 3.1 shillings per week, were the most vulnerable to the first wave of price increases after the autumn of 1794. For women in middle age with dependent children, or over 60 years old and in ‘indifferent’ health in 1801, this price shock may have changed their relationship with the poor relief system from one of marginal need (particularly for more expensive items of clothing), plus periods of intermittent dependence (during illness), to more persistent reliance on pensions or supplements – albeit, not outright dependence – until the onset of old age. Where this most marginal income group led, much of the rest of the village's male labouring population followed.
8. INCREASES IN PAYMENTS TO ABLE-BODIED MEN, 1815–1819
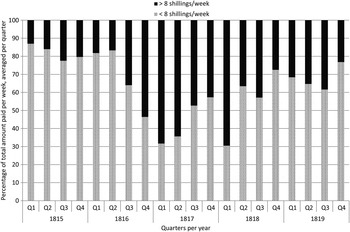
Once again, Figure 9 focuses in detail on the five-year period in which large payments to men were most pronounced, between 1815 and 1819. It is clear that there was a prolonged rise in the number of payments to male recipients in the 1801 pauper listing between the autumn of 1815 and the spring of 1818. From the summer of 1816 to the spring of 1818, the group received at least half of the value of their relief in payments of 8 shillings or more. In the winter of 1817–1818, between a third and a half of the value of these payments were for sums of 12 shillings per recipient per week. In fact, this 1801 group regularly received 25 to 30 per cent of all payments in excess of 8 shillings per week in this period, despite comprising only 14 per cent of all recipients in this period.
Terling 1815–1819: proportion of payments above and below 8 shillings per week paid to male recipients in the 1801 pauper listing (n = 46). Source: Essex Record Office, Terling Overseers’ Disbursements, 1762–1834.

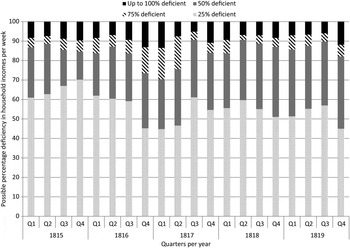
These sums imply that all these men were either completely without work or able to earn less than half their normal income between the autumn of 1816 and the spring of 1818.Footnote 84 More speculatively, Figure 10 implies that if relief payments of 8 shillings per week to adult males indicate an income deficiency of 75 per cent, and payments over 12 shillings suggest deficiencies close to 100 per cent, then the winter of 1816–1817 stands out as one in which as many as 20 per cent of all relieved family units in the village (not just the 1801 cohort) repeatedly required relief payments equivalent to 75 per cent of their weekly income, with half of all recipients requiring payments equivalent to 50 per cent of income. The former figure was perhaps double the usual level in the five-year period as a whole.
Terling 1815–1819: possible percentage of weeks per quarter in which household incomes were deficient among all recipients (n = 326). Source: Essex Record Office, Terling Overseers’ Disbursements, 1762–1834.

Many of these men were regular relief recipients throughout the period after 1801. Despite their relatively high wages, all were caught in Rowntree's mid-life ‘poverty trap’, created by large numbers of resident, non-wage-earning children. In 1815 Thomas Cole was 60, John Doe, 45, John Royce, 48, and James Valentine, 47 years old. All were recorded as ‘husbandmen’ (that is, waged agricultural labourers), but each had a family of 9 to 11 surviving children. Each earned between 12 and 15 shillings per week in 1811, which for Royce and Valentine was supplemented by income from women's and children's earnings of 2 shillings per week.Footnote 85 Their total household income, including relief (stated in each case as 2 shillings per week) was between 14 and 17 shillings per week. If sums of this size represent a ‘target’ for the total income necessary to support each family, the detailed relief histories of these able-bodied, working-age men allow us to determine whether this mid-life poverty trap was characterised by ‘reliance’ or ‘dependence’.
Two patterns are apparent. First, Cole, Doe and Royce all had periods of months or years in which they received regular relief amounting to approximately 25 or 50 per cent of their ‘target’ household income, but particularly in the periods 1800–1802, 1816–1820 and 1820–1824. Royce received relief equal to nearly half his ‘target’ income between 1800 and 1802 and to approximately a quarter over a period extending from 1805 to 1810. Cole experienced the most reliance, but at a relatively low level (approximately 20 to 25 per cent of ‘target’ income) in the periods 1799–1802, 1803–1813, 1816–1820, 1821–1829 and 1834–1835. Doe received approximately 25 per cent of ‘target’ income in relief between 1808 and 1815, but was much more dependent (at times for perhaps 75 per cent of his ‘target’ household income) between 1816 and 1820, and between 25 and 50 per cent of ‘target’ income from 1820 to 1825. Of the four, perhaps unsurprisingly, Cole had the most complicated family history. He had married John Royce's older sister Anne in 1784, and had fathered five children before her death in 1798 at which time only three (aged 13 years old, 8 years old and 1 year old) were living. Cole had remarried in 1803, and his second family eventually amounted to a further six children, the youngest born in 1816. This fractured history and extended reproductive span (of almost 30 years as opposed to 20 years for an unbroken family) may have left Cole's family more reliant on income supplements from the overseers.
Second, each household also required one-off payments that might match or even be far in excess of an individual week's income. Many of these peaks were associated with periods of illness. John Royce received 8 shillings 9 pence in January 1800, and 20 shillings 6 pence the following month, and sums of 10–12 shillings per week in three weeks in June 1812, between 9 shillings and 39 shillings in March 1814, and four weeks’ payment at 7 shillings per week, and 7 shillings 6 pence per week in August 1821 and February 1826. Thomas Cole received 33 shillings in November 1812, when it was noted that he was unable to work because of broken ribs. He was ill again in January 1818 and received between 15 shillings 6 pence and 17 shillings over four weeks. In December 1826 he required a truss to deal with a hernia, and the parish made six weekly payments in January and February 1827 of between 8 shillings and 9 shillings In the spring of 1832, the now elderly Cole was described as ‘very ill’ and received regular weekly payments of 5 shillings 6 pence.
For adult ‘breadwinners’, poor relief functioned primarily as an income supplement, even in years as difficult as those immediately after the Napoleonic wars. However, there were times when they had to draw on it to supply a full week's wage, generally when incapacitated by illness or injury. In Terling, at least, the sums provided by the overseers seem to have been paid at realistic replacement levels: 12–15 shillings, or more, for a family of five to seven members, 6–7 shillings for a family of three or four, and 4–5 shillings for an elderly husband and wife. These sums also support the general contention of Morgan Kelly and Cormac Ó Gráda that ‘expenditure per head tended to be higher in the high-wage parishes’.Footnote 86
The fact that such payments were needed implies that the larger labouring families in Terling lacked significant financial reserves. These four household heads had at least one decade in which they had five to seven mouths to feed. Normally, they had to resort to poor relief perhaps only once every couple of months, when family illness, or abnormal expenses, exceeded their weekly budgets. However, they seem to have coped by devoting all their income to immediate needs, and were unable to build up savings to deal with sudden shortfalls. It is clear that in relatively short-lived, but acute ‘crisis’ periods, such as 1794–1795, 1799–1801 or 1815–1817, many of these families may have become ‘dependent’ on the parish for the bulk of their income. At other times, they were much more likely than their parents or grandparents had been to receive ‘occasional’ relief from the parish in perhaps 10 to 20 weeks per year.
9. CONCLUSION
Clearly, in Terling between 1762 and 1834 there were substantial changes in the size and regularity of poor relief payments, and the profile of their recipients. These reflected a real, and appreciable, growth in ‘reliance’ on poor relief by a substantial section of the agrarian labour force. Even so, we can agree with Shave and Williams that the significance of these changes should not be exaggerated. The dramatic increases registered in Figure 1 reflect the fact that an average of just under 50 people required substantial relief for 30 weeks or more each year after 1810, compared with an average of 8 per annum who had such a need in the early 1770s. Similarly, except in the crisis years of 1794–1796, 1800–1801 and 1816–1818, most recipients received individual sums that amounted, at most, to perhaps only one-third or a half of adult male weekly earnings. The majority of recipients undoubtedly received sums that made a substantial contribution to their household budgets (of up to 6 or 7 shillings), but only for a week or two in each year.
As Williams has emphasised in Bedfordshire, most relief went to the same categories of recipients as it had always done: orphaned children, single-parent families, large and sickly families, those with chronic illnesses or disabling injuries, and the elderly who were no longer capable of work. Although the numbers in most of these categories increased over time and the sums expended rose substantially, this represented a simple intensification of the existing system.
However, the Terling evidence also qualifies Williams's conclusion that ‘the huge shift in welfare provisioning in favour of families, assumed as a given in the secondary literature, is simply not evident at the micro-level’.Footnote 87 Clearly, as Williams and Sokoll have shown, the welfare regime of every parish differed slightly, according to local needs and the ‘welfare cultures’ that emerged through the dialectic between ratepayers and recipients. Terling was more like Ardleigh than it was like Campton or Shefford, because the vestry favoured extensive occasional relief over intensive pension payments. Like Ardleigh, and unlike Braintree or the Bedfordshire parishes, it lacked much non-agricultural employment, and possessed few jobs for women and children.
Even so, the development of regular payments to able-bodied, working-age individuals and families was a new, and highly important, feature in the parish's relief system after 1795. The expansion in expenditure after 1800 was driven by profound but subtle changes in the frequency with which working-age families required relief. These had knock-on effects for existing groups of recipients, diminishing the proportions of relief paid to the elderly, and (above all) directly to women. While male householders only slipped into outright ‘dependence’ during acute familial or economic crises, they experienced a creeping ‘reliance’ on relief through ‘family allowances’, equivalent to 20–30 per cent of anticipated family income, for 10 or 20 weeks per year. For others, the need to devote more and more income to the purchase of food resulted in a greater intensity and value of ad hoc payments in each year. As in much of southern England, this pattern was at its most pronounced in the dreadful period between the autumn of 1815 and the autumn of 1817, when a deep but predictable post-war agrarian depression was amplified significantly by the consequences of freak climatic conditions experienced in 1816 (‘the year without a summer’). Then, the parish was forced into the unprecedented step of providing sums equivalent to 50–75 per cent of household income for perhaps half the families on relief.
If we take this period as the absolute nadir of dependence, then it represents the effects of persistent unemployment among perhaps 14 per cent of family groups, and 17 per cent of the population (that is, approximately 21 family heads, out of a total of 148 families in 1811, and 131 inhabitants out of a total of 759). This may have represented 20–25 per cent of the adult wage-earning population of the village at this time.Footnote 88 This was a real, and sharp, economic crisis, that exacerbated a situation in which perhaps 5–10 per cent of the household heads found themselves regularly, and significantly, short of funds at the end of each week.
This research supports the verdict of other local studies, and of Karel Williams, that the old Poor Law never became a comprehensive welfare system providing substantial long-term assistance to the working-age population of southern England after 1795. However, it also shows that the relative levels of dependency represented by payments to labouring families are less important than the absolute fact that relief was now being paid intermittently to working-age men, who had only ever received it in emergencies in the generation before 1795. This relatively undramatic redrawing of the boundaries of entitlement still resulted in a 230 per cent increase in the numbers of recipients, and a 300 per cent real-terms increase in relief bills between the 1770s and 1810s. As in other agricultural parishes, after the price shocks of the late 1790s the ratepayers of Terling preferred to substitute individual relief awards for a general increase in wage rates, despite their apparently high level.Footnote 89 Reliance on relief accumulated silently in Terling, without ever registering a ‘huge shift’, but it tipped the balance in the pattern of dependence nonetheless.
ACKNOWLEDGEMENTS
Research for this article was funded by a British Academy Small Grant SG091025. I am very grateful to Dr Bethanie Afton for assistance in transcribing Terling parish overseers’ rates and disbursements, 1745–1801, and to The Cambridge Group for Population and Social Structure (CAMPOP) for allowing me to consult their family reconstitution records for Terling, 1550–1850. Earlier versions of this article were presented at the British Agricultural History Society (BAHS) spring conference 2013, and at the 2nd European Rural History Organisation (EURHO) conference in Berne, 2013.