Implications
The knowledge on single nucleotide polymorphism (SNP) effects and/or candidate genes interactions of tick resistance with the environmental burden of this parasite under reaction norm approach can be used to increase selection accuracy across environments and to choose best sires for different tick burden in genomic selection evaluations of this Hereford/Braford population.
Introduction
The cattle tick is a parasite that adversely affects livestock performance in tropical areas. Different studies have shown that cattle breed has a major effect on the level of tick burden and it is stated that Bos indicus cattle are more resistant to ticks than Bos taurus (Prayaga and Henshall, Reference Prayaga and Henshall2005). Likewise, some reports indicated that crossbred cattle (B. taurus v. B. indicus) carried more than four times ticks than B. indicus, or still that pure zebu cattle (B. indicus) are less infested with ticks compared with zebu–taurine crosses (B. taurus v. B. indicus) under identical field conditions (Wambura et al., Reference Wambura, Gwakisa, Silayo and Rugaimukamu1998). Relationships among skin thickness, hair length, coat score and tick count (TC) have been evaluated in native and composite cattle breeds like Nguri and Bonsmara (Marufu et al., Reference Marufu, Qokweni, Chimonyo and Dzama2011).
The presence of genotype by environment interaction (G×E) can be important for beef cattle breeders as relative genetic merit will be environment-dependent. Although Brazil has provided genetic evaluations for tick resistance (Machado et al., Reference Machado, Azevedo, Teodoro, Pires, Peixoto, de Freitas, Prata, Furlong, da Silva and Guimarães2010; Cardoso et al., Reference Cardoso and Tempelman2015), these evaluations have not typically considered G×E. Despite genetic variation in response to environmental changes has been reported for economically important production traits (Cardoso and Tempelman, Reference Cardoso, Gomes, Sollero, Oliveira, Roso, Piccoli, Higa, Yokoo, Caetano and Aguilar2012; Silva et al., Reference Silva-García, Valdez-Alarcón and Baizabal-Aguirre2014) and complex traits (Mota et al., Reference Mota, Lopes, Tempelman, Silva, Aguilar, Gomes and Cardoso2016a and Reference Mota, Tempelman, Lopes, Aguilar, Silva and Cardoso2016b), this is still neglected.
In genome-wide selection (GWS), marker by environment interactions can be used to identify and utilize G×E (Silva et al., Reference Silva-García, Valdez-Alarcón and Baizabal-Aguirre2014) in order to improve the accuracy of genomic-estimated breeding values for important traits over environments. However, markers effects or genetic variance explained are commonly estimated as the same across environments. In a recent study, Mota et al. (Reference Mota, Lopes, Tempelman, Silva, Aguilar, Gomes and Cardoso2016a) reported that genomic reaction norms might be an important tool to verify marker by environments interactions for tick resistance of Hereford and Braford cattle under GWS. These authors observed negative correlations between extreme (high and low tick burden) environments suggesting substantial G×E.
Nevertheless, genomic reaction norms can also be exploited to genetically characterize complex phenotypes candidate genes identification in proximity or linkage disequilibrium (LD) with markers across environments via genome-wide association studies (GWAS). Investigations of candidate genes have been reported for tick resistance for crossbred dairy cattle (Holstein×Gyr), on chromosomes 2, 3, 5, 7, 10, 11, 14, 23 and 27 (Gasparin et al., Reference Gasparin, Miyata, Coutinho, Martinez, Teodoro, Furlong, Machado, Silva, Sonstegard and Regitano2007; Machado et al., Reference Machado, Azevedo, Teodoro, Pires, Peixoto, de Freitas, Prata, Furlong, da Silva and Guimarães2010), and beef cattle populations, on BTA 1, 2, 3, 5, 6, 7, 8, 10, 11, 12, 14, 15, 17, 18, 19, 23 and 27 (Porto Neto et al., Reference Porto Neto, Bunch, Harrison, Prayaga and Barendse2011a and Reference Porto-Neto, Sonstegard, Liu, Bickhart, Da Silva, Machado, Utsunomiya, Garcia, Gondro and Van Tassell2012; Mapholi et al., Reference Mapholi, Maiwashe, Matika, Riggio, Bishop, MacNeil, Banga, Taylor and Dzama2016), with different biological functions such as immune response. Gasparin et al. (Reference Gasparin, Miyata, Coutinho, Martinez, Teodoro, Furlong, Machado, Silva, Sonstegard and Regitano2007) and Machado et al. (Reference Machado, Azevedo, Teodoro, Pires, Peixoto, de Freitas, Prata, Furlong, da Silva and Guimarães2010) working on a quantitative trait loci (QTL) mapping study reported QTL genomic regions controlling tick resistance and dependent upon the season ticks were counted. However, the genetic mechanism for tick resistance is not well established and the identification of candidate genes, useful for genomic selection application in commercial herds, needs to be more conclusive.
To our knowledge, despite the SNP availability and several GWAS reports for tick resistance (Porto Neto et al., Reference Porto Neto, Jonsson, Michael and Barendse2010, Reference Porto Neto, Bunch, Harrison, Prayaga and Barendse2011a, Reference Porto Neto, Jonsson, Ingham, Bunch, Harrison and Barendse2011b and Reference Porto-Neto, Sonstegard, Liu, Bickhart, Da Silva, Machado, Utsunomiya, Garcia, Gondro and Van Tassell2012), the use of this source of information in G×E context remains unexplored. So far, there are no reports of candidate gene mapping studies under a genomic reaction norms framework in beef cattle. Toward this orientation, we aimed at identifying putative chromosomal regions and candidate genes associated with tick burden in Hereford and Braford cattle via genomic reaction norms.
Material and methods
Experimental procedures were approved by the Committee for Ethics in Animal Experimentation from the Federal University of Pelotas (Pelotas – RS, Brazil; Process number 6849).
Phenotypic, genotypic and pedigree data
Phenotypic data included 10 673 TCs on 928 Hereford and 3435 Braford cattle. A subset of 3545 was genotyped with the Illumina BovineSNP50 BeadChip (50 K; Illumina, San Diego, CA, USA). Pedigree information was highly incomplete due to use of multiple-sire matings, that is, 65% of unknown paternity. When the true sire was not identified via Mendelian conflicts (Wiggans et al., Reference Wiggans, Sonstegard, VanRaden, Matukumalli, Schnabel, Taylor, Schenkel and Van Tassell2009), pedigree was reconstructed by creating ‘virtual’ ancestor for each identified half-sib family within multiple-sire groups and based on genomic relationships for the genotyped animals (Fernández and Toro, Reference Fernández and Toro2006). A total of 12 754 animals remained after pedigree reconstruction and pruning. Detailed phenotypic, genotypic and pedigree information were reported in our previous pedigree-based work (Mota et al., Reference Mota, Lopes, Tempelman, Silva, Aguilar, Gomes and Cardoso2016a).
Contemporary groups (CG) were defined as a group of animals belonging the same herd, birth year and season (April to July; August to November and December to March), of the same sex and from the same management group. Following Mota et al. (Reference Mota, Tempelman, Lopes, Aguilar, Silva and Cardoso2016b), CG means were set as environmental parameters because they are the appropriate entities to describe the environmental gradient in terms of cattle tick burden.
Statistical modeling and Bayesian inference
We fitted our best one-step genomic reaction norm model for tick resistance from a previous study (Mota et al., Reference Mota, Tempelman, Lopes, Aguilar, Silva and Cardoso2016b). Markov chain Monte Carlo was implemented using INTERGEN software (https://www.embrapa.br/pecuaria-sul), and by saving every 10th cycle from a total of 1 000 000, after 100 000 of burn-in (n=90 000 cycles). Further details referring to statistical modeling and Bayesian inference applied in this study can be found in Mota et al. (Reference Mota, Lopes, Tempelman, Silva, Aguilar, Gomes and Cardoso2016a and Reference Mota, Tempelman, Lopes, Aguilar, Silva and Cardoso2016b).
Derivation of single nucleotide polymorphism effects from predicted breeding values
Suppose that we can write
 ${\bf a}\,{\equals}\,[ {{\bf a}_{{\bf n}}\,{\!}' { & { \vdots \,{\bf{ }} {\bf a}_{{\bf g}}\, {\!}'} \cr } } \right]'$
where a
g
pertains to breeding values for genotyped animals and a
n
pertains to breeding values of non-genotyped animals following Wang et al. (Reference Wang, Misztal, Aguilar, Legarra and Muir2012). We can similarly identify b as
 $${\bf b}\,{\equals}\,[ {{\bf b}_{{\bf n}}\,{\!}' { & { \vdots \,{\bf{ }} {\bf b}_{{\bf g}} \,{\!}'} \cr } } \right]'$$
it could be readily demonstrated that the equation used to solve the SNP intercept effect estimates is
 $ {\bf {{\vskip -3.4pt \hat} {\hskip -2.2pt u}}}_{{\bf 0}} \,{\equals}\,{\bf Z}^{'} {\bf [ZZ}^{{\bf '}} {\bf ]}^{{{\minus}1}} {\bf \,\,{{\vskip -3.5pt \hat}{\hskip -2.2pt a}}_{{\bf g}} $
,whereas the equation used to solve the SNP-specific slope or reaction norm effects can be demonstrated to be
 $${\bf \,\,{{\vskip -3.5pt \hat} {\hskip -2.2pt u}}}_{1} {\equals}\,{\bf Z}^{'} [{\bf ZZ}^{'} ]^{{{\minus}1}} {\bf {\vskip 0pt \hat{\hskip 2.5ptb}}_{{\bf g}} .$$
This is the best predictor of SNP effects in animals being Z is the matrix containing marker information. Hence, it is possible to determine a vector of SNP effect estimates (
 $${\bf \,\,{{\vskip -3.5pt \hat} {\hskip -2.2pt u}}}_{\bf w} } \right)$$
for each environment (w) as follows:
 $${\bf {{\vskip -3.7pt \hat} {\hskip -2pt u}}}_{{\left( {\bf w} \right)}} {\bf \,{\equals}\,\,{{\vskip -3.5pt \hat} {\hskip -2.2pt u}}_{{\bf 0}} {\bf {\plus}w\,\,{{\vskip -3.5pt \hat} {\hskip -2.2pt u}}}_{{\bf 1}} $$
To verify the SNP effects pattern across environments, we followed Silva et al. (Reference Silva-García, Valdez-Alarcón and Baizabal-Aguirre2014) and Verardo et al. (Reference Verardo, Lopes, Wijga, Madsen, Silva, Groenen, Knol, Lopes and Guimarães2016) and also identified top 1% SNPs (n=410) presenting greatest effects (both directions) across tick burden. The number of shared SNPs across environments was used to reflect the similarity of SNP associations.
However, these studies basically assumed SNPs with highest effects. This is a simple statistics useful to verify SNP environment interactions, but that might be avoided for gene detection, and consequently their functionality. Utsunomiya et al. (Reference Utsunomiya, Carmo, Neves, Carvalheiro, Matos, Zavarez, Ito, O’Brien, Sölkner and Porto-Neto2014) presented a more reliable statistics to detect what they called ‘outliers SNPs.’ This is based on interquartile range over the percentage of genetic variance explained.
We applied the following formula:
 $${\rm \,\%\,var\,{\equals}\,12}{\times}{\rm IQR{\plus}Q}_{{\rm 3}} $$
here %var is the percentage of genetic variance explained by each SNP; IQR is the interquartile range and Q3 the third quartile of the distribution. Note that, we use the value 12 instead of 5 as in Utsunomiya et al. (Reference Utsunomiya, Carmo, Neves, Carvalheiro, Matos, Zavarez, Ito, O’Brien, Sölkner and Porto-Neto2014) due to asymmetric genetic variance explained distribution (Supplementary Figure S1). The phenotypic/genetic variance explained by a single marker or windows of adjacent SNPs have been widely used as a criterion to identify candidates genes in single-step genome-wide association studies (ssGWAS) (Lemos et al., Reference Lemos, Chiaia, Berton, Feitosa, Aboujaoud, Camargo, Pereira, Albuquerque, Ferrinho and Mueller2016; Melo et al., Reference Melo, Takada, Baldi, Oliveira, Dias, Neves, Schenkel, Albuquerque and Carvalheiro2016; Valente et al., Reference Valente, Baldi, Sant’Anna, Albuquerque and da Costa2016; Zhang et al., Reference Zhang, Lourenco, Aguilar, Legarra and Misztal2016). The main reason is because there are no robust tests for SNP significance in ssGWAS.
The 50 K SNP panel data from Hereford and Braford cattle were pooled into a single-reference population for performing SNP effects and genetic variance explained across environments. This was assumed due to the genetic similarity between breeds. Braford animals are composites with a contribution of 62.5% of the Hereford breed as reported in a previous work on the same population (Biegelmeyer et al., Reference Biegelmeyer, Gulias-Gomes, Caetano, Steibel and Cardoso2016). These authors observed that the phase correlation estimates indicated that markers in LD at distances lower than 50 Kb in Hereford show quite similar levels of LD in Braford. Therefore, high proportion of these SNPs shares the same linkage phase. Another reason to not perform SNP effects or genetic variance explained per breed is the larger number of Braford (n=3435) compared with Hereford (n=928), which may accommodate differences in LD since Hereford are expected to contribute with 5/8 (62.5%) of Braford genome.
Gene mapping and overrepresentation analysis (ORA)
In order to provide gene identity and function mapped information, outliers or significant SNPs across low (LTI), medium (MTI) and high (HTI) tick burden environments represented, respectively, by 10th, 50th and 90th percentiles, were analyzed. To identify putative genes associated with the list of significant SNPs the package MAP2NCBI (Hanna and Riley, Reference Hanna and Riley2014) was used to generate a list of genomic features from the B. taurus (BUILD.6.1) genome. Furthermore, a Bioconductor package, that accesses and retrieves Ensembl data (Entrez IDs, Ensembl gene ID, HGNC symbols and more), R/BiomaRt, was used to download all genes (background genes) from B. taurus genome (ORG.MESH.BTA.DB), and map features within ±200 kb from the significant SNPs location. With this, in order to help interpreting the underlying genetic basis of tick resistance, the complete list of selected genes was used for enrichment analysis based on Medical Subject Headings (MeSH) vocabulary in Bioconductor retrieving statistically overrepresented annotations (Nelson et al., Reference Nelson, Schopen, Savage, Schulman and Arluk2004). By merging MeSH terms and Entrez Gene IDs from the background and selected list of genes, P-values (Morota et al., Reference Morota, Beissinger and Peñagaricano2016) were generated (Supplementary Table S1).
Results and discussion
Single nucleotide polymorphism by environment interaction
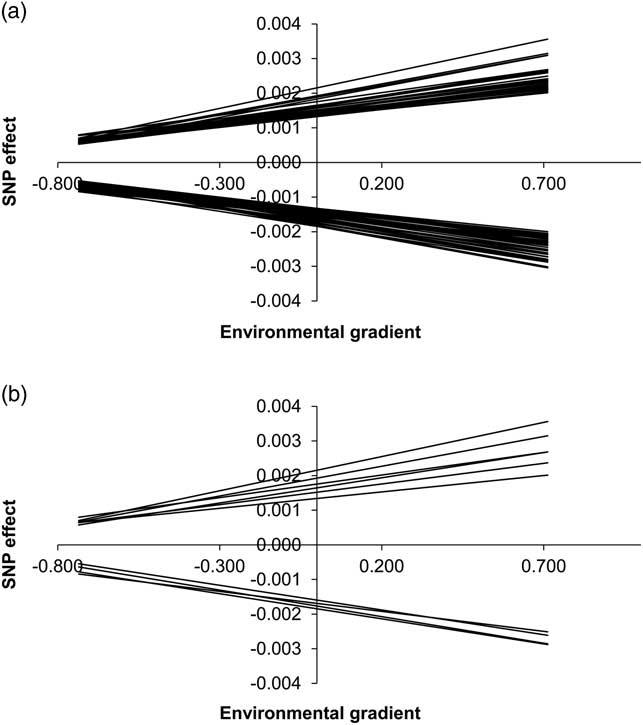
A total of 75 SNPs were consistently present across environments (Supplementary Table S2). Single nucleotide polymorphism effects estimated for these 75 consistent markers were plotted along the environmental gradient (Figure 1a). This figure indicates the presence of SNP by environment interaction due to an increase in SNP effect size in proportion to tick burden and SNP reaction norm line crossing across environments, especially in low tick burden. From these 75 SNPs, we also plotted the top 10 (Figure 1b), for better illustration. Although these 75 SNPs displayed relatively large effects at all levels, there were still changes in magnitude across environments, reinforcing the existence of SNP by environment interactions. A clear pattern was observed here: SNP effects increased as the tick burden increased regardless their magnitude and/or direction.
Single nucleotide polymorphism (SNP) effects for all (n=75) (a) and top 10 (b) consistent SNPs across tick burden.

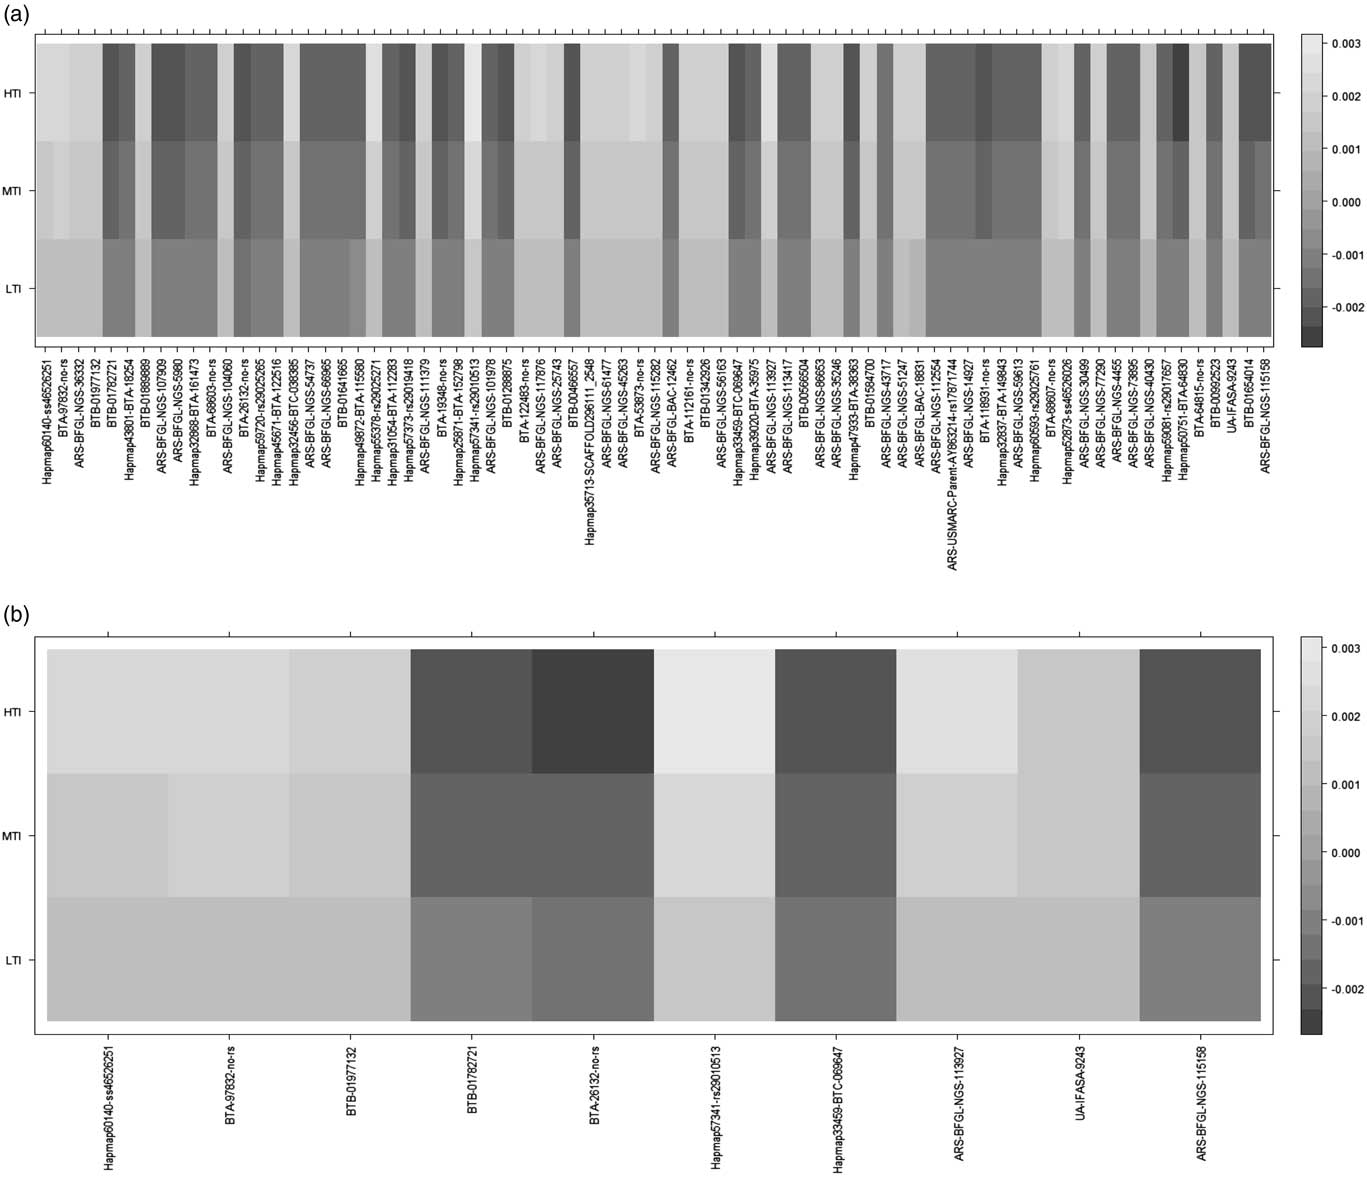
The Figure 1 also demonstrated that differences in SNP effects decreased in low tick burden, that is, SNP effects variation were greater at high level of tick resistance. It further indicates difficulty to identify superior breedstock in favorable conditions (low tick burden). To be clearer regarding marker effects varying across environments, Figure 2 presented effects for all (n=75; Figure 2a) and top 10 (Figure 2b) consistent SNPs over LTI, MTI and HTI. A trend that marker effects increase in magnitude as tick burden increases was noticeable. It implies that the identification of superior genetics for tick resistance requires exposure of animals to substantial environmental challenge (high tick burden).
Single nucleotide polymorphism (SNP) effects for all (n=75) (a) and top 10 (b) consistent SNPs at three different tick burden: low (LTI), medium (MTI) and high (HTI).

Chromosome regions affecting tick resistance and overrepresentation analysis
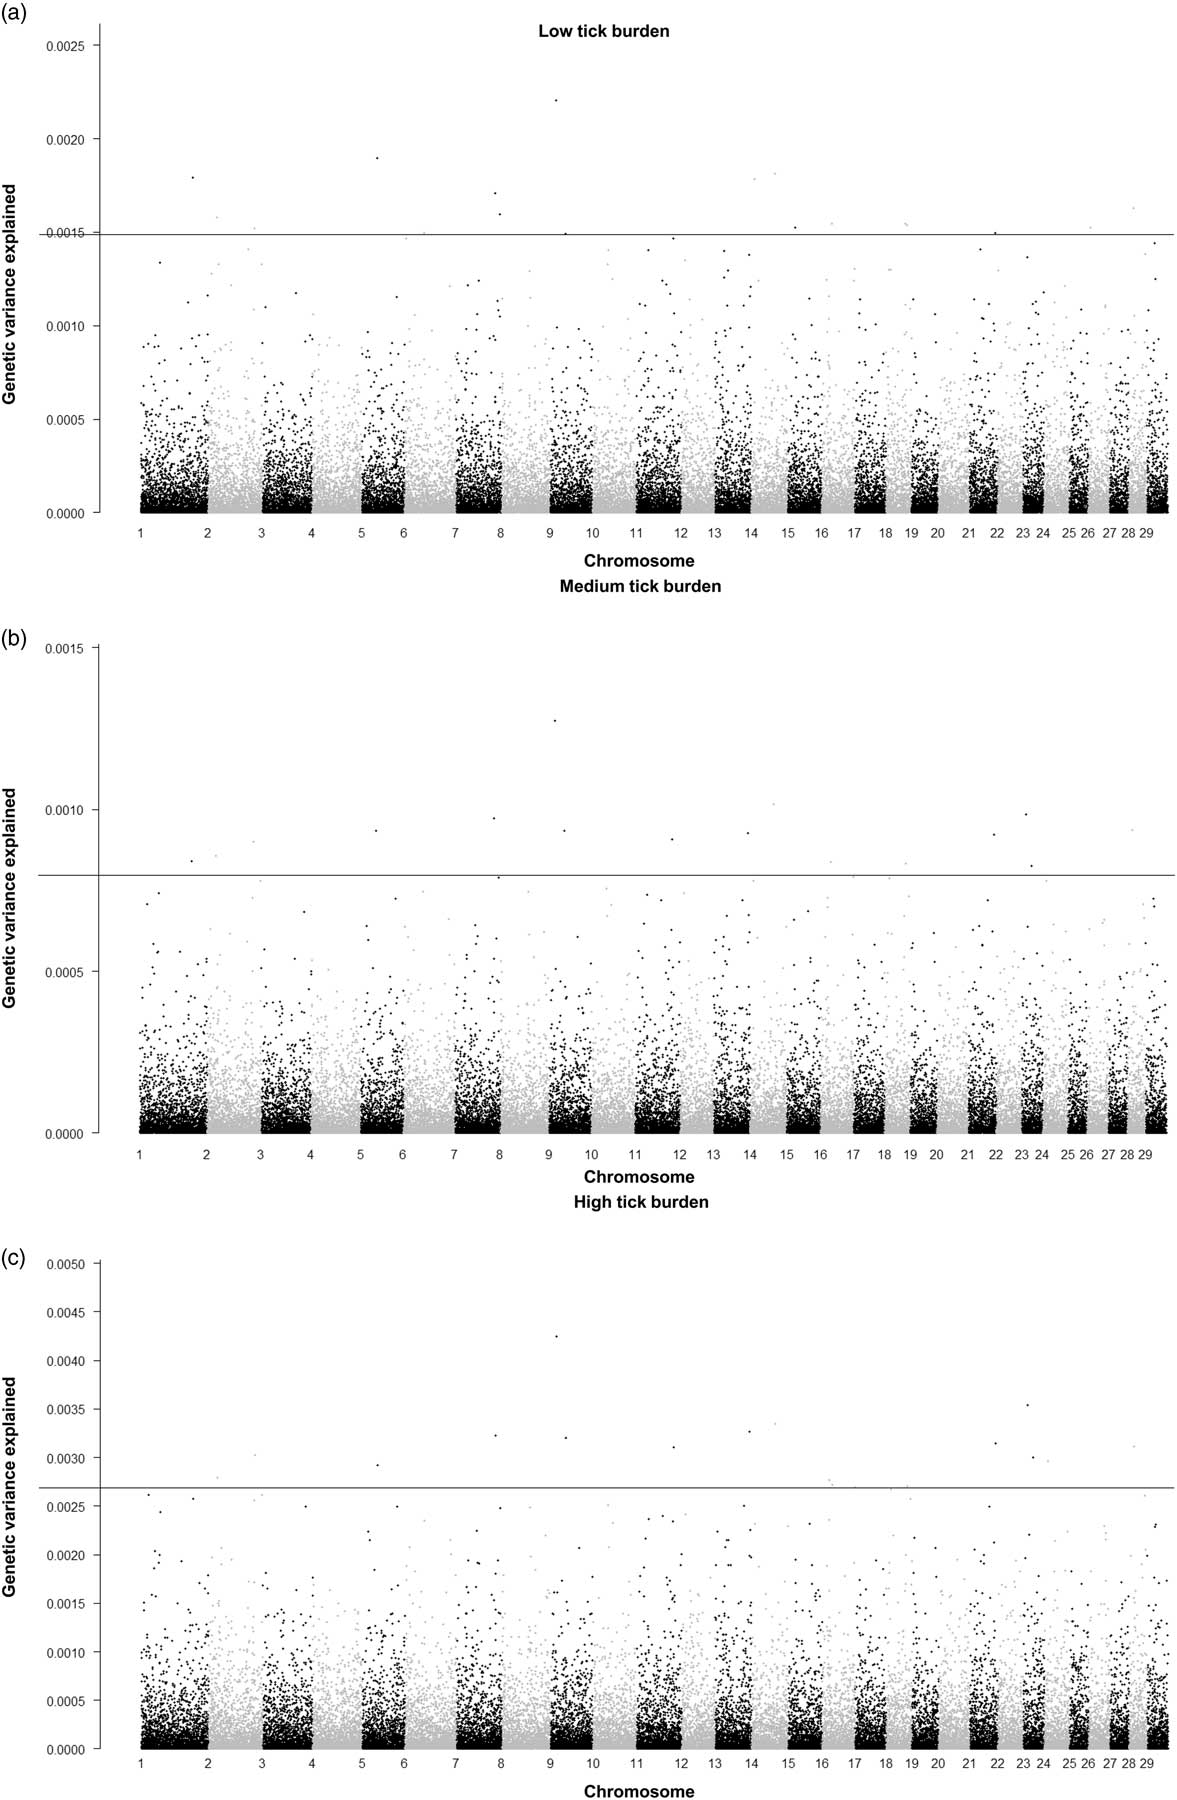
The Manhattan plots showed SNP markers with larger portion of the genetic variance explained in three different environment levels associated with tick burden (Figure 3). The threshold of genetic variance explained were 0.15%, 0.08%, 0.29%, respectively for LTI, MTI and HTI. We declared 18, 16 and 18 SNPs as outliers or significant for low, medium and high levels, respectively. From those; 11 were coincident in all levels, 12 between low and medium, 11 between low and high and 15 between medium and high tick burden. On the other hand, we identified unique SNPs by levels: six (Hapmap32456-BTC-038385, Hapmap57373-rs29019418, Hapmap33459-BTC-069647, ARS-BFGL-NGS113417, ARS-USMARC-Parent-AY863214-rs17871744 and ARS-BFGL-NGS-73895) in low and three (BTB-01475457, ARS-BFGL-NGS-52551, BTA-115451-no-rs) in high levels. Most of the SNPs explained the highest genetic variance proportion in medium and high levels (n=15), whereas a subset of those (n=11) were also significant in low tick burden. These results reinforce the presence of SNP by environment interactions in our study; as different patterns were observed according to the environmental condition in which the animals were raised.
Manhattan plots at low (a), medium (b) and high (c) tick burden. Chromosomes 1 to 29 are shown separated by alternating colors. The corresponding horizontal line indicates the outliers/significant single nucleotide polymorphism markers based on genetic variance explained.

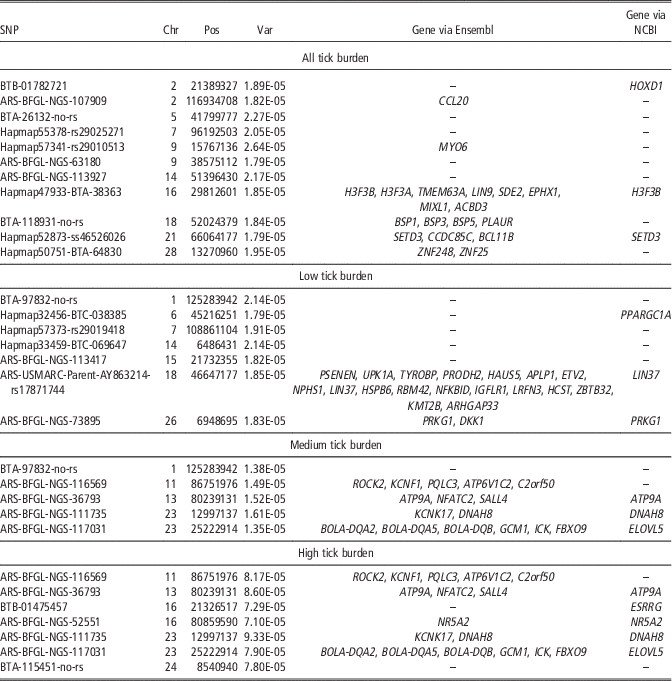
The significant SNPs were detected in B. taurus chromosomes BTA 1, 2, 5, 6, 7, 9, 11, 13, 14, 15, 16, 18, 21, 23, 24, 26 and 28. From these SNPs, potential candidate genes were identified (Table 1) by using different sources for gene mapping (NCBI and Ensembl). Some of these SNPs had no gene identified; however, most of the potential candidate genes pointed out were detected in all tick burden levels. Moreover, genes like PPARGC1A, LIN37, PRKG1, UPK1A and DKK1 were found to be mapped surrounding SNPs exclusively identified in low, whereas NR5A2 and ESRRG, only to high tick burden (Table 1).
Single nucleotide polymorphism (SNP), chromosome (Chr), position (Pos), genetic variance explained (Var), candidate gene symbol mapped through Ensembl and/or NCBI database for outliers/significant SNPs at different tick burden (low, medium and high)

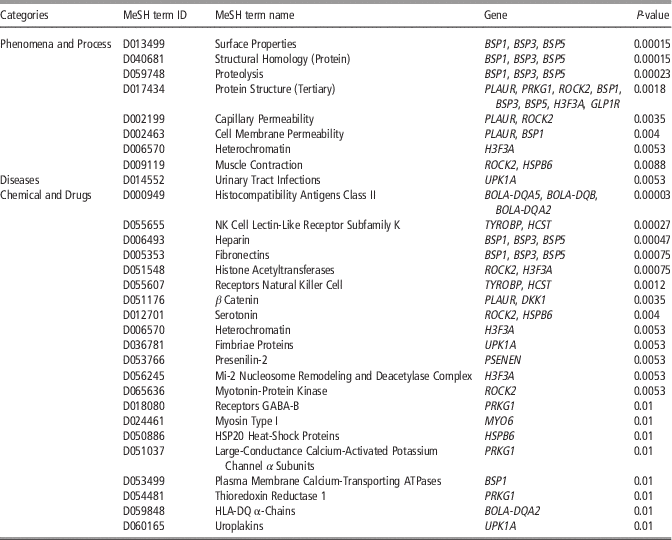
Table 2 presented the significantly MeSH terms (P-values <0.01) returned by MeSH ORA that deserve particular attention in the area of diseases resistance/immunology. Each MeSH term was clustered into three categories: Diseases, Phenomena and Processes, and Chemical and Drugs.
-Statistically significant (P-value⩽0.01) MeSH (Medical Subject Headings) terms (ID and name) associated to the selected genes for three categories (1 – Phenomena and Process, 2 – Diseases and 3 – Chemical and Drugs)

The peroxisome proliferator-activated receptor γ coactivator 1 α (PPARγ/PGC-1α) protein, encoded by PPARGC1A gene, was related to a SNP located on BTA6. PPARGC1A is a metabolic switch, which transcriptionally activates a complex pathway of mitochondrial biogenesis and energy (lipid and glucose) metabolism. Despite PPARGC1A (or PGC-1α) being postulated as the most plausible gene underlying a QTL for fat yield (Streit et al., Reference Streit, Wellmann, Reinhardt, Thaller, Piepho and Bennewitz2013), the role of the PPARγ/PGC-1α pathway in the pathogenesis of liver cancer was investigated (Lee et al., Reference Lee, Su, Yin, Lee and Chi2009) and PPARγ reported to mediate macrophage differentiation and inflammatory responses (Moore et al., Reference Moore, Rosen, Fitzgerald, Randow, Andersson, Altshuler, Milstone, Mortensen, Spiegelman and Freeman2001). PPARGC1A and steroid receptor coactivator-2 are important coactivators for the PPAR ß regulatory functions, which in turn regulates the transcription of several genes implicated in metabolism, differentiation and immune functions (Neels and Grimaldi, Reference Neels and Grimaldi2014).
The PRKG1 gene was mapped close to the SNP (ARS-BFGL-NGS-73895; BTA26) with significant effect only in low tick burden. This gene was previously reported to be involved in systemic lupus erythematosus, that is, an autoimmune disorder related to multiple organ systems including skin, musculoskeletal, renal and hematologic systems in humans (Kariuki et al., Reference Kariuki, Ghodke-Puranik, Dorschner, Chrabot, Kelly, Tsao, Kimberly, Alarcón-Riquelme, Jacob and Criswell2015). Despite PRKG1 function was not as strongly supported in other immune cells such as T and B cells, it was in interferon-α-producing cells. In addition, PRKG1 gene was also pointed out by MeSH terms Large-Conductance Calcium-Activated Potassium Channel α Subunits, Receptors GABA-B and Thioredoxin Reductase (Chemical and Drugs category) (Table 2). On the other hand, BSP1, BSP3 and BSP5 (mapped on BTA18) are genes associated to BTA-118931-no-rs marker across all (low, medium and high) tick burden levels, and related to some MeSH terms: Surface Properties; Structural Homology, Protein; Protein Structure, Tertiary; Cell Membrane Permeability; Heparin and Fibronectins and Plasma Membrane Calcium-Transporting ATPase.
The lin-37 DREAM MuvB core complex component, the protein product of LIN37 gene mapped on BTA18 only in low tick burden level, is required for regulation of chondrocyte proliferation (Forristal et al., Reference Forristal, Henley, MacDonald, Bush, Ort, Passos, Talluri, Ishak, Thwaites and Norley2014). It is possible to infer that genes related to protein structure and cell proliferation may be involved with the inflammatory phase, adding to extracellular matrix remodeling, new blood vessels formation and epithelia (Theilgaard-Mönch et al., Reference Theilgaard-Mönch, Knudsen, Follin and Borregaard2004). In fact, the MYO6 gene, likewise related to cytoskeleton rebuilding (actin-myosin) in inflammatory conditions (Liao et al., 2013), is another significant gene associated within the MeSH term Myosin Type I. Thus, MYO6 may play a critical role in epithelial barrier function.
The DKK1 gene (Dickkopf-1) mapped on BTA26, as a major modulator of Wnt signaling could be involved in rickettsia infections pathogenesis, suggesting inflammatory effects (release of proinflammatory cytokines interleukin (IL)-6, IL-8) if silenced (Astrup et al., Reference Astrup, Lekva, Davì, Otterdal, Santilli, Øie, Halvorsen, Damås, Raoult and Vitale2012). This gene was associated to the β-catenin MeSH term (Table 2) jointly with PLAUR plasminogen activator, urokinase receptor gene. Plasminogen activator inhibitor-1 was mentioned to be involved with blood coagulation cascade. This is host defense first line that ticks have to defeat to successfully feed and subsequently transmit disease pathogens (Mulenga et al., Reference Mulenga, Sugino, Nakajima, Sugimoto and Onuma2001). It is known that uncontrolled inflammation may lead to tissue injury, and among many signaling pathways activated, the conserved pathway Wnt/β-catenin plays an important role in the expression of inflammatory molecules (Silva-García et al., Reference Silva, Mulder, Knol, Lopes, Guimarães, Lopes, Mathur, Viana and Bastiaansen2014).
The candidate gene NR5A2 was mapped on BTA16, although associated to SNPs exclusively significant in high tick burden level. The nuclear receptor is a superfamily of eukaryotic transcription factors that are crucial for gene regulation and development. The NR5A2 gene was reported to be enriched expressed in mammalian epithelial tissues and possibly related to mastitis immune response (Sharma and Jeong, Reference Sharma and Jeong2013). In addition, Flandez et al. (Reference Flandez, Cendrowski, Cañamero, Salas, Del Pozo, Schoonjans and Real2014) indicated that NR5A2 is a novel pancreatic tumor suppressor, displaying histological abnormalities in the pancreas and showing impaired recovery from damage. This was followed especially by proinflammatory cytokine gene expression, hyper nuclear factor-kb activation and signal transducer. These findings led us to speculate about the relevance of this gene in terms of tick injuries in epithelial cells.
Another unique SNP (BTB-01475457) identified in high tick burden, was mapped to ESRRG gene, which is known to be strongly connected to T cell function via mitochondrial metabolism in autoimmune lupus disease (Perry et al., Reference Perry, Yin, Telarico, Baker, Dozmorov, Perl and Morel2012; Choi et al., Reference Choi, Titov, Sivakumar, Li and Morel2016). Perry et al. (Reference Perry, Yin, Telarico, Baker, Dozmorov, Perl and Morel2012) have reported mitochondrial functions decreased in CD4+ T cells expressing the NZM2410 allele of ESRRG. An old study in guinea pigs reported that significant resistance to tick burden can be transferred with viable T cells (Wikel and Allen, Reference Wikel and Allen1976). According to these authors, the tick resistance passage with T cells indicates a delayed hypersensitivity mechanism for tick resistance acquisition. These reports might explain the expression of this gene in high tick burden. Moreover, this gene was identified in a region from bottom 1% smoothed F ST values, considered as potentially linked to purifying or balancing selection processes in domestic cattle (Porto-Neto et al., Reference Porto Neto, Bunch, Harrison and Barendse2013).
On BTA23, the DNAH8 and ELOVL5 genes were identified in medium and high tick burden. DNAH8 gene was recently highlighted as reproduction-related function by Fischer et al. (Reference Fischer, Laiho, Gyenesei and Sironen2015) in a Finnish Large White pig population. Newsworthy, the ELOVL5 gene has already been reported as related to immune responses in Canadian Holstein cattle (Thompson-Crispi et al., Reference Thompson-Crispi, Sargolzaei, Ventura, Abo-Ismail, Miglior, Schenkel and Mallard2014). These authors mapped ELOVL5 as top 10 significant SNPs for antibody-mediated immune response (AMIR) in Holstein cows. Moreover, this genomic region is well known as a location of major genes associated with immune responses and resistance to diseases (Stear et al., Reference Stear, Bishop, Mallard and Raadsma2001; Ellis and Codner, Reference Ellis and Codner2012; Thompson-Crispi et al., Reference Thompson-Crispi, Sargolzaei, Ventura, Abo-Ismail, Miglior, Schenkel and Mallard2014). As reported by Thompson-Crispi et al. (Reference Thompson-Crispi, Sargolzaei, Ventura, Abo-Ismail, Miglior, Schenkel and Mallard2014), the expression of this gene showed superior immune responses for male and female Holsteins. As these authors had reported the significant association of ELVOL5 with AMIRs, we might also infer that this gene is somehow related to tick immune responses. In addition, an important tool to identify less susceptible animals can be established since cattle with higher immune responses tend to have a lower occurrence of diseases.
The same authors above also reported candidate genes within the bovine major histocompatibility complex, such as BOLA-DQA1 and BOLA-DQB. Our results from ORA through MeSH indicated BOLA-DQA5, BOLA-DQB, BOLA-DQA2 (MeSH term D000949) as candidates to be related to the mechanisms of resistance to parasites in medium and high tick burden. These complex have already been reported by Martinez et al. (Reference Martinez, Machado, Nascimento, Silva, Teodoro, Furlong, Prata, Campos, Guimarães and Azevedo2006) showing interaction between the BOLA complex and innate and adaptive immunity traits in crossbred (Holstein×Gyr) cattle population.
The H3 histone, family 3B (H3.3B), a protein encoded by the H3F3B gene was detected in all tick burden levels and highlighted in some MeSH terms between Phenomena and Process and Chemical and Drugs categories (Protein Structure, Tertiary; Heterochromatin; Histone Acetyltransferases; Mi-2 Nucleosome Remodeling and Deacetylase Complex). Although histones are normally responsible for nucleosome structure of the chromosomal fiber, this gene has been also related to connective tissue disorders and inflammatory diseases (Gras et al., Reference Gras, Almonacid, Ortega, Serramia, Gomez, de la Mata, Lopez-Fernandez and Muñoz-Fernandez2009).
In general, regarding the ORA MeSH results, it also worth to mention the MeSH term highlighted within those listed in Chemical and Drugs category, Receptors Natural Killer Cell, including genes like TYROBP and HCST. Natural killer cells are innate immune response effectors which function as regulatory cells in interactions with endothelial cells, dendritic cells, macrophages and T lymphocytes (Vivier et al., Reference Vivier, Tomasello, Baratin, Walzer and Ugolini2008).
Moreover, the significant MeSH term Serotonin, associated with Chemical and Drugs category, related ROCK2 and HSPB6 genes. Although these genes could play a role in the immune system, it is known serotonin is an inflammatory mediator that is rapidly released at the site of tissue injury by the vascular endothelium and attracted inflammatory cells. The serotonin is also related to the anti-inflammatory actions at feeding site exhibiting by tick salivary prostaglandins (Singh and Girschick, Reference Singh and Girschick2003).
Studies have been considering the signaling and Ca2+ binding protein genes in skin samples taken from cattle with known high (HR) and low (LR) resistance to ticks (Bagnall et al., Reference Bagnall, Gough, Cadogan, Burns and Kongsuwan2009). Reported by those authors, an ATPase gene (AT2A1 (SERCA2)- Sarco/endoplasmic reticulum calcium ATPase) was detected as differentially expressed between HR and LR cattle by cattle tick (Rhipicephalus (Boophilus) microplus) artificial challenge. This gene was suggested to be involved in tick attachment response. Similarly, we identified an ATPase gene (ATP9A), mapped on BTA13 in medium and high tick burden, and related to metabolic processes and phospholipid transport (Lee et al., Reference Lee, Chang, Yeom, Kim, Choi, Shim, Lee and Hahm2005; Wei et al., Reference Wei, Wang, Yang, Dong and Wang2010).
In terms of tick resistance these genes might be very important as tick bites cause activation of an inflammatory process influenced by cattle genetic composition and previous exposure (Carvalho et al., Reference Carvalho, Domingues, de Azevedo Prata, da Silva, de Oliveira, Guimarães and Machado2014). Most of the genes and biological/functional terms identified and discussed in Carvalho et al. (Reference Carvalho, Domingues, de Azevedo Prata, da Silva, de Oliveira, Guimarães and Machado2014), are either part of the choreographed host defense responses (such as cutaneous interface) or the tick countermeasures in which the successful blood feeding and establishment of tick-borne infectious agents within the host occurs.
The presence of SNP by environment interactions was confirmed for tick resistance via one-step reaction norm models and SNPs that affect different tick burden levels could be identified. We reported outliers or significant SNPs associated with tick burden across environments and neighboring genes with different direct or indirectly molecular functions related to immune system, inflammatory process and mechanisms of tissue destruction/repair, such as energy metabolism and cell differentiation in Hereford/Braford cattle population.
The ORA through MeSH was able to enrich the gene biological knowledge and this tool has been applied successfully to mammals, including dairy cattle, swine and horse (Morota et al., Reference Morota, Peñagaricano, Petersen, Ciobanu, Tsuyuzaki and Nikaido2015). This information can be useful to further explore pathways and gene networks for validation and better dissection of candidate genes and their interaction with tick resistance/susceptibility mechanisms. By candidate genes validation, more reliable predictions are expected in genomic selection through SNP panels developed from the target population and taking into account individuals from different environments.
In addition, based on a previous persistence of LD phase in this population (Biegelmeyer et al., Reference Biegelmeyer, Gulias-Gomes, Caetano, Steibel and Cardoso2016), which reflects their genetic relationships, knowledge about SNP effects or candidate genes by environmental interactions could be further used to increase accuracy of selection across environments and to choose best sires for different environments in genomic selection evaluations of this Hereford/Braford population.
Despite the main contribution of the present study in drawing interest toward SNP effects, genetic variance explained and candidate genes identified via linear genomic reaction norms, we are aware that a simple approach was used here for GWAS. Some future studies should applied higher-order of reaction norm models or even other specific GWAS models, such as Bayes-A, Bayes-B and Bayesian LASSO.
Acknowledgments
The authors thank Delta G Connection by providing the data; CAPES and CNPq by granting the scholarships. This project was supported by CNPq – National Council for Scientific and Technological Development Grant No. 478992/2012-2, Embrapa – Brazilian Agricultural Research Corporation Grants No. 02.13.10.002 and 01.11.07.002, and Agriculture and Food Research Initiative Competitive Grant No. 2011-67015-30338 from the USDA National Institute of Food and Agriculture.
Supplementary Material
To view supplementary material for this article, please visit https://doi.org/10.1017/S1751731117001562