

1. Introduction
Networks annotated with node attributes and link attributes form a rich class of data structures. For example, multilayer and multiplex networks are obtained when nodes and links sharing a common attribute are identified as a layer (Kivelä et al., Reference Kivelä, Arenas, Barthelemy, Gleeson, Moreno and Moreno2014; Interdonato et al., Reference Interdonato, Atzmueller, Gaito, Kanawati and Largeron2019). This article presents a simple method for identifying communities in such networks. The first step is to combine various relevant data sets into a single data matrix, denoted
 $M$
, in which rows correspond to network nodes and columns to data items. The second step is to arrange the rows of
 $M$
into disjoint groups, called communities, using a regular decomposition (RD) method adopted from (Reittu et al., Reference Reittu, Bazsó, Weiss, Fränti, Brown, Loog, Escolano and Pelillo2014, Reference Reittu, Leskelä, Räty and Fiorucci2018, Reference Reittu, Norros, Räty, Bolla and Bazsó2019; Norros et al., Reference Norros, Reittu and Bazsó2022). RD determines communities by a partition of nodes which allows a maximal compression of
 $M$
. This is similar in spirit to nonparametric Bayesian methods associated with stochastic block models (SBMs) (Peixoto, Reference Peixoto2015). However, in our case we suggest to partition only the rows. This can be seen as an extreme case of block modeling in which every column is considered as a block. To determine the number of communities, we suggest using the minimum description length principle (MDL) following the RD method (e.g., Reittu et al., Reference Reittu, Bazsó, Weiss, Fränti, Brown, Loog, Escolano and Pelillo2014; Norros et al., Reference Norros, Reittu and Bazsó2022). In this approach, each partition of the node set induces a certain probability distribution on the space of data matrices. The rounded-up integer part of minus logarithm of the probability of the observed data matrix
 $M$
is the length of the Shannon code for
 $M$
(e.g., Cover & Thomas, Reference Cover and Thomas2006). Such a coding exists, provably, but there is no need to know how it is constructed. The length of such a code is just used to measure the goodness of fit of a model. According to the MDL principle, the full coding length of
 $M$
is the sum of the Shannon code length and the prefix code lengths of all parameters of the associated probability distribution. For instance, one of such parameters is the number of communities
 $k$
; its approximate code length is
 $\log k$
. By minimizing the full code length, MDL is capable of optimizing all parameters (see Peixoto, Reference Peixoto2012; Grünwald, Reference Grünwald2007; Norros et al., Reference Norros, Reittu and Bazsó2022). In our sample cases, we use graph distances as data items associated with nodes. The use of distance matrix as a basis for spectral community detection was suggested in (Bhattacharyya & Bickel, Reference Bhattacharyya and Bickel2014) and as basis for RD in (Reittu et al., Reference Reittu, Leskelä, Räty and Fiorucci2018). One benefit of such a choice is that in a sparse connected network, every pair of nodes has a nonzero distance entry, whereas most entries of the adjacency matrix are zero (Reittu et al., Reference Reittu, Leskelä, Räty and Fiorucci2018). In multiplex networks, one approach of constructing a data matrix is to concatenate distance matrices associated with distinct layers so that
 $M = [D_1 \dots D_m]$
where
 $D_s$
indicates the distance matrix of layer
 $s=1,\dots,m$
. In the case of directed networks, each distance matrix
 $D_s$
may be replaced by
 $[D_s, D^T_s]$
where the
 $ij$
-entry of
 $D_s$
equals the shortest directed path length from
 $i$
to
 $j$
, and the transposed matrix,
 $D^T_s$
, gives the corresponding path lengths in the reverse direction. In the aforementioned cases, the data matrix is determined by the adjacency matrix. However, because our method makes no assumptions on the number of columns of the data matrix, arbitrary type of node attributes can easily be incorporated as auxiliary columns in the data matrix.
The performance of the proposed method is illustrated by analyzing three cases, one synthetic network and two real-world networks. First, we consider a synthetic power-law random graph in which each node possesses a capacity characterizing the propensity of link formation with other nodes (Norros & Reittu, Reference Norros and Reittu2006; van der Hofstad, Reference van der Hofstad2017). These capacities are considered as extra data items forming one column in the data matrix
 $M$
. When the capacities follow a power-law distribution, a nontrivial asymptotic graph structure emerges (Reittu & Norros, Reference Reittu and Norros2004; Norros & Reittu, Reference Norros and Reittu2008b) where nodes can be grouped into tiers so that nodes with capacity inside a certain interval form a tier, and the tiers characterize shortest path lengths in the network (van der Hofstad & Hooghiemstra, Reference van der Hofstad and Hooghiemstra2008). Our aim is to identify network communities that can be related to the distribution of the shortest path lengths and consequently to the tiers. Along with high-degree variability, another challenge is that the whole tier structure has a vanishing relative size in the large graph limit. Usual community detection algorithms are prone to ignore such small-scale communities.
Second, as an example of a single-layer real network, we consider a snapshot of the Internet topology in which the nodes are autonomous systems (AS) and the edges are direct-peering relationships between them (Gastner & Newman, Reference Gastner and Newman2006). The data matrix
 $M$
equals the graph distance matrix with an extra column of node degrees added.
Third, as an example of a multiplex real-life network, we investigate a world airline graph, in which nodes are airports, links are airways, and layers correspond to carriers. This graph is directed and has a skewed degree distribution, with few high-degree nodes acting as hubs. We consider concatenated two-way distance matrices of the layers as the data matrix. In this example, we also demonstrate how to deal with missing data values which correspond to not fully connected layers.
Finally, we compare our method with some other widely used approaches in community detection and data compression.
1.1 Related work and main new contributions
Community detection is by now a well-developed field having a literature covering lots of efficient computational methods and deep theoretical treatments of consistency (Girvan & Newman, Reference Girvan and Newman2002; Karrer & Newman, Reference Karrer and Newman2011; Fortunato, Reference Fortunato2010; Peixoto, Reference Peixoto2015; Zhao et al., Reference Zhao, Levina and Zhu2012; Lei & Rinaldo, Reference Lei and Rinaldo2015; Zhang & Zhou, Reference Zhang and Zhou2016; Xu et al., Reference Xu, Jog and Loh2020; Avrachenkov et al., Reference Avrachenkov, Dreveton and Leskelä2022; Bolla, Reference Bolla2013). Theoretically, for a given statistical generative model, the most accurate community recovery is achieved by a maximum likelihood estimator (Zhao et al., Reference Zhao, Levina and Zhu2012; Zhang & Zhou, Reference Zhang and Zhou2016) but implementing this is usually computationally infeasible for large networks. Although popular adjacency matrix-based spectral clustering methods seek to cluster nodes by their expansion profiles (Lei & Rinaldo, Reference Lei and Rinaldo2015), an alternative approach is to cluster nodes by their distance profiles (Reittu et al., Reference Reittu, Leskelä, Räty and Fiorucci2018). The relevance of distances in identifying network communities has not yet been much studied empirically. In many cases, expansion and distance profiles lead to similar results, but in certain cases distance profiles might expose soft hierarchies which are not easy to detect directly from the adjacency matrix.
In the present article, we propose a general approach where nodes are clustered based on generic data profiles with an arbitrary number of numerical data associated with every node. Community recovery in our generalized approach is based on maximizing a Poisson likelihood. This is similar to the SBM in that both generate random matrices with rows corresponding to nodes, and the probability distribution of each row is determined by the community of the corresponding node. Nevertheless, there is one crucial difference: although SBM generates samples of the full graph (adjacency matrix), our model captures a user-specified set of features associated with each node. Choosing adjacency indicator variables as features, we obtain the adjacency matrix as a special case. When fitted to an adjacency matrix, our method becomes similar to a classical SBM-based maximum likelihood estimator. SBM-based community recovery methods are known to suffer from degree bias which can be avoided by employing a degree-corrected SBM method (Karrer & Newman, Reference Karrer and Newman2011; Zhao et al., Reference Zhao, Levina and Zhu2012). Instead of adjacency matrices, our model can be fitted into arbitrary node features. Our examples focus on graph distances and node degrees as data items. When fitted to distance data, our model does not implicitly impose Poisson degree distributions, and therefore, our method applied to distance matrices provides an alternative way to avoid degree bias in community detection.
There is no canonical definition of a community in networks. In the present article, we interpret communities from an information-theoretical viewpoint of the MDL principle (Grünwald, Reference Grünwald2007). As a result, an objective measure of the success of community detection is the compression rate of the data at hand. In the current work, we suggest to use this method to generic data matrices describing a network. The novelty of our work comes from suggesting a systematic way on finding graph communities which reflect a multitude of data items associated to the network by partitioning the rows of the corresponding data matrix. We demonstrate our method using graph distances as a relation between the nodes, augmented with node degrees as scalar data items. We also demonstrate how to deal with a case when relations do not exist between all pairs of nodes, in the case of a directed multiplex network.
Several complementary methods exist for identifying communities, say, in multilayer networks. For instance, extending the concept of modularity (Newman, Reference Newman2006) to multilayer setting (Wilson et al., Reference Wilson, Palowitch, Bhamidi and Nobel2017) and identifying modularity flows with information-theoretic tools (De Domenico et al., Reference De Domenico, Lancichinetti, Arenas and Rosvall2015). There are also many alternatives for extending graph community detection which takes into account data which is not induced from the topology. (Newman & Clauset, Reference Newman and Clauset2016; Hric et al., Reference Hric, Peixoto and Fortunato2016) extend SBM in order to take into account node metadata. Community detection in multilayer networks with node attributes has also been proposed in (Contisciani et al., Reference Contisciani, Power and Bacco2020), yielding promising results in interpreting the communities and using node attribute for predicting unknown links, etc. (Fajardo-Fontiveros et al., Reference Fajardo-Fontiveros, Guimerà and Sales-Pardo2022) develop SBM for multilayer networks in which node attributes are used for enhancing solving network inference problems. Ideas in these publications could be used to enhance our method using more sophisticated treatment of the data items, which we leave as a subject for further study. In an extended survey, a multitude of methods for community detection is presented and evaluated for various use cases (Magnani et al., Reference Magnani, Hanteer, Interdonato, Rossi and Tagarelli2021). Development of quantum computers may offer new ways of solving hard community detection problems in the future. For instance, solving the modularity maximization problem can be seen as an instance of quadratic binary optimization, which can be solved on so-called quantum annealer realized by the D-Wave with around
 $5$
thousand quantum bits, (Negre et al., Reference Negre, Ushijima-Mwesigwa and Mniszewski2020). Another idea is to use Szemerédi’s regularity lemma (Szemerédi, Reference Szemerédi1978; Tao, Reference Tao2006) for obtaining a quadratic binary cost function, minimum of which yields graph communities (Reittu et al., Reference Reittu, Kotovirta, Leskelä, Rummukainen, Räty, Baru, Huan, Khan, Hu, Ak, Tian, Barga, Zaniolo, Lee and Ye2020).
2. Regular decomposition
In this section, we describe our method of analyzing a network based on a generic data matrix, which describes the network. RD was originally developed in (Nepusz et al., Reference Nepusz, Négyessy, Tusnády, Bazsó, Bollobás, Kozma and Miklós2008; Reittu et al., Reference Reittu, Norros, Bazsó, Al Hasan and Madduri2017b; Pehkonen & Reittu, Reference Pehkonen and Reittu2011; Reittu et al., Reference Reittu, Bazsó, Weiss, Fränti, Brown, Loog, Escolano and Pelillo2014, Reference Reittu, Bazsó and Norros2017a, Reference Reittu, Leskelä, Räty and Fiorucci2018, Reference Reittu, Norros, Räty, Bolla and Bazsó2019; Norros et al., Reference Norros, Reittu and Bazsó2022). RD is inspired by Szemerédi’s regularity lemma (Szemerédi, Reference Szemerédi1978), information theory (Grünwald, Reference Grünwald2007), and SBMs (Abbe, Reference Abbe2017). In the publication (Reittu et al., Reference Reittu, Leskelä, Räty and Fiorucci2018), the RD method was used for community detection with a single graph distance matrix as a data matrix. In (Haryo & Pulungan, Reference Haryo and Pulungan2022), the authors evaluated performance of the RD method for a generic data clustering. In this work, we extend such methods by exploiting more general, non-rectangular, data matrices as a basis for community detection. In this way, we get a flexible method that can find communities that highlight various properties of the network, like degree distribution and distances in multiplex networks, and could be used in other cases that can be formulated in a similar way. In the next subsection, we expose such a method in more details following and adapting some ideas in the cited works.
2.1 Data matrix and partition matrix
Consider a set of nodes indexed by
 $[n] = \{1,\dots,n\}$
, and an
 $n$
-by-
 $m$
data matrix
 $M$
in which row
 $i$
represents data associated with node
 $i$
, and entry
 $M_{ij}$
represents the value of the
 $j$
th data item associated with node
 $i$
. In a basic setting,
 $M$
equals the adjacency matrix
 $A$
(with
 $m=n$
) of a single graph, and the rows correspond to adjacency profiles of the nodes. Alternatively, network data could be summarized by a distance matrix
 $D$
(with
 $m=n$
), in which case the rows of the data matrix correspond to distance profiles. Indeed, matrices
 $D$
and
 $A$
provide equivalent representations of the network topology.Footnote
1
In this article, we take a more general approach and allow the number
 $m$
of data items associated with a node to be arbitrary. This flexibility allows to model multilayer networks by concatenating, say, several adjacency or distance matrices side by side into a single data matrix. Furthermore, any data associated with nodes can easily be concatenated to the data matrix as extra columns. In this more general case, each row of
 $M$
corresponds to a data profile of a node.
Using the data matrix, we partition the node set into
 $k$
disjoint sets called communities. Such a partition can be represented as an
 $n$
-by-
 $k$
partition matrix
 $R$
with entries
 \begin{equation*} R_{iu} \ = \ \begin {cases} 1 &\quad \text {if node $i$ is in community $u$}, \\ 0 &\quad \text {else}. \end {cases} \end{equation*}
In applications, some entries of the data matrix
 $M$
may be undefined or unobserved. These situations are handled by equipping
 $M$
with an
 $n$
-by-
 $m$
indicator matrix
 $C$
in which
 $C_{ij} =1$
indicated a valid entry, and
 $C_{ij}=0$
indicates an undefined or unobserved entry. The corresponding matrix elements of
 $M$
, which are not defined or are missing, are replaced by dummy values, which is chosen to be
 $0$
in all our sample cases. We demonstrate how this works in Section 5.
Our aim is to group nodes into few communities in such a way that description length of
 $M$
is minimized based on a probabilistic model for the matrix elements of
 $M$
. In other words, we try to find an optimal number of communities
 $k$
and corresponding optimal partitioning
 $\mathcal{U}_k=\{U_1,U_2,\dots,U_k\}$
of
 $[n]$
to achieve this. In case of non-negative integer-valued
 $M$
, rows in a community
 $s \in [k]$
are modeled by a sequence of
 $m$
independent Poisson-distributed random variables denoted as
 $(X^s_1,X^s_2,\cdots,X^s_m)$
. As a result, the probabilistic model constitutes of
 $n \times m$
independent Poisson random variables with
 $k \times m$
parameters, the expectations of the corresponding variables. Such a choice is adopted from (Reittu et al., Reference Reittu, Bazsó, Weiss, Fränti, Brown, Loog, Escolano and Pelillo2014). Communities are selected in order to minimize the magnitude
 \begin{equation*} L(\mathcal {U}_k) \,{:\!=}\, - \sum _{s \in [k]} \sum _{d\in U_s } \sum _{j \in [m]} \log _2\!(\mathbb {P}(X^s_j = M_{dj}). \end{equation*}
According to classical information theory (e.g., Cover & Thomas, Reference Cover and Thomas2006), there exists a binary code, the Shannon code, for encoding
 $M$
with code length
 $= \lceil L \rceil$
. We use
 $L$
as a cost function of the partition
 $\mathcal{U}_k$
. The quality of the found communities is the compression ratio
 \begin{equation*} r(\mathcal {U}_k)=\frac {L(M)}{L(\mathcal {U}_k)}, \end{equation*}
in which
 $L(M)=\sum _{i,j: M_{ij}\gt 0} \log M_{ij}$
is the number of bits needed to represent data matrix
 $M$
as a string of integers.
2.2 Likelihood function
We employ a statistical latent-variable model in which all observable entries (those with
 $C_{ji}=1$
) of the data matrix
 $M$
are conditionally independent and Poisson-distributed random variables given the community structure. Furthermore, all rows of
 $M$
corresponding to the same community are identically distributed. This statistical model is parameterized by an
 $n$
-by-
 $k$
partition matrix
 $R$
and an
 $m$
-by-
 $k$
expectation matrix
 $\Lambda$
of Poisson variables and corresponds to likelihood function
 \begin{equation} f(M | \Lambda,R) \ = \ \prod _{j=1}^{n} \prod _{i=1}^{m} \prod _{u=1}^k \operatorname{Poi}(M_{ji} | \Lambda _{i u})^{C_{ji} R_{ju}}, \end{equation}
where
 $\operatorname{Poi}(x | \lambda ) = e^{-\lambda } \frac{\lambda ^x}{x!}$
is the probability mass function of a Poisson distribution with mean
 $\lambda$
. The corresponding log-likelihood can be written as
 \begin{equation*} \label {log} \log f(M | \Lambda,R) \ = \ \sum _{i=1}^m \sum _{j=1}^n \sum _{u=1}^k R_{ju} C_{ji} \Big ( M_{ji} \log \Lambda _{iu} - \Lambda _{iu} \Big ) - \text {const}(M), \end{equation*}
where
 $\text{const}(M) = \sum _{j=1}^n \sum _{i=1}^m C_{ji} \log \!( M_{ji}!)$
does not depend on the model parameters and can be ignored. The above model is structurally similar to the SBM in which the data matrix has
 $m=n$
columns and corresponds to the adjacency matrix, and the Poisson distributions are replaced by Bernoulli distributions (Holland et al., Reference Holland, Laskey and Leinhardt1983; Zhang & Zhou, Reference Zhang and Zhou2016). In contrast to SBMs, the above model allows more flexibility in choosing data matrices with an arbitrary number of columns
 $m$
. Note also that only the rows are grouped in blocks, all columns are treated as separate. In this sense, the model has maximal number of variables with respect to the number of columns.
2.3 Maximum likelihood estimation
Having observed a data matrix
 $M$
, maximum likelihood estimation searches for a partition matrix
 $R$
of
 $[n]$
for which the function in Equation (2.2) is maximized. For any fixed
 $R$
, the
 $\Lambda$
-parameters are set equal to
 \begin{equation} \hat \Lambda _{iv}(R) \ = \ \frac{\sum _{j=1}^n M_{ji}R_{jv}C_{ji}}{\sum _{j=1}^n R_{jv}C_{ji}}, \end{equation}
which is the observed average of the
 $i$
th data item in community
 $v$
. As a consequence, a maximum likelihood estimate of
 $R$
is obtained by maximizing the profile log-likelihood
 $f(M \, | \, \hat \Lambda (R), R)$
, or equivalently minimizing
 \begin{equation} L(R) \ = \ \sum _{i=1}^m \sum _{j=1}^n \sum _{v=1}^k R_{jv}C_{ji} \left ( \hat \Lambda _{iv}(R) - M_{ji} \log \hat \Lambda _{iv}(R) \right ) \end{equation}
subject to
 $n$
-by-
 $k$
partition matrices
 $R$
, in which
 $\hat \Lambda _{iv}(R)$
is given by (2). We note that the above function can be written as
 $L(R) = \sum _{j=1}^n \ell _{j Z_j}(R)$
, in which
 \begin{equation} \ell _{jv}(R) \ = \ \sum _{i=1}^m C_{ji}\left ( \hat \Lambda _{iv}(R) - M_{ji} \log \hat \Lambda _{iv}(R) \right ) \end{equation}
is a normalized minus log-likelihood of the data vector of node
 $j$
, given that
 $j$
is placed in community
 $v$
and the rate parameters are equal to
 $\hat \Lambda (R)$
. We note that
 $L(R)$
, up to an additive constant, equals to the description length of the data matrix
 $M$
in the sense of Shannon coding.
The same algorithm can be used also in case of data matrix with positive real values, which was already shown in (Reittu et al., Reference Reittu, Bazsó, Weiss, Fränti, Brown, Loog, Escolano and Pelillo2014). In this case, each matrix element
 $M_{ij}$
is treated as a parameter (the expectation) of a Poisson distribution. The
 $\Lambda$
-matrix is computed according to Equation (2) for each partition
 $R$
. Equation (3) also remains intact, and
 $L$
equals to Kullback–Leibler divergence between the corresponding Poisson distributions, the original with parameters from data matrix
 $M$
, and those with parameters from Equation (2). The task is to minimize
 $L$
which can be done with the same algorithm as in the integer case.
2.4 Regular decomposition algorithm
Minimizing the cost function in Equation (3) with respect to
 $R$
is a hard nonlinear discrete optimization problem with an exponentially large input space of the order of
 $\Theta (k^n)$
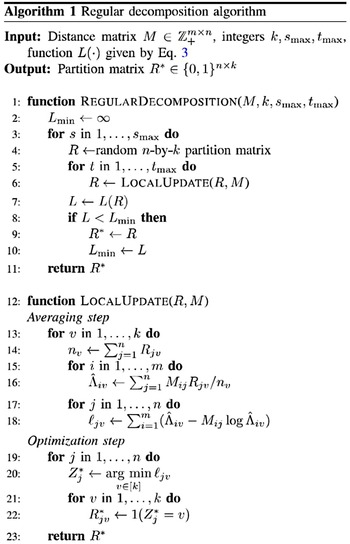
, making exhaustive search computationally infeasible. This is why we suggest solving the problem using a greedy Algorithm 1 which is an expectation maximization type algorithm which alternates between updating
 $\Lambda$
according to Equation (2) for a fixed
 $R$
(E-step) and updating the partition
 $R$
by greedily updating the community of each node, one by one, to minimize
 $\ell _{jv}(R)$
in Equation (4) for a fixed
 $\hat \Lambda$
(M-step). Starting from a uniformly random initial assignment
 $R_0$
, the algorithm finds a local optimum as a limit of the greedy algorithm. Running the greedy algorithm for several initial random states
 $R_0$
, and selecting the community assignment with smallest cost in Equation (3) as the final output.
Pseudocode for the regular decomposition algorithm according to Reittu et al. (Reference Reittu, Leskelä, Räty and Fiorucci2018).

The runtime of Algorithm 1 is
 $O(s_{\textrm{max}} t_{\textrm{max}} k (n+m))$
, where
 $s_{\textrm{max}}$
is the number of random initializations and
 $t_{\textrm{max}}$
is the number of iterations per optimization round. Especially, the runtime is linear in
 $n$
and
 $m$
for bounded
 $k,s_{\textrm{max}},t_{\textrm{max}}$
and is hence scalable for large data sets.
2.5 Boosted regular decomposition
Setting up the data matrix for Algorithm 1 may require costly preprocessing, for example computing distances between node pairs (see Section 2.7). The matrix
 $M$
may also be simply too large to be treated as a whole, a situation frequently encountered in the realm of so-called big data. In such cases, the algorithm can be boosted by replacing the data matrix
 $M$
by a submatrix
 $M_{VW}$
with a row set
 $V \subset [n]$
of size
 $n_0$
and a column set
 $W \subset [m]$
of size
 $m_0$
, and running Algorithm 1 with the submatrix
 $M_{VW}$
as input. This results in a partition matrix
 $R^*$
of the node set
 $V$
. A community assignment of the remaining node set is then computed in a subsequent classification phase where the community index of each node
 $j \in [n] \setminus V$
is chosen to be
 $v(j) \in [k]$
:
 \begin{eqnarray} v(j)=\text{arg min}_{v'\in [k]}\ell _{jv'}(R^*),\quad \ell _{jv'}(R^*) \ = \ \sum _{i \in W} C_{ji}\left ( \hat \Lambda _{iv'}(R^*) - M_{ji} \log \hat \Lambda _{iv'}(R^*) \right ), \end{eqnarray}
where
 \begin{equation*} \hat \Lambda _{iv}(R^*) \ = \ \frac {\sum _{j \in V} M_{ji}R_{jv}^*C_{ji}} {\sum _{j \in V} R_{jv}^*C_{ji}} \end{equation*}
is the observed average value of data item
 $i \in W$
among the nodes of
 $V$
classified into community
 $v \in [k]$
according to
 $R^*$
.
The runtime of Algorithm 1 applied to the submatrix
 $M_{VW}$
is
 $O(s_{\textrm{max}} t_{\textrm{max}} k (n_0+m_0))$
, and the runtime of the subsequent classification phase is
 $O(km_0 n)$
. Hence, the boosted RD algorithm has complexity
 $O(s_{\textrm{max}} t_{\textrm{max}} k (n_0+m_0) + k m_0 n)$
. The feasibility of this boosting approach requires that the row set
 $V$
is large enough to contain nodes from all communities, and the column set
 $W$
is a sufficiently informative collection of data items. A simple way of selecting
 $V$
and
 $W$
is by random sampling. This approach was developed in (Reittu et al., Reference Reittu, Leskelä, Räty and Fiorucci2018, Reference Reittu, Norros, Räty, Bolla and Bazsó2019) in which sufficient sample sizes were estimated and convergence proved in some model cases.
2.6 Estimating the number of communities
Algorithm 1 requires the number of communities
 $k$
as an input parameter. However, in most situations this parameter is not a priori known and needs to be estimated from the observed data. The problem of estimating the number of communities can be approached by recasting the maximum likelihood problem in terms of the MDL principle (Rissanen, Reference Rissanen1983; Grünwald, Reference Grünwald2007) where the goal is to select a model which allows a minimum coding length for both the data and the model. MDL adheres to the principle of Occam’s razor in which the best hypothesis follows the best compression of data, hence justifying the selection of MDL for this task.
When restricting to the model described in Section 2.2, then the
 $R$
-dependent part of the coding length equals
 $L(R)$
given by (3), and an MDL-optimal partition
 $R^*$
for a given
 $k$
corresponds to the minimal coding length
 \begin{equation*} R^* = \text {arg min}_{R} L(R). \end{equation*}
It is not hard to see that
 $L(R^*)$
is monotonously decreasing as a function of
 $k$
, and a balancing term, the model complexity, is added to select the model that best explains the observed data. The model complexity is the length of a code that uniquely describes the mode itself. In all of our experiments,
 $L(R^*)$
(the negative log-likelihood) as a function of
 $k$
becomes essentially a constant above some value
 $k^*$
. Such an elbow point
 $k^*$
is used as an estimate of
 $k$
in the experiments in this article, see also (Ketchen & Shook, Reference Ketchen and Shook1996). In general, it might be necessary to have a more sophisticated method using a model complexity term (Reittu et al., Reference Reittu, Bazsó and Norros2017a; Norros et al., Reference Norros, Reittu and Bazsó2022; Peixoto, Reference Peixoto2012). However, in examples we are using it suffices to use a simplified version of the MDL principle based on the elbow point.
2.7 Using distances as data items in multiplex networks
In a multiplex network consisting of
 $s$
directed graphs with a common node set, each graph represents one layer. The distance matrices of the layers are denoted by
 $D_1, \ldots, D_s$
. If layer
 $r$
contains no path from node
 $i$
to node
 $j$
, we declare the corresponding entry as missing by setting
 $(C_r)_{ij} = 0$
, and we may define
 $(D_r)_{ij} = 0$
without loss of generality. As a result, we obtain
 $s$
indicator matrices
 $C_1, \dots, C_s$
. When layers are undirected, data about path lengths are encoded in a concatenated data matrix
 \begin{equation} M \ = \ [D_1, D_2, \dots, D_s], \end{equation}
and the corresponding indicator matrix is
 $C = [C_1, C_2, \dots, C_s]$
. In case of directed layers, data about directed path lengths are encoded in matrix
 \begin{equation} M = \left[D_1, D_1^T, D_2, D_2^T, \dots, D_s, D_s^T\right], \end{equation}
where row
 $i$
of matrix
 $D_r$
(resp.
 $D_r^T$
) contains the shortest directed path lengths from
 $i$
to other nodes (resp. from other nodes to
 $i$
). The corresponding indicator matrix is denoted
 $C = \left[C_1, C_1^T, C_2, C_2^T, \dots, C_s, C_s^T\right].$
The data matrix
 $M$
and the indicator matrix
 $C$
are then given as input to Algorithm 1, and the optimal number of communities is determined as in Section 2.6.
Computing the distance matrix in an unweighted directed graph with
 $n$
nodes and
 $e$
links has complexity
 $O(n(n+e))$
using breadth-first search (Bang-Jensen & Gutin, Reference Bang-Jensen and Gutin2009). The RD algorithm based on distances can be boosted by computing distances only for a restricted set of reference nodes
 $W \subset [n]$
of size
 $m_0$
, resulting in an
 $n$
-by-
 $m_0$
distance matrix
 $D$
in which
 $D_{ij}$
equals the distance from node
 $i \in [n]$
to node
 $j \in W$
, and
 $D$
can be computed using breadth-first search in
 $O(m_0(n+e))$
time. The same complexity bound is valid for concatenated data matrices of form (6)–(7) in multilayer networks with a bounded number of layers. Then, we may apply the boosted RD algorithm (Section 2.5) with
 $V=[n]$
and
 $W$
as above. The total complexity of the preprocessing step (restricted distance matrix computations) and boosted RD algorithm then equals
 $O(s_{\textrm{max}} t_{\textrm{max}} k (n+m_0) + k m_0 n + m_0(n+e))$
. For bounded number of communities
 $k$
and bounded iteration parameters
 $s_{\textrm{max}},t_{\textrm{max}}$
, this bound is
 $O(m_0(n+e))$
. Especially, by selecting
 $m_0$
constant, we obtain a scalable algorithm for sparse massive networks with
 $e=O(n)$
, capable of identifying communities in linear time with respect to the number of nodes
 $n$
.
3. Power-law graphs
Most real networks are inhomogeneous. In particular, this is true for graphs where nodes posses features that correlate with graph topology. Furthermore, sparsity is commonplace, because links are expensive to maintain. Many real networks have highly varying degrees, with most nodes having a small number of neighbors, and very few nodes having a huge number of neighbors as was pointed out in (Barabási & Albert, Reference Barabási and Albert1999). The high-degree nodes usually play an important role as hubs in the network. Already two decades ago, a highly influential study by (Faloutsos et al., Reference Faloutsos, Faloutsos and Faloutsos1999) revealed that the Internet has this kind of topology.
In this section, we summarize a simple generative model for sparse random graphs with a power-law degree distribution (Section 3.1), and apply the RD algorithm to a synthetic graph sampled from the model, first using distances (Section 3.2) and then using distances and degrees (Section 3.3). Our aim is to show that the used data matrix has a profound effect on the community structure.
3.1 Poissonian power-law graph
A simple random graph model can be induced from a random graph process described in (Norros & Reittu, Reference Norros and Reittu2006; van der Hofstad, Reference van der Hofstad2017) which we call a Poissonian power-law graph. We first sample node attributes
 $\lambda _1, \dots, \lambda _n$
independently at random from a probability distribution on the non-negative reals and thereafter connect each unordered node pair
 $ij$
by a link with probability
 $1-\exp \{-\lambda _i\lambda _j/\lambda \}$
, independently of other node pairs, where
 $\lambda = \sum _i \lambda _i$
. When the node attributes are distributed according to a power-law with density exponent
 $\tau \in (2,3)$
, we obtain a generator of a sparse random graph where the degree distribution has a finite mean and infinite variance.
In such power-law graphs, quite a rich topological structure spontaneously arises in the limit of large graph size and with probability tending to one. The nodes are categorized into sets called tiers according to their degree, such groping we call “soft hierarchy” (Norros & Reittu, Reference Norros and Reittu2006; Reittu & Norros, Reference Reittu and Norros2004; Norros & Reittu, Reference Norros and Reittu2008b,a). The top tier
 $V_0$
is formed, asymptotically as
 $n\rightarrow \infty$
, by nodes with degrees in the range
 $(n^{1/2}, \infty )$
, and the other tiers
 $V_k$
are formed by nodes with degrees in range
 $(n^{\beta _k}, n^{\beta _{k-1}}]$
, in which
 $\beta _0 = 1/2$
and
 $\beta _k=(\tau -2)^k/(\tau -1)+o(1)$
for
 $k \ge 1$
. For large values of
 $n$
, it is known that with high probability, the top tier
 $V_0$
is fully connected, and further, every node in
 $V_k$
has a link to
 $V_{k-1}$
for all
 $k$
up to order
 $\log \log n$
(Norros & Reittu, Reference Norros and Reittu2006; van der Hofstad & Hooghiemstra, Reference van der Hofstad and Hooghiemstra2008; Reittu & Norros, Reference Reittu and Norros2002). The subgraph induced by the union of the tiers
 $V_k$
for
 $0 \le k \le \log \log n$
is called the core network. Most of the nodes have small degrees and, as a result, are outside the core. However, any node is at a very short distance, compared to
 $\log \log n$
, from the bottom tier. This explains ultra-short distances in the graph.
Our aim is to show, through experiments on synthetic and real data, that our version of the RD algorithm can identify soft hierarchical structures by using network distances and node degrees together as a data matrix. The soft hierarchy is a compact description of the organization of shortest paths between most of the nodes in power-law graphs of the type we are interested in. RD compresses the distance matrix, and that is why it is likely that a soft hierarchy shows up in the resulting short description of the matrix. Degrees are also essential in describing the soft hierarchy, and that is why their inclusion in data matrix should help. This is why we argue that a degree-augmented and distance-based community structure matches qualitatively with a kind of rough soft hierarchy in synthetic and real power-law graphs. Notably, in expectation
 $\mathbb{E}{\lvert \cup _k V_k\rvert }/n\rightarrow 0$
, see (Norros & Reittu, Reference Norros and Reittu2006; Reittu & Norros, Reference Reittu and Norros2002) as
 $n \to \infty$
, which means that communities associated with the layers are very small and which means that such communities are undetectable for typical community detection algorithms assuming comparable community sizes.
This illustrates how our method should be used. At first, there should be an intuitive understanding of which data are essential for the problem to be solved. In the current example, the problem is to find the soft hierarchy as a community structure. In other problems, the data matrix could be completely different.
3.2 Regular decomposition using distances
We generated a power-law graph with ten thousand nodes using the model in Section 3.1 with node attributes drawn from a power-law distribution with density exponent
 $\tau =2.5$
, and we extracted its largest connected component as input for subsequent analysis. As a result, we have a graph with
 $n=7775$
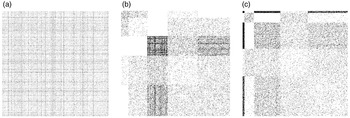
nodes and adjacency matrix shown in Figure 2(a). Next, we computed the distance matrix of this graph. We identified communities of the graph by applying Algorithm 1 using the distance matrix as data matrix. By experimenting with different values of the number of communities
 $k$
, we found that the cost function in Section 2.6 saturates at
 $k=5$
. This value is identified as the most informative number of communities.
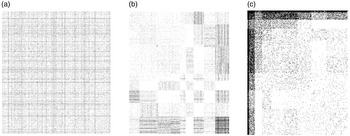
The adjacency matrix of a synthetic power-law graph (
 $n=7775$
) with rows and columns organized according to (a) random order of nodes, (b) communities identified by distance matrix, (c) communities identified by distance matrix and degrees (right).

The block structure of the adjacency matrix induced by the identified communities is shown in Figure 2(b). A clear block structure is revealed with one large block with relatively high density. All five identified communities are rather large. Hence, the identified community structure differs remarkably from the theoretical tier structure (Section 3.1) where the top layers are dense and small. This is a natural consequence of partitioning the graph using distance profiles because the small-degree neighbors of high-degree nodes are likely to have similar distance profiles with each other.
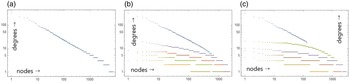
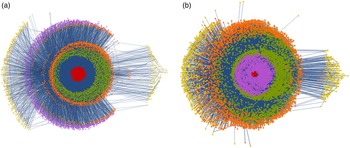
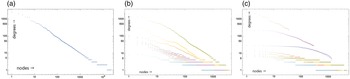
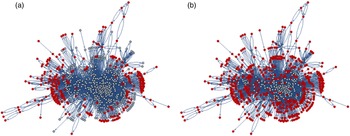
The degrees of the graph are plotted in Figure 3(a). The linear shape in the log-log plot on the left is typical for power-law graphs. The degrees of nodes in the five identified communities are shown in Figure 3(b). We see that all high-degree nodes are in the same community, but this community also contains nodes of smaller degree and is quite large. Furthermore, Figure 4(a) displays the graph with the five identified communities, plotted using Mathematica’s CommunityGraphPlot tool. We see that nodes in the red community are central for connecting nodes in the graph. The ring-like communities around the center appear to roughly play a role similar to tiers in a soft hierarchy, in that most shortest paths between peripheral nodes use the rings to reach the red center.
Degrees of nodes in a synthetic power-law graph (
 $n=7775$
) sorted from largest to smallest within each community (indicated by color). (a) Full graph viewed as one community. (b) Nodes organized into communities identified by distance matrix. (c) Nodes organized into communities identified by distance matrix and degrees.

Topology of a synthetic power-law graph (
 $n=7775$
) colored according to the community structure identified by the regular decomposition algorithm with (a) distance matrix, (b) distance matrix and degrees.

3.3 Regular decomposition using distances and degrees
We continue experimenting with partitioning the same graph sample as in the previous section. Instead of using the distance matrix with 7775 columns as in Section 3.2, we will now use a data matrix with only 101 columns, consisting of 100 randomly sampled columns of the distance matrix and 1 additional column containing the node degrees. The aim of this experiment is twofold. First, we wish to investigate how adding the degrees to the data matrix affects the inferred community structure. Second, we will demonstrate that computing distances to a relatively small set of reference nodes suffices to well characterize the distance profiles of most nodes.
The adjacency matrix organized according to five identified communities using the modified data matrix is shown in Figure 2(c). The main difference from the previous case shown in the middle of the same plot is a small central community with high-degree nodes only. This can be seen in Figure 3(c) which presents the node degrees grouped by communities. The blue community contains all high-degree nodes, and its degree sequence does not overlap with other communities. Nodes in the blue community may hence be thought as tier 1 nodes. As a result, the community structure is qualitatively closer to the theoretical tiers of the power-law graph. According to the theory, there are only
 $\Theta (\!\log \log n)$
tiers, we may expect only a couple of layers in our sample with
 $\log \log n = 2.19$
.
Figure 4(b) visualizes the identified communities from a topological point of view. The small and dense red community in the center corresponds qualitatively to the top tier of the theoretical power-law graph structure in Section 3.1. The second and third largest communities can be seen as tier 2 and tier 3 communities, and the remaining communities form the periphery of low-degree nodes. Incorporating degrees in the data matrix can hence substantially change the community structure and in our case align the communities better with a soft hierarchy of nodes.
4. Internet autonomous systems graph
We analyze the topology of the Internet by investigating a snapshot of the AS graph in 2006, reconstructed by Mark Newman from data collected by University of Oregon’s Route Views Project.Footnote 2 The graph has 22963 nodes (AS) and 48436 edges (neighboring AS pairs). The adjacency matrix and the degrees are plotted in Figures 5(a) and 6(a), respectively. The latter demonstrates an approximate power-law structure: six nodes have degree larger than 1000, whereas most nodes have degree less than 10. The graph has a soft hierarchical structureFootnote 3 with the most important nodes contained in tier 1, the second most important nodes in tier 2, and so on.
The adjacency matrix of the AS graph (
 $n=22963$
) with rows and columns organized according to (a) raw data, (b) communities identified by distance matrix, (c) communities identified by distance matrix and degrees.

Degrees of nodes in the AS graph (
 $n=22963$
) sorted from largest to smallest within each community (indicated by color). (a) Full graph viewed as one community. (b) Nodes organized into communities identified by distance matrix. (c) Nodes organized into communities identified by distance matrix and degrees.

4.1 Regular decomposition using distances
We partition the AS graph into communities by Algorithm 1 using
 $100$
randomly sampled columns of the distance matrix as data matrix. This appears sufficient for this type of network where we expect that the distances from a typical reference node depend heavily on the position of the node in the network hierarchy. Using the method in Section 2.6, we found that the most informative number of communities is
 $k=10$
. Figure 5(b) displays the adjacency matrix of the AS graph organized by the identified community structure, showing that the communities are all rather large and of comparable size. The link densities inside and between communities are all low and comparable to the overall link density. The degrees of nodes grouped into communities are displayed in Figure 6(b).
The results for the AS graph have similarities with the synthetic power-law graph in Section 3.2. For instance, although all high-degree nodes are in the same community, this community also contains many low-degree nodes and thus has a low internal density. This can be seen in Figure 6(b) where the degree sequences of different communities overlap. As a result, using only graph distances as the data matrix, we were not able to identify the tiers of the AS graph. For instance, the smallest community has much more nodes than there are tier 1 nodes3.
4.2 Regular decomposition using distances and degrees
We repeat the community identification experiment of the AS graph by augmenting the 100-column data matrix used in Section 4.1 with 1 column containing the node degrees. Again,
 $k=10$
is identified as the most informative number of communities. Figure 5(c) displays the adjacency matrix of the graph organized according to the identified communities. The resulting community structure substantially differs from the one in the previous section. The smallest two communities in Figure 5(c) are dense and approximately correspond to tier 1 and tier 2 subnetworks of the AS graph. The degree sequences of the communities are shown in Figure 6(c). There are three rather small and dense communities which contain all high-degree nodes, but no low-degree nodes.
To assess the quality of the identified communities, we determined the AS identities in the three smallest and densest communities using a list of AS networks3 and an AS lookup tool.Footnote
4
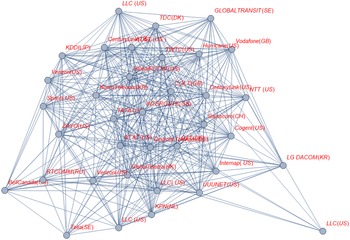
Our aim is to verify that the three identified communities are close to tier 1–3 subnetworks and contain the most important AS. The smallest identified community (Figure 7) contains
 $36$
nodes, out of which
 $23$
are tier 1 and the rest are tier 2. The members of tier 2 are important telecom carriers. For example, “Hurricane Electric”3 has a very high degree (
 $7061$
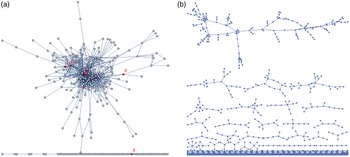
), which explains why it is included in the smallest community by the RD algorithm. The discrepancy between tier 1 and the smallest identified community may be due to the fact that the AS graph topology deviates from a simple power-law graph (e.g., Chen et al., Reference Chen, Chang, Govindan, Jamin, Shenker and Willinger2002). The second smallest identified community is shown in Figure 8(a). The largest degrees are around
 $200$
. In this community, the ten nodes of highest overall degree do not belong to tier
 $1$
, but nevertheless correspond to networks operated by major companies such as British Telecom (UK) and Microsoft (US). The third smallest community, displayed in Figure 8(b), is much sparser, and its highest degrees are around
 $20$
. Top-degree members are Telefonica Data S.A. (BR), Orano (US), and Harvard University (US).
Subgraph of the AS graph induced by the smallest community identified by regular decomposition using distances and degrees.

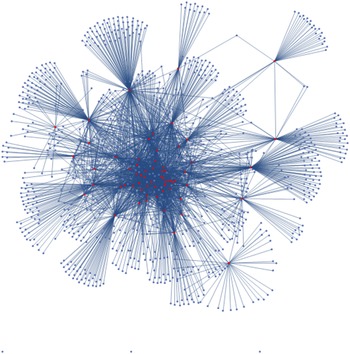
Subgraphs of the AS graph induced by the second (a) and third (b) smallest communities identified by regular decomposition using distances and degrees. Ten nodes of highest overall degree in the second smallest community are highlighted in red: 1. Net Access Corporation, 2. Microsoft, 3. London Interconnection Point, 4. BT, 5. Internet Initiative Japan, 6. Frontier Communications of America, 7. MCI Communications Services, 8. INAP, 9. TransTeleCom, and 10. Telstra.

We conclude that augmenting the graph distance matrix by a column containing the node degrees allows to identify much more meaningful communities, compared to only using the distance matrix. The RD method was able to identify central carriers in the top tiers with good accuracy from a large data set. In particular, we discovered a dense tier 1-rich subnetwork. The suggested method could be used even for extremely large graphs encountered in areas such as biology and social networks, where it might be impossible to acquire the entire graph for analysis. Our methods need only a limited sample of shortest paths between a set of sampled nodes and node degrees. Community detection on such a sample results in a model which can be used to classify any other node outside the sample. It has the potential to rapidly detect soft hierarchies in massive networks.
5. World airline graph
We demonstrate how the RD method can be applied to a directed multilayer graph defined as a collection of
 $s$
graphs with a common set of
 $n$
nodes, each graph representing one layer. As a concrete example, we used a world airline graphFootnote
5
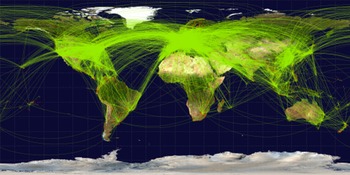
consisting of 3321 nodes (airports), 67663 links (flights), and 548 layers (airlines) displayed in Figure 9. We extracted the three largest airlines (American Airlines, United Airlines, Air France) in June 2014, resulting in a directed multilayer graph with
 $n=691$
nodes and
 $s=3$
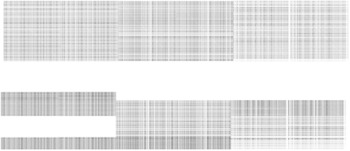
layers. Figure 10 displays the data matrix corresponding to the concatenation of three directed graph distance matrices and their transposes (see Equation 7).
Geographic projection of the world airline graph.

Top: Gray-scale visualization of the data matrix of the world airline graph. The white elements correspond to undefined distances. The matrix has
 $691$
rows (airports) and
 $4146$
columns (directed graph distances in three layers). Each layer occupies a band of columns of equal width and is roughly visible in the picture. Bottom: The same data matrix with rows reorganized into six communities identified by regular decomposition using layerwise distances.

5.1 Regular decomposition using layerwise distances
Using Algorithm 1 and the method in Section 2.6, we discovered
 $k=6$
as the most informative number of communities and identified the corresponding communities. The resulting data matrix, organized by the identified communities, is shown at the bottom of Figure 10. The smallest community has 9 nodes consisting of airports in the Middle East (4), Europe (2), East Asia (1), and South America (1). The second smallest community has 13 nodes consisting of airports in East Asia (5), Africa (3), South-East Asia (2), Pacific (2), and North America (1). The remaining four communities are of comparable size: One of them has 27 airports in France and 85 in USA, and the other three have most airports located in the USA.
6. Comparison with other community detection and data compression methods
In this section, we make a quantitative assessment of communities found by RD with respect to some other community detection and data analysis methods. As the test cases, we use the real-life networks analyzed in the previous Sections.
6.1 Community detection
6.1.1 Internet autonomous systems graph
As stated in the introduction, our aim is to have a community detection method which identifies communities which reflect various aspects of data associated with the network and their role in the graph topology. There are of course many existing powerful community detection methods which can do this in some particular cases. We illustrate this point by finding communities in the AS graph (Section 4) using two popular methods: modularity maximization and SBM fitting.
Modularity maximization (Newman, Reference Newman2006) aims to find densely connected communities which have as little as possible links between the communities. Figure 12(a) displays the adjacency matrix organized according to the 25 identified communities, and Figure 13 illustrates the subgraphs induced by the communities. As expected, the community structure determined by modularity maximization is substantially different from the community structures identified by RD in Figure 5(b–c). The subgraphs in Figure 13 do not respect the tiered structure found with RD. For instance, the high-degree nodes forming tier 1 are embedded in very large communities, which can be inferred from Figure 13.
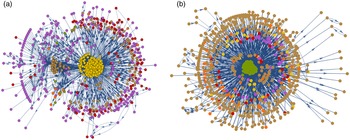
Communities of the world airline graph identified by (a) regular decomposition using layerwise distances, (b) SBM fitting with a layer-aggregated adjacency matrix.

Adjacency matrix of the AS graph organized according to (a) 25 communities identified by modularity maximization, (b) 10 communities identified by SBM fitting.

Subgraphs of the AS graph induced by the
 $25$
communities identified by modularity maximization.

SBM fitting (Zhao et al., Reference Zhao, Levina and Zhu2012) uses the adjacency matrix to find communities in which relations inside and between the communities are like those in classical random graphs. Information-theoretic model fitting can be used to find the communities. We used the RD method for this. For computational tractability, instead of the full adjacency matrix we restricted to the largest connected component of the subgraph induced by a uniform random sample of 10,000 nodes. After identifying the communities of the restricted graph, the parameters of the model were used to classify all nodes of the graph. A smaller sample is not feasible, because the resulting induced subgraph would hardly have any links. This is in stark contrast to RD using graph distances, where a sample of 100 nodes suffices. Figure 12(b) shows the resulting community structure, where a dense tier 1-like community appears, but a deeper tier hierarchy seems quite weakly represented, as manifested by a large unstructured block of low-degree nodes. In contrast, a much finer community structure is identified by RD based on distances and degrees in Figure 5(c). A typical subgraph induced by a pair of communities identified by SBM fitting is a well-connected graph in which one part is like a neighborhood of the other community, see Figure 14. On the other hand, in a community structure identified by distance profiles, such pairs are typically not connected—this is simply because many distances are larger than one.
A subgraph of the AS graph induced by two distinct communities (red, blue) identified by SBM fitting. The nodes of the blue community are almost entirely low-degree neighbors of the nodes in the red community.

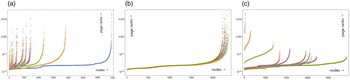
For a more quantitative comparison, we computed the PageRank centrality of the network nodes (with damping factor 0.8) and plotted in Figure 15 the PageRank distributions within communities identified by three methods: modularity maximization, RD using distances, and RD using distances and degrees. We see that the latter is the only method able to separate nodes of high PageRank into a common community. This illustrates the ability of our method in identifying community structures associated with the topological roles of nodes in the network.
PageRank centrality of AS graph nodes in communities identified using three alternative methods and sorted from smallest to largest within each community (indicated by color). (a) Modularity maximization, (b) RD using distances, (c) RD using distances and degrees. Only the last method can group the most central nodes into separate communities, indicated by blue and orange circles in (c).

6.1.2 World airline graph
We compare the community structure of the world airline graph determined in Section 5.1 with a more customary SBM fitting applied to the adjacency matrix of the undirected graph obtained by collapsing the layers and ignoring link directions. We impose the same number
 $k=6$
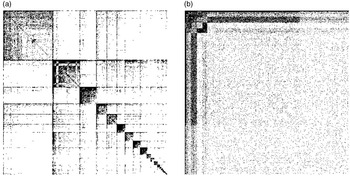
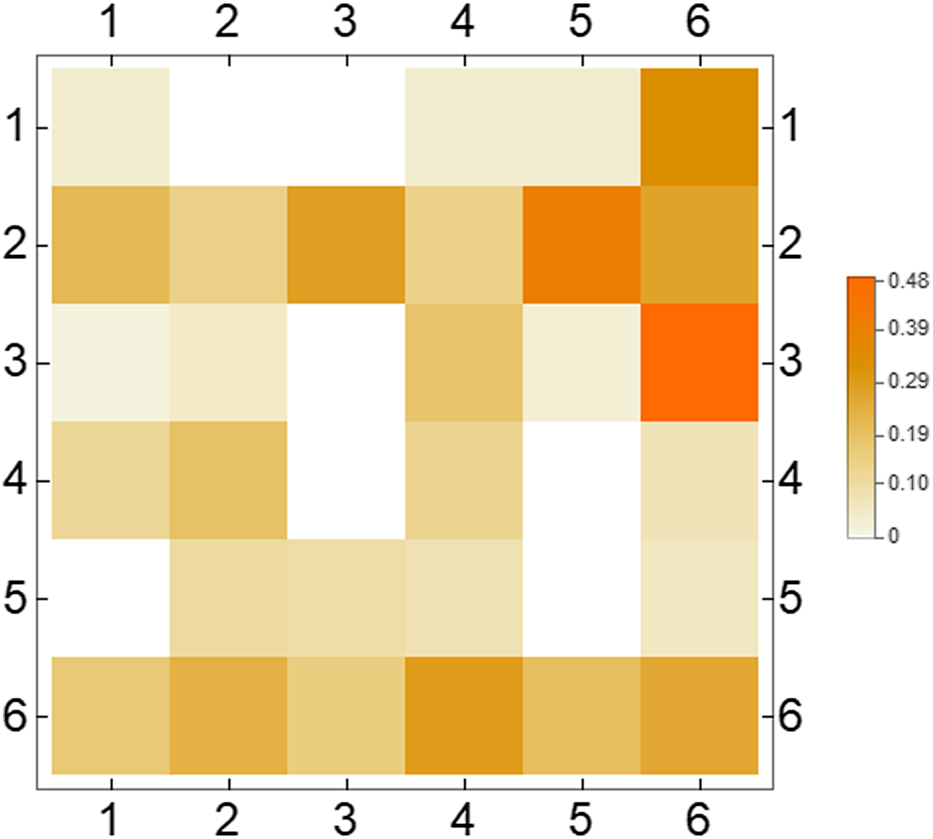
of communities as previously. The resulting community structure, visualized in Figure 11(b), bears some similarity with the one in Figure 11(a), but mostly in the periphery of the network which forms the largest community in both cases. The peripheral communities are highlighted in Figure 16. Furthermore, Figure 17 displays the overlap matrix of communities. The overlap is weak, and the community structures are quite different. If the community structures were similar, there should be at each row exactly one strong element in this matrix and those strong elements would be all in different columns.
Largest community (highlighted in red) of the world airline graph identified using (a) regular decomposition using layerwise distances, (b) SBM fitting with a layer-aggregated adjacency matrix.

Overlap of communities determined by SBM fitting using layer-aggregated graph (row index) and by regular decomposition using layerwise distances (column index). The
 $(i,j)$
-entry is computed as the number of common nodes in community pair
 $(i,j)$
divided by the number of nodes in the larger community in the pair. Only the pair
 $(3,6)$
indicates a substantial value around
 $0.5$
. This pair corresponds to the peripheral communities highlighted in Figure 16.

6.2 Data compression
A natural measure of our method is the compression rate of the data matrix used in community detection. This experiment is done on the distance matrix for the AS graph. As the uncompressed description length, we used Mathematica’s internal memory requirement for storing a distance matrix (ByteCount), which for the AS graph equals
 $L_0 \approx 1.7 \times 10^{10}$
bits. First, as a standard compression, we applied Mathematica’s built-in implementation of the zlibFootnote
6
algorithm. Second, we computed the description length
 $L$
for the distance matrix by applying RD. This consists of the Shannon code length, which is minus base-2 logarithm of the probability of the distance matrix in the probabilistic model induced by the community structure, and the code lengths of the parameters. We used the leading part of the prefix code lengths of integers (Grünwald, Reference Grünwald2007). For a positive integer
 $m$
, the code length of the integer is
 $ \lceil \log _2 m \rceil + \lceil \log _2\log _2 m \rceil +\cdots$
, in which
 $\log _2$
is iterated as long as the result remains positive, after which the sum is truncated. The parameters we need to encode are the expectations of
 $k\times n$
Poisson variables,
 $k=10$
, and
 $n=22963$
, and the partition into communities which can be represented as an
 $n$
-vector with coordinates in
 $\{1,\dots,10\}$
. Third, we computed similar code length for community structure found using node degrees along with the distance matrix. The compression ratio
 $L/L_0$
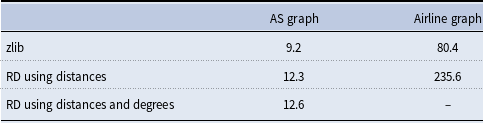
is displayed in Table 1. We see that zlib compresses the original data by around
 $9$
times while RD using distances does a better job with around
 $12$
times compression. Augmenting the RD by also using degrees leads to a slight further improvement.
Compression ratio for the AS graph and the world airline graph using three methods: zlib compression algorithm, RD using distances, and RD using distances and degrees

We also repeated this experiment for the world airline graph for which the uncompressed layerwise distance matrix requires
 $L_0 \approx 5.5 \times 10^8$
bits. The zlib algorithm compresses this data by around
 $80$
times, while RD on the layerwise distance matrix is able to compress
 $235$
times, almost three times more than zlib, see Table 1.
7. Conclusion
We demonstrated a unified approach of finding network communities in large and sparse multilayer graphs, based on extending the RD method to handle data matrices with an arbitrary number of columns representing various types of data associated with nodes. We demonstrated our method by analyzing graph distance matrices augmented with a column of node degrees. Our method has a low computational complexity allowing to handle massive input graphs, and it also tolerates missing data entries. We illustrated the method with a synthetic power-law graph and two real graphs: a snapshot of the Internet topology and a directed multilayer graph describing the world airline topology. In the latter case, as data matrix we used a concatenation of graph distance matrices from different layers, which allowed to find meaningful communities despite massive amounts of missing data. In contrast to popular community detection methods, such as modularity maximization and SBM fitting, our method appears better suited for identifying community structures aligned with tiered hierarchies often encountered in scale-free complex networks. When applied to distance matrices, our method implicitly assumes that graph distances are Poisson-distributed and mutually independent. This assumption was motivated by computational tractability instead of a good fit to data. However, because graph distances in scale-free networks are known to be highly concentrated around their mean even for heavy-tailed degree distributions (van der Hofstad et al., Reference van der Hofstad, Hooghiemstra and Znamenski2007; van der Hoorn & Olvera-Cravioto, Reference van der Hoorn and Olvera-Cravioto2018), the Poisson assumption may not be overly unrealistic. For carrying out a theoretical analysis of consistency of our method applied to distance matrices, an important future problem is to first analyze joint distributions of distances in degree-corrected SBMs, extending state-of-the-art result obtained for random graphs without communities (Bhamidi et al., Reference Bhamidi, van der Hofstad and Hooghiemstra2017; Jorritsma & Komjáthy, Reference Jorritsma and Komjáthy2020). Although the experiments carried out in this work were restricted to topological data matrices that can be deduced from the graph adjacency matrix, the RD method allows to incorporate an arbitrary number of auxiliary columns to the data matrix. This opens up ways to analyze and model network problems in which nontopological node-associated data play an important role in forming graph communities and remains an important problem of further study.
Acknowledgments
We thank Remco van der Hofstad for illuminating discussions, Mark Newman for commenting on the AS graph data set, and anonymous referees for helpful remarks on improving the presentation. We thank the action editor and anonymous referees for helpful remarks and suggestions. VTT’s part of this work was supported by BusinessFinland—Real-Time AI-Supported Ore Grade Evaluation for Automated Mining and Quantum Technologies Industrial (QuTi) projects.
Competing interests
None.