I. INTRODUCTION
Since O'Regan and Grätzel's first report in 1991, DSSCs have attracted considerable interest as potential candidates to replace conventional Si-based solar cells in specialized applications because of low manufacturing cost and easy fabrication.Reference Oregan and Grätzel1–Reference Prasittichai and Hupp4 As well known, the metal platinum is widely used as counter electrode (CE) in the traditional dye-sensitized solar cells (DSSCs). However, its high cost restricts the large-scale production of DSSCs although to date the highest energy conversion efficiency of 12.3% has been reported.Reference Yella, Lee, Tsao, Yi, Chandiran, Nazeeruddin, Diau, Yeh, Zakeeruddin and Grätzel5 Hence, searching for low-cost and flexible conductive material acted as CE to substitute for platinum has been a crucial issue in photovoltaic research. Inorganic compound semiconductors, such as CoS,Reference Wang, Anghel, Marsan, Ha, Pootrakulchote, Zakeeruddin and Grätzel6 NiS2,Reference Li, Gong, Zhou and Wang7 SnSx,Reference Chen and Yang8 PbS,Reference Park, Koo, Yoon, Hwang, Kang, Park and Hyeon9 MoS2,Reference Tai, Liu, Chou, Chien, Lin and Lin10 as well as some carbon materials,Reference Fang, Fan, Kim, Kim, Kim, Chaudhari, Ko and Yu11 have potential applications as cathodes for DSSCs. Among various metal sulfides, nickel sulfide (NiS) is more favorable in terms of abundant resource, low toxicity, and excellent electric conductivity.Reference Pan, Xie, Liu, Cao, Zhu and Zhao12 Nickel sulfide has many polymorphs, such as the alpha form with a hexagonal unit cell and the beta form with a rhombohedral cell. Although NiS nanoparticles were reported to have a band gap of 3.53 eV measured via UV-visible spectroscopy,Reference Sohrabnezhad, Pourahmad, Sadjadi and Zanjanchi13 it is still black at room temperature and has a low metal/insulator transition temperature (252 K)Reference Larsson14 and the high temperature phase of NiS is a metal.Reference Larsson14 In addition, the raw materials used for the preparation of NiS are accessible to get. Furthermore, NiS owns high energy conversion efficiency and its preparation method is simple.Reference Ku and Han15,Reference Sun, Qin, Huang, Guo, Li, Luo and Meng16
Controlling the shape, size, and structure of inorganic nanomaterials is of fundamental importance because of the strong correlation between these parameters and physical/chemical properties.Reference Ghezelbash, Sigman and Korgel17,Reference Hupp and Poeppelmeier18 The formation of nanocrystal is a kinetically controlled process that can yield nanorods and other complicated shapes, such as nanowires, nanosheets, and nanocrystals, with some degree of shape tunability through changes in the reaction parameters such as temperature, reaction time, concentration, and capping-ligand chemistry.Reference Gou, Cheng, Shi, Zhang, Peng, Chen and Shen19,Reference Abdelhady, Malik, O'Brien and Tuna20 In this work, we reported two different nickel sulfide phases (α-NiS and β-NiS) composed of nanorods and nanoparticles that were easily synthesized by a one-step solvothermal method with different solvents. Our research reveals that the DSSC with an α-NiS CE performs much better than the one with a β-NiS CE.
II. EXPERIMENTAL SECTION
A. Synthesis of NiS microarchitectures
NiS samples were synthesized by a one-step solvothermal method with different solvents and the same combination of nickel source and sulfide source. A typical synthesis procedure was as follows: 0.001 mol of Ni(CH3COO)2·4H2O and 0.003 mol thiourea were in turn added into 30 mL absolute ethyl alcohol (for α-NiS) or 30 mL distilled water (for β-NiS) with thorough magnetic stirring and then followed by ultrasonication for 20 min. Subsequently, the resulting solution was transferred into a 50 mL Teflon-lined stainless steel autoclave. The autoclave was sealed and maintained at 200 °C for 48 h. After cooling to room temperature naturally, the obtained black precipitate was filtered off, washed with absolute ethanol and distilled water for several times, and finally dried in a vacuum at 60 °C for 12 h.
B. Characterization
The phase purity and crystallographic structure of the as-prepared products were characterized by a XD-3 x-ray powder diffractometer equipped with monochromatized Cu Kα radiation (λ = 1.5406 Å) at 36 kV and 25 mA. Scanning electron microscopy (SEM) images were carried out with a Hitachi S-4800 scanning electron microscope (Hitachi Inc., Japan). Transmission electron microscopy (TEM) images were performed on a JEOL JEM-100SX transmission electron microscope (JEOL, Japan) at an acceleration voltage of 200 kV. The UV-vis spectra were recorded on a liquid Hitachi U-4100 spectrophotometer (Hitachi Inc., Japan). The photocurrent density versus photovoltage (J–V) curves were determined using a xenon lamp solar simulator under AM 1.5 illuminations (Continuous Solar Simulator for PV Cells) and measured under 100 mW cm−2 calibrated beforehand by an optical powermeter. Incident photon-to-electron conversion efficiency (IPCE) was measured using a Solar Cell Spectral Response QE/IPCE Measurement System (PV Measurements, Inc., Boulder, CO) from 300 to 800 nm with a xenon lamp (300 W, AM 1.5). For electrochemical impedance spectroscopy (EIS) and polarization measurements, the symmetrical dummy cells were assembled with two identical CEs filled with the same electrolyte as used in the DSSCs. To evaluate the photoelectric performance of the current DSSCs with NiS as CEs, a DSSC with Pt as CE was also assembled to make a comparison. All the measurements were performed on an electrochemical workstation (CS350, CORRTEST, Wuhan, China) at room temperature.
C. Preparation of CEs
A NiS CE was typically prepared by dispersing NiS powder (0.1 g) and polyethylene glycol powder (0.025 g) in 1 mL absolute ethanol, and then ground with an agate mortar fully to form a colloid. Afterward, the colloid was coated on the fluorine-doped tin oxide (FTO)-coated glass via the doctor-blading technique followed by drying naturally and annealing at 375 °C for 1 h under the protection of nitrogen. The thickness of the obtained film is about 5–6 μm.
D. DSSCs fabrication
Additionally, TiO2 slurry (Wuhan Georgi Science Instrument Co., Ltd., China) was also pasted at the FTO-coated glass cleaned with acetone, absolute ethanol, deionized water, and 40 mM TiCl4 solution in the same way. The thickness of the obtained film is about 10 μm. It was annealed at 450 °C for 30 min in air after drying, and then cooled down to 70 °C and immediately soaked to the configured N719 solution for 12 h. Subsequently, the photoanodes were assembled with the as-prepared CEs. The electrolyte containing 0.5 M LiI, 0.6 M 1-propy1-2,3-dimethylimidazolium iodide, 0.05 M I2, and 0.5 M 4-tert-buylpyridine with acetonitrile as the solvent was then injected. It should be mentioned that all the DSSCs were assembled with the same method and with the same raw components such as anodes, dye, and electrolyte except for the different CEs (α-NiS, β-NiS, and Pt).
III. RESULTS AND DISCUSSION
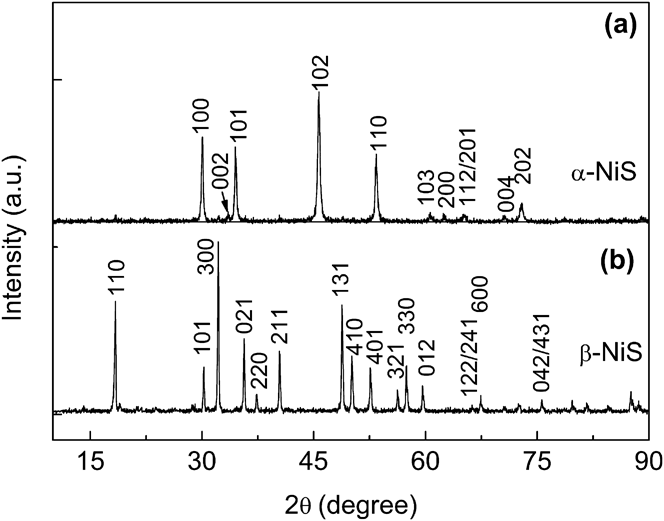
Figures 1(a) and 1(b) show the XRD patterns as-synthesized of NiS using absolute ethyl alcohol and distilled water as solvents, respectively. The space group of the as-prepared product of Fig. 1(a) is P63/mmc and the cell parameters (a = b = 3.420 Å, c = 5.300 Å) are also in good agreement with the literature data (Card No. 750613). While the space of the as-prepared product of Fig. 1(b) is R 3m and the cell parameters (a = b = 9.619 Å, c = 3.149 Å) are in good agreement with the literature data (Card No. 862281). No impurity phase is detected for the two patterns. The former is α-NiS and the latter is β-NiS which has a rhombohedral structure of the millerite phase.Reference Ghezelbash, Sigman and Korgel17
XRD patterns of NiS synthesized with different solvents: (a) absolute ethyl alcohol and (b) distilled water.

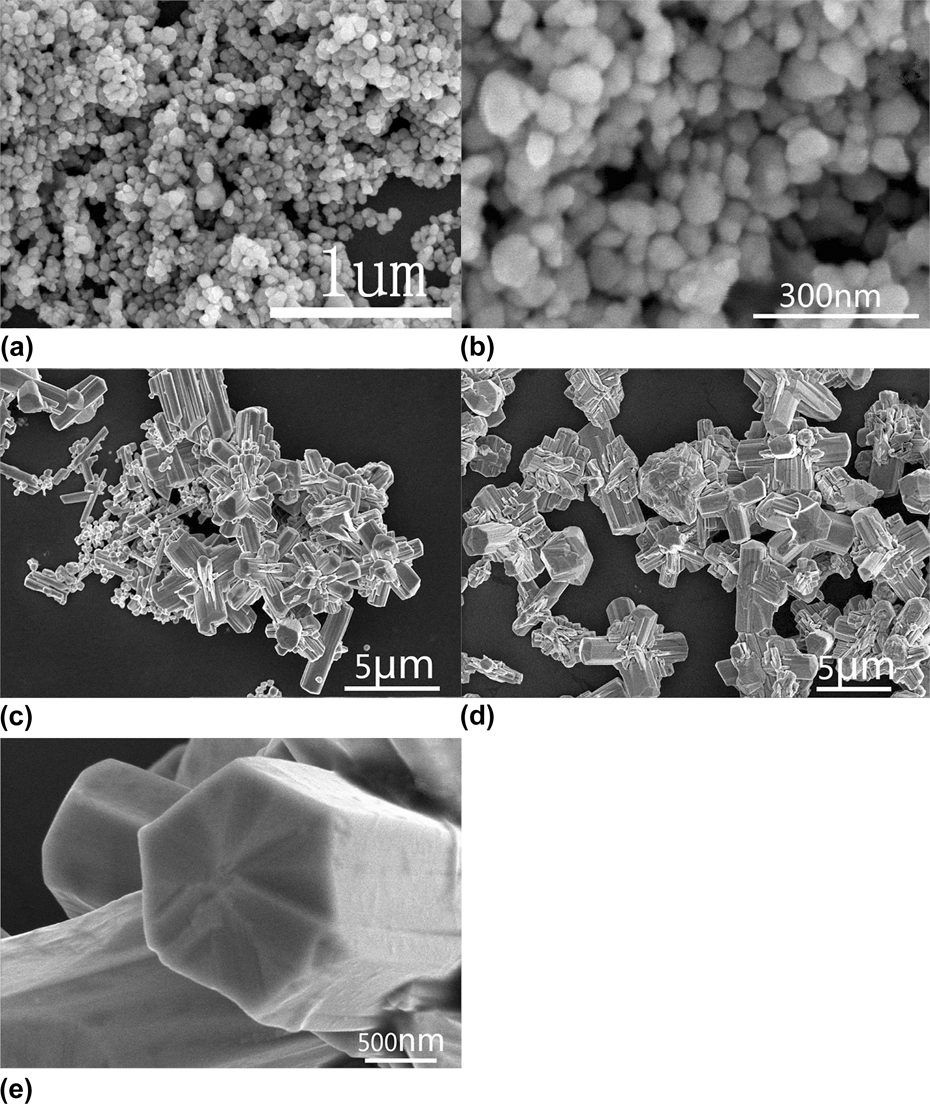
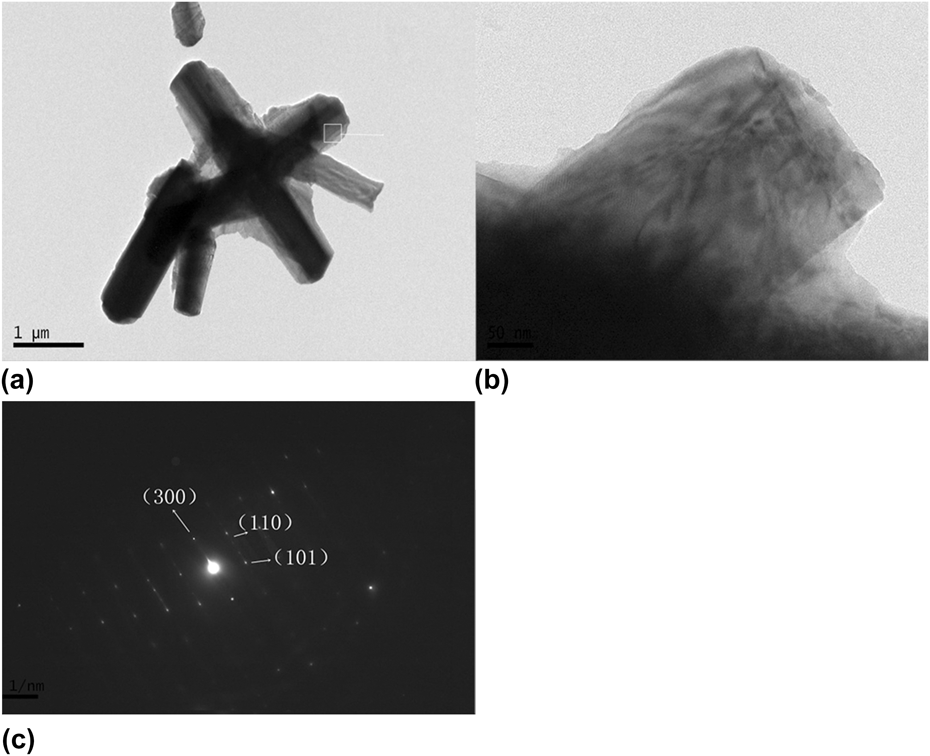
Figures 2(a) and 2(b) depict the morphologies of α-NiS synthesized with absolute ethyl alcohol as solvent. They have a sphere-like shape with the diameter about 50–80 nm. The SEM images of β-NiS synthesized with distilled water present cross-like shapes, see Figs. 2(c)–2(e). It can be seen that cross-like β-NiS architectures are composed of nanorods with a shape of hexagonal prism. The nanorods are 2–5 μm in length and 1000 nm in diameter. Microstructural analysis for β-NiS was carried out by TEM, shown in Fig. 3. It can be seen that the nanorods are well single-crystallized. Unfortunately, TEM measurements could not be well performed on α-NiS, since it is easy to melt when electron beam focused on it.
SEM images of NiS synthesized with different solvents: (a) and (b) absolute ethyl alcohol as solvent; (c), (d), and (e) distilled water as solvent.
TEM (a), HRTEM (b), and electron diffraction (c) images of NiS synthesized with distilled water.
The saturated vapor pressure of alcohol (2958.72 kPa at 200 °C) is much higher than that of distilled water (1554.77 kPa at 200 °C). When alcohol and distilled water are heated, the pressure in the absolute ethyl alcohol rises faster and this has great impact on the morphology of the graininess samples. The cross-like samples synthesized with distilled water could be attributed to Ostwald ripening process.Reference Roosen and Carter21 In another way, many nanoparticles with different sizes appear in the solution at the early stage of reaction. With the reaction proceeding continuously, assembled nanoparticles with a relatively larger size may serve as the crystal nucleus. Then the nanoparticles with a smaller size would dissolve and recrystallize at the site of the larger nanoparticles because nanoparticles with smaller size own higher surface free energy.Reference Li, Chai, Wang, Xi, Liu and Qian22 Nickel sulfide crystals grow preferentially in a certain direction and then cross-like β-NiS comes into being. Note that there is a good repeatability for the same routine experiments. A controllable synthesis for two phases by selecting different solvents is realized.
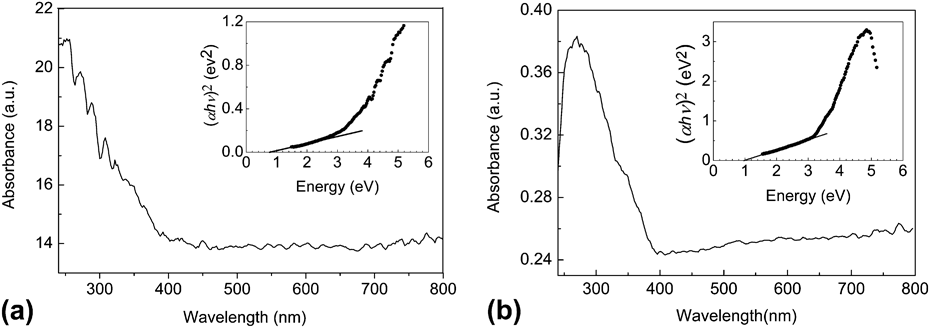
The optical properties of the as-obtained α-NiS and β-NiS samples are characterized by the UV-vis spectra.Reference Du, Yin, Zhu, Huang, Wu, Zeng, Yan and Zhang23Figure 4(a) shows the absorption spectrum of α-NiS particles. A peak located at about 254 nm and many weak shoulders located around 270 nm, 288 nm, and 308 nm are clearly seen. The spectra in Fig. 4(b) show a strong absorption of β-NiS particles in the ultraviolet region. There is an absorption peak at around 269 nm. The spectrum absorption is shifted to much higher energy (∼4.8 eV) compared to that of bulk NiS (∼2.1 eV).Reference Hu, Chen, Chen, Lin and Li24 Similar phenomena were also observed by Hu et al.Reference Nakamura, Fujimori, Sacchi, Fuggle, Misu, mamori, Tamura, Matoba and Anzai25 This remarkable blue-shift (about 2.7 eV) can probably be attributed to the small dimensions or well-ordered array of the NiS walls.Reference Hu, Chen, Chen, Lin and Li24 Bulk NiS is an inorganic semiconductor with a direct band gap. The band gaps for the two phases of NiS can be estimated by a plot of (αhν)2 versus hν (α = absorbance, h = Planck's constant, and ν = frequency),Reference Nyari, Barvinschi, Bǎies, Vlǎzan, Barvinschi and Dekany26 shown as insets in Fig. 4. The band gap of α-NiS and β-NiS is about 0.8 eV and 1.0 eV, respectively, bigger than that of nonmetallic phase of NiS (0.2–0.3 eV).Reference Okamura, Naitoh, Nanba, Matoba, Nishioka, Anzai, Shimoyama, Fukui, Miura, Nakagawa, Nakagawa and Kinoshita27 Certainly, the reason may be that the band gap of the NiS is also relevant to its size and microstructure, so called blue-shift. Usually, with the dimension reduction as well as quantum size effect, blue shift appears. Although NiS nanoparticles were once reported to have a band gap of 3.53 eV measured via UV-visible spectroscopy,Reference Sohrabnezhad, Pourahmad, Sadjadi and Zanjanchi13 it is still black at room temperature and has a low metal/insulator transition (252 K) temperatureReference Larsson14 and the high temperature phase of NiS is a metal.Reference Larsson14 Taking our results and Hu'sReference Nakamura, Fujimori, Sacchi, Fuggle, Misu, mamori, Tamura, Matoba and Anzai25 into consideration as well as Okamura's report,Reference Okamura, Naitoh, Nanba, Matoba, Nishioka, Anzai, Shimoyama, Fukui, Miura, Nakagawa, Nakagawa and Kinoshita27 it is reasonable to infer that the band gap reported by SohrabnezhadReference Sohrabnezhad, Pourahmad, Sadjadi and Zanjanchi13 for NiS nanoparticles is not the band gap of NiS.
UV-vis absorption spectra and the band gap value which was estimated by a related curve of (αhν)2 versus photon energy plotted of NiS synthesized with different solvents: (a) absolute ethyl alcohol and (b) distilled water.
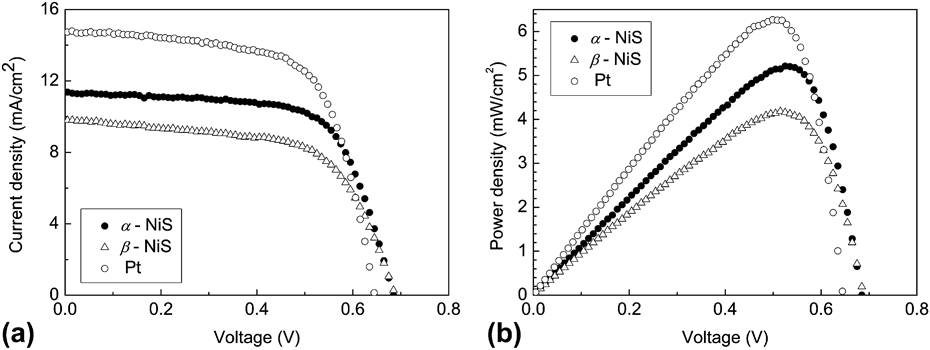
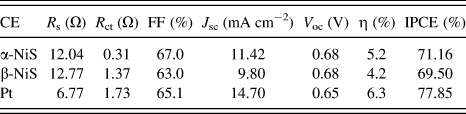
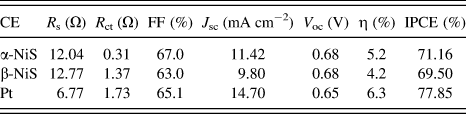
DSSCs were fabricated using NiS with two different phases as CEs mentioned above and Pt as a CE for comparison. Photocurrent density (J) versus photovoltage (V) and energy conversion efficiency curves of different morphologies of NiS CEs and Pt CE in acetonitrile solutions containing 10 mM LiI, 10 mM I2, or 0.1 M LiClO4 as the supporting electrolyte are shown in Fig. 5. The short-circuit current densities (J sc) are 11.4 mA cm−2 and 9.8 mA cm−2 for the two kinds of DSSCs with NiS as CEs, respectively. But the open circuit voltage (V oc) is 0.68 V for both of them. Figure 5 also depicts that DSSCs using α-NiS as CE yields a conversion efficiency (η) of 5.2%, which is much better than that of β-NiS (η = 4.2%) with an increase of one quarter. For a comparison, the DDSC with Pt as CE was also fabricated and measured. J sc = 14.7 mA cm−2, which is larger than those of DSSCs with NiS as CEs. But the open circuit voltage for the DDSC with Pt as CE is 0.63 V, which is little smaller than those of DSSCs with NiS as CEs. However, the conversion efficiency η = 6.3% for the DSSC with Pt as CE, which is larger than those of DSSCs with NiS as CEs. After a simple calculation, the filling factors (FF) for the three DSSCs are 67.0% (α-NiS), 63.0% (β-NiS), and 65.1% (Pt), respectively. The filling factor may reflect the output characteristics of solar cells, which is an important parameter. There are many factors influencing the value of FF. Among them, the series resistance is dominated. The rise of the series resistance reduces FF and, consequently, so does the efficiency of the solar cell.
J–V curve (a) and P–V curve (b) of NiS synthesized with different solvents.
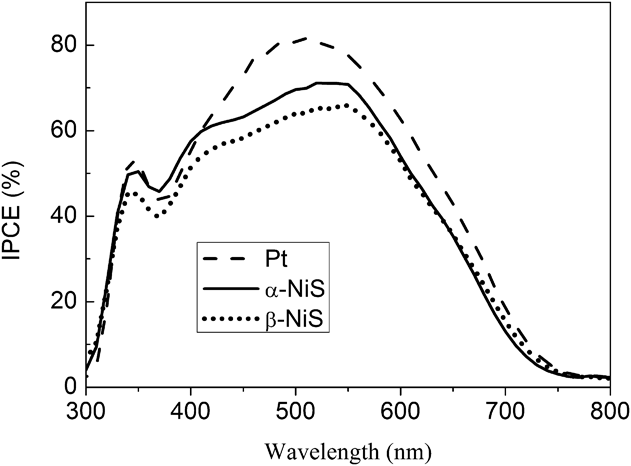
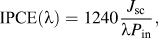
The IPCE spectra of devices with different CEs are shown in Fig. 6. The IPCE curve (λ) could be defined as
 $${\rm{IPCE}}\left( {\rm{\lambda }} \right) = 1240{{{J_{{\rm{sc}}}}} \over {{\rm{\lambda }}{P_{{\rm{in}}}}}}{\rm{,}}$$
where J sc is the short circuit current density (mA cm−2), λ is the wave length, and P in is the incident light power density (mW cm−2). The device with α-NiS exhibited a little higher IPCE (71.16%) compared to the β-NiS DSSC (65.90%). In addition, the IPCE plotted as a function of excitation wave length of Pt-coated FTO cell reaches a value of 77.85%. Moreover, the photocatalytic performances of different CEs were consistent with the value estimated from IPCE curve on the whole.Reference Cho, Hwang, Kim and Jang28–Reference Grätzel30
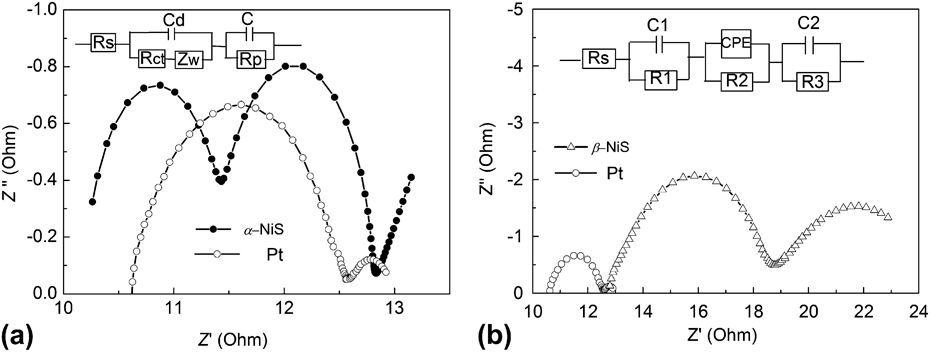
Nyquist plots of EIS for the symmetrical cells and the equivalent circuits fabricated with (a) α-NiS and (b) β-NiS film, respectively, and sputtering Pt for comparison.
To analyze the behavior mentioned above, the EIS was carried out under I−/I3− electrolyte to analyze the internal resistance of α-NiS, β-NiS, and Pt in the DSSCs. Figure 7 shows the Nyquist plots for the symmetrical cells fabricated with three identical CEs (α-NiS, β-NiS, and Pt). Also, we propose an equivalent circuit for modeling DSSCs based on the results of EIS analysis used to fit the experimental EIS data. The charge transfer resistances R ct of α-NiS, β-NiS, and Pt are 3.1 Ω, 6.148 Ω, and 1.734 Ω, respectively. The comparable charge transfer resistances of α-NiS and β-NiS to Pt play a major role in the observed conversion efficiencies. As is well known that the catalytic activity of the electrodes can be reflected from the R ct in the electrode/electrolyte interface, which is directly proportional to the diameter of the semicircle in the high-frequency regions.Reference Jiang, Li and Gao31,Reference Nazeeruddin, Kay, Rodicio, Humphry-Baker, Muller, Liska, Vlachopoulos and Grätzel32 The high-frequency intercept represents the series resistance of DSSCs (R s), which is mainly composed of three resistance elements, namely, the sheet resistance of the FTO, the resistance of ionic diffusion in the electrolyte, and the resistance at the interface between the CE and the electrolyte. The R s of α-NiS and β-NiS CEs are 12.04 Ω and 12.77 Ω, bigger than that of Pt CEs (6.767 Ω), which means that electrical conductivity is not as good as Pt CE. The detailed photovoltaic parameters for three DSSCs are listed in Table I.
IPCE spectra of DSSCs with NiS CEs and Pt-plated FTO CE.
EIS parameters of the dummy cell and properties of the DSSCs assembled with two identical CEs of α-NiS and β-NiS.
There are two reasons for DSSCs prepared with α-NiS as CE own higher conversion efficiency than β-NiS as CE. One is that the charge transfer resistance R ct of α-NiS is smaller than that of β-NiS, the other is that the particle size of α-NiS is much smaller than nanorods of β-NiS. The smaller the size of particles, the larger the specific surface area is. With the increase of specific surface area of α-NiS, the conversion efficiency reaches a higher value. On the other hand, although nickel sulfides show a higher redox activity,Reference Zhang, Zhang, Cui, Feng and Zhu33 all of the DSSCs with them as CEs show lower conversion efficiencies than that with a Pt plate as CE (current value, η = 6.3%). It is known to all, the Pt plate itself also acts as a light reflector and increases the operation rate of light and could, thus, remarkably improve the efficiency of the solar cells.Reference Nazeeruddin, Kay, Rodicio, Humphry-Baker, Muller, Liska, Vlachopoulos and Grätzel32 However, if taking the convenience and low cost of DSSCs with NiS as CEs into consideration, the current reported DSSC with α-NiS as CE paves one route for designing and applying low-cost Pt-free CE materials in DSSC from inorganic nanostructures.
IV. CONCLUSION
In summary, we successfully prepared two phases of NiS (α-NiS and β-NiS) nanoarchitectures via a facile solvothermal method with different solvents and applied them as the novel CE materials for DSSCs by a doctor-blading technique. In the synthesis process, the morphologies and microstructures of the NiS can be controlled by using different solvents. After the test, we conclude that the conversion efficiency of DSSCs with α-NiS as CE is 5.2%, whereas the one with β-NiS as CE is 4.2%.
ACKNOWLEDGMENTS
This work was financially supported by National Natural Science Foundation of China (11174002) and by ‘211 Project’ of Anhui University.