INTRODUCTION
The link between the sward structure and the ingestive behaviour of animals, such as bite dimensions (area, depth and volume), bite mass, bite rate and intake rate, plays a central role in the spatio-temporal dynamics of grazing systems. Because herbage intake, as a function of a set of ingestive behaviour variables, has consequences not only for fitness and production of animals, but also for the post-grazing structure and production of vegetation, quantifying the effects of the sward structure on the ingestive behaviour of animals is critical for a better understanding of plant–animal interactions and gaining a higher level of control of the management of grazing systems.
A number of studies have investigated the ingestive behaviour of animals grazing grasses. These studies have shown that the height and bulk density are the major determinants of ingestive behaviour among the complex of sward canopy characteristics. An increase in the sward height increases the bite area, bite depth, bite volume, bite mass and intake rate and decreases the bite rate (Black & Kenney Reference Black and Kenney1984; Burlison et al. Reference Burlison, Hodgson and Illius1991; Laca et al. Reference Laca, Ungar, Seligman and Demment1992; Gong et al. Reference Gong, Lambert and Hodgson1996 b; Naujeck & Hill Reference Naujeck and Hill2003). An increase in the sward bulk density decreases the bite area, bite depth, bite volume and bite rate, but increases the bite mass and intake rate (Black & Kenney Reference Black and Kenney1984; Burlison et al. Reference Burlison, Hodgson and Illius1991; Laca et al. Reference Laca, Ungar, Seligman and Demment1992; Casey et al. Reference Casey, Laidlaw, Brereton, McGilloway and Watson2004). At the same time, the shape of the response and the interactive effect between the two canopy attributes vary with plant species.
Most previous studies on the ingestive behaviour of animals on grasses have used temperate (cool-season, C3) species; a few have dealt with tropical (warm-season, C4) species. Furthermore, most previous studies on tropical grasses have used tufted (i.e. caespitose) species such as dallis grass (Paspalum dilatatum Poir.; Laca et al. Reference Laca, Ungar, Seligman and Demment1992) and guinea grass (Panicum maximum Jacq.; Benvenutti et al. Reference Benvenutti, Gordon and Poppi2006; Drescher et al. Reference Drescher, Heitkönig, Raats and Prins2006). A few studies have dealt with stoloniferous or rhizomatous species even though there are several economically important species with these growth habits. Black & Kenney (Reference Black and Kenney1984) used kikuyu grass (Pennisetum clandestinum Hochst. Ex Chiov.), a tropical stoloniferous and rhizomatous species, but artificially modified the sward structure by threading the top two leaves of tillers through holes in a board. This may not have represented the natural structure of the grass in the field. Thus, information on the ingestive behaviour of animals grazing the tropical stoloniferous or rhizomatous grasses is limited, despite their importance as a forage resource (Skerman & Riveros Reference Skerman and Riveros1989; Moser et al. Reference Moser, Burson and Sollenberger2004).
The aim of the study was to quantify the relationships between sward height and short-term ingestive behaviour of cattle grazing tropical stoloniferous grasses. Because there is further variation in the growth form among stoloniferous grasses (ascending, semi-prostrate and prostrate; McCusker Reference McCusker, Mallett and Orchard2002), two species with contrasting forms were used: a highly prostrate (short and high bulk density) species and a more erect (taller and less dense) one. Turves extracted from field-grown monocultures were used to offer animals a sward of natural structure.
MATERIALS AND METHODS
Two experiments were conducted at the Sumiyoshi Livestock Science Station (31°59′N, 131°28′E; 10 m asl), Faculty of Agriculture, University of Miyazaki, southern Kyushu, Japan, under the approval of the Animal Care and Use Committee (no. 2004-022-2). Each experiment included two grass species with different sward heights (created using different durations of re-growth following mowing) as treatments, implemented in the daily rounds of turf extraction, feeding and sward and animal measurements. The feeding phases of Expts 1 and 2 were conducted in early June and mid-September 2005, respectively.
Grasses
The two tropical stoloniferous grasses used in the study were centipede grass (Eremochloa ophiuroides (Munro) Hack.; (CG)) and bahia grass (Paspalum notatum Flügge; (BG)). CG was chosen as an extreme of a prostrate growth form (Beard Reference Beard1973). This species forms a short, highly dense sward (see Fig. 2 in Islam & Hirata (Reference Islam and Hirata2005) for a photo of a sod), with the height rarely exceeding 200 mm and the bulk density (>30 mm height) generally ranging from 2500 to 5000 g dry matter (DM)/m3 and sometimes exceeding 8000 g DM/m3 (Hirata et al. Reference Hirata, Islam, Harada, Furuya and Sakou2008 a, Reference Hirata, Sakou, Terayama, Furuya and Nanbab, Reference Hirata, Yamamoto and Tobisa2010 a). BG was used for comparison. This species is more erect, taller and less dense than CG. The sward height can exceed 250 mm and the bulk density (>30 mm height) is usually below 2500 g DM/m3 (Hirata et al. Reference Hirata, Islam, Harada, Furuya and Sakou2008 a, Reference Hirata, Sakou, Terayama, Furuya and Nanbab, Reference Hirata, Yamamoto and Tobisa2010 a). Some agronomic information on the two grasses (e.g. origin, distribution, cultivation and utilization) has been provided in previous papers (Hirata et al. Reference Hirata, Islam, Harada, Furuya and Sakou2008 a, Reference Hirata, Sakou, Terayama, Furuya and Nanbab).
Animals
Three Japanese Black cows were used throughout the two experiments. The mean live weight of the cows at the time of Expt 1 was 494 kg (s.e. 12 kg). The animals were tame and accustomed to the feeding procedures and diets by daily training during one week prior to the feeding phase in each experiment (4–6 turves/animal/day). When not being tested or trained, they grazed freely on pastures dominated by CG or BG in the daytime (09·00–16·00 h Japan standard time (JST)), as members of a herd of 28–33 cows. All animals spent the rest of the day (16·00–09·00 h JST) in a barn with provision of water.
Preparation and pre-grazing measurements of turves
Monocultures of CG and BG (about 200 m2 each) were used for turf preparation. The two grasses were sown in May 2003 and received uniform management until the study. Management included five cuttings (monthly from June to October) and a single application of fertilizer (early September; 30 kg N, 13 kg P and 25 kg K/ha) in 2003; and four cuttings (April, July, September and November) and two split applications of fertilizer (early May and late July; 30 kg N, 13 kg P and 25 kg K/ha each) in 2004. In 2005 (the study year), the grasses received two split applications of fertilizer (late April and late June; 30 kg N, 13 kg P and 25 kg K each).
Twelve plots (1·5×2·5 m each; six for each experiment) in each of three replicated blocks were laid out on each of the two grasses (total of 72 plots) and randomly allotted to treatments of varying re-growth periods. The plots for Expt 1 were cut to a height of 30 mm above the ground level 1, 2, 3, 4 or 5 weeks before feeding in early June. A further set of plots remained uncut since the final harvest in late November in the previous year. The plots for Expt 2 were cut to 30 mm in late June (immediately before the second application of fertilizer) and again 1, 3, 5, 7 or 10 weeks before feeding in mid-September. A further set of plots remained uncut following the late-June cut (13 weeks re-growth).
In the morning (07·00–08·00 h JST) of each feeding day, 18 turves (500×500 mm) of the same grass (CG or BG) were extracted from the 18 plots to a depth of c. 140 mm (six re-growth periods×three replicated blocks) using a sharp-edged steel shovel and placed in plastic containers (650×500×140 mm, 3·2 kg). Each turf weighed 20·4 kg on an average (s.e. 0·5 kg), excluding the container. The pre-grazing sward height was measured at 30 random positions within each turf. The entire surface of each container was wiped cleanly to remove any soil or plant material, thus ensuring that there was nothing that could be detached between turf weight measurements to produce biased weight changes.
At the same time, herbage in a 500×500 mm area was cut to 30 mm above the ground level in all plots using scissors and stored in a refrigerator (<10°C) until sorting. Each herbage sample was sub-sampled (0·20–0·30 of the weight) and separated into seed heads, leaves (laminae), stems (inclusive of leaf sheaths) and dead material. The separated samples were oven dried at 85°C for 48 h for the determination of DM weight. Sward bulk density was calculated as the herbage mass divided by sward height less 30 mm (sampling height of vegetation). The unseparated portions of the samples were oven dried (85°C, 48 h), weighed and ground to pass through a 1-mm screen. Dry matter digestibility (DMD) was determined with the pepsin-cellulase technique and corrected by a calibration equation to give predicted in vivo DMD (Goto & Minson Reference Goto and Minson1977). Crude protein (CP) concentration was determined as Kjeldahl N×6·25 (AOAC 1984). The quantity and quality of vegetation were not determined for BG swards of 13-week re-growth in Expt 2, because these tall senescent swards were not grazed by any of the animals.
Feeding procedures and post-grazing measurements of turves
Daily feeding comprised three continuous sessions. In each session, one animal was sequentially offered turves of all maturity levels (six re-growth periods) of the same grass (CG or BG) from the same field block. Both the sequence of the animals and the sequence of the turves offered to each animal were randomized for each feeding day. The first feeding session of each day commenced between 09·00 and 10·00 h JST, and each session lasted for 30–40 min. The animals were fasted for approximately 15 h until 07·00 h JST to minimize a date effect and a residual effect of the previous day's feeding on responses to the treatments (Flores et al. Reference Flores, Laca, Griggs and Demment1993). Then they were allowed to graze a sward (10×10 m) of the same grass (CG or BG) as the turves offered on that day for c. 2 h prior to the feeding session in order to minimize a hunger effect on ingestive behaviour, because previous studies have shown that fasted cattle have a greater bite mass, biting rate and/or intake rate than unfasted animals (Greenwood & Demment Reference Greenwood and Demment1988; Dougherty et al. Reference Dougherty, Bradley, Cornelius and Lauriault1989; Dumont et al. Reference Dumont, Petit and D'hour1995; Patterson et al. Reference Patterson, McGilloway, Cushnahan, Mayne and Laidlaw1998).
Each turf was weighed three times using an electronic precision balance (GP-30KS, A&D Company, Tokyo; capacity, 31 kg; resolution, 0·1 g): immediately before and after being offered to the animal, then after being returned to the feeding station for c. 3 min in the absence of grazing. Animals were allowed to take 10 bites per turf in order to minimize overlapping bites. The grazing process was video recorded (VDR-M70K, Panasonic, Osaka) to measure the time spent biting with a precision of 0·033 s using a computer with timing software. Any intervals in which animals interrupted both biting and chewing were excluded from the determination of time spent biting (Gong et al. Reference Gong, Hodgson, Lambert and Gordon1996 a), although such interruptions were rare. The time per bite was calculated as the time spent biting divided by the number of bites. Evapotranspiration weight loss for each turf over the interval between the pre- and post-feeding weight measurements was estimated from the time (h, min, s) of the three weight measurements and the turf weight loss under no grazing. Lifting of the turves during biting by the animals was not observed, because the turves were sufficiently heavy.
The post-grazing sward height (i.e. grazed height) was measured at 30 random positions within grazed imprints for each turf. The grazed area was determined by tracing the defoliation imprints onto a transparent acrylic board placed above the turf. The turf was then trimmed at the average grazed height, and the sample was weighed immediately after the harvest and again after being oven-dried at 85°C for 48 h, to estimate the DM concentration of the grazed horizon. The bite area was calculated as the grazed area divided by the bite number. The bite depth was obtained as the difference between the mean pre- and post-grazing sward heights derived from the 30-position measurements. The bite volume was estimated as the product of the bite area and the bite depth. Bite mass (DM) was computed as

The instantaneous intake rate was obtained as the bite mass divided by time/bite.
Data analysis
ANOVA was performed to evaluate the effects of grass species, re-growth period (linear and quadratic) and their interaction on sward characteristics (height, mass, bulk density, DMD and CP) (no re-amalgamation of non-significant interactions into the ANOVA model). The response of bite area, bite depth, bite volume, bite mass and intake rate (A B, D B, V B, M B and I, respectively; shown as Y in the following equation) to sward height (H) was evaluated by fitting a rectangular hyperbola to the data with iteration:

where the parameters a, b and c indicate the maximum of Y (asymptote), offset for H and steepness of response (half-maximal response when H=b+c), respectively. The offset for H (parameter b) reflects the minimum height to which animals are able to access and take bites. The time per bite (T B) was regressed against bite mass (M B) instead of sward height, because of the direct effect of bite mass on time per bite and the inappropriateness of a rectangular hyperbola for a dependent variable having no near-zero values. A broken-line function, which reflects compound (manipulative plus chewing) jaw movements (Laca et al. Reference Laca, Ungar and Demment1994; Ungar Reference Ungar, Hodgson and Illius1996), was fitted to the data with iteration:

where the parameter a represents the time per bite until the bite mass reaches a critical value [=(a−b)/c] (manipulative requirements limiting), and b and c are the parameters for increasing the time per bite beyond the critical bite mass (chewing requirements limiting). All analyses were performed using STATISTICA (version 6.1; StatSoft, Tulsa, OK, USA) and JMP (version 4.0.5; SAS Institute, Cary, NC, USA).
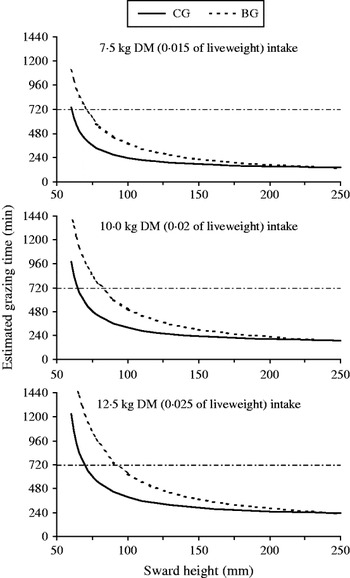
The grazing time required to achieve daily intakes of 0·015, 0·02 and 0·025 of live weight for a 500 kg animal grazing CG and BG of various heights was estimated using regression relationships between the intake rate and sward height (rectangular hyperbolas described earlier) and previous information that Japanese Black cows on CG and BG spent 0·869 and 0·815 of grazing time residing (biting) in feeding stations (0·131 and 0·185 moving between feeding stations; Hirata et al. Reference Hirata, Sakou, Terayama, Furuya and Nanba2008 b). A live weight of 500 kg followed the mean live weight of the test cows (494 kg), and the three levels of intake (0·015, 0·02 and 0·025 of live weight) followed the Japanese feeding standard for beef cattle (AFFRCS 2000) which reports that the daily DM requirement of a 500 kg Japanese Black cow is 6·5 kg (0·013 of live weight) at a maintenance level and increases up to 13·4 kg (0·027) depending on the terrain (grazing activity), pregnancy stage and milk production.
RESULTS
Sward characteristics
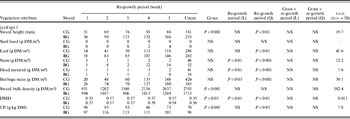
All major sward characteristics were significantly (P<0·05) affected by the grass species or re-growth period or both, except for seed head mass in Expt 1 (Table 1). Within species, sward height and mass of leaves, stems, dead material and whole herbage increased linearly and/or quadratically with increasing duration of re-growth in both experiments. In contrast, longer re-growth periods exceeding 1 week led to a decrease in CP in both experiments. Compared with BG, the CG swards were shorter and had lower DMD (Expt 1), CP concentration (Expt 1), stem mass (Expt 2) and herbage mass (Expt 2). The reverse applied for sward bulk density in both experiments and seed head mass and DMD in Expt 2.
Vegetation characteristics of swards offered to animals


L, linear effect; Q, quadratic effect; DM, dry matter; DMD, dry matter digestibility; CP, crude protein; CG, centipede grass; BG, bahia grass.
Sward bulk density above 30 mm height.
NS, not significant P>0·05.
Responses of ingestive behaviour to sward height
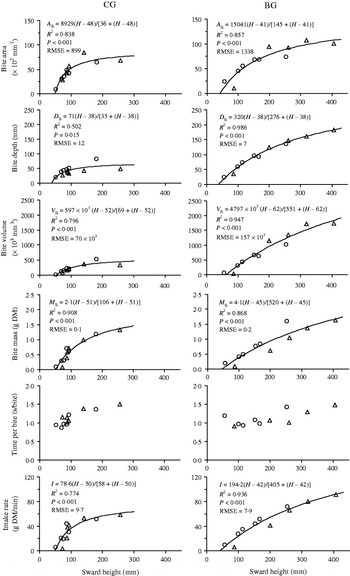
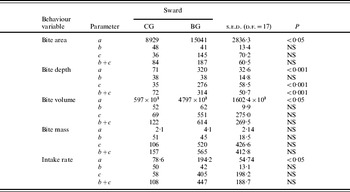
Bite area, bite depth, bite volume, bite mass and intake rate of animals increased at a declining rate as the sward height increased for both grasses. The relationships were best described by rectangular hyperbolae (P<0·001 except bite depth on CG (P<0·05), Fig. 1). The response of each variable to sward height tended to be initially steeper, plateau earlier (at a lower sward height) and reach a lower maximum in CG than in BG, although the maximum value (parameter a) and the sward height for half maximal response (parameters b+c) were not always statistically different at P<0·05 between the two species (Table 2). The offset height (parameter b) was always similar for the two species showing a common minimum accessible height.
Responses to sward height of bite area, bite depth, bite volume, bite mass, time per bite and intake rate of cattle grazing CG (left) and BG (right) in Expts 1 (circle) and 2 (triangle). RMSE, root mean square error.

Parameter values for the response of ingestive behaviour to sward height

CG, centipede grass; BG, bahia grass.
See text (rectangular hyperbola equation) and Fig. 1 for the parameters.
NS, not significant P>0·05.
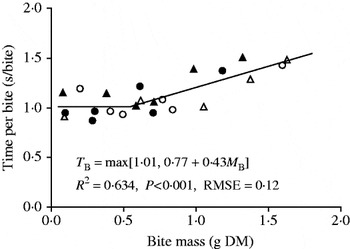
The time per bite increased in response to the increasing sward height in both species, with a greater initial rate of increase in CG than in BG (Fig. 1). The mechanism behind this phenomenon was clarified by regressing the time per bite against bite mass instead of sward height (see Materials and Methods). In relation to the increasing bite mass, the time per bite was constant until the bite mass reached a critical value (0·55 g DM) and thereafter increased linearly with bite mass, showing a significant (P<0·001) fit of a broken-line to data pooled over the two grasses (Fig. 2).
Relationship between time per bite and bite mass of cattle grazing CG (closed symbols) and BG (open symbols) across Expts 1 (circle) and 2 (triangle). RMSE, root mean square error.

Potential impact of sward height on daily herbage intake
The estimated grazing time required for achieving the three levels of daily intake increased as the sward height decreased in both CG and BG, with a steeper increase in BG than in CG (Fig. 3). It was shown that animals would be able to achieve the intakes within a relatively short period (140–281 min), similar for the two species, when the sward height ranges between 200 and 250 mm. However, when the sward is shorter than 200 mm, animals on BG would need longer grazing times than those on CG to attain the same intake. Animals would not be able to achieve the intakes within a 12 h period when the sward height falls below a critical level, which was estimated to be lower on CG than on BG; 61 v. 71 mm, 65 v. 81 mm and 70 v. 92 mm for intakes of 0·015, 0·02 and 0·025 of live weight, respectively.
Estimated grazing time required to achieve daily intakes of 0·015, 0·02 and 0·025 of live weight for a 500 kg animal grazing CG (solid curve) and BG (broken curve) swards of various heights. Grazing time exceeding the horizontal line (12 h) indicates when the sward height seriously limits daily intake.

DISCUSSION
Sward characteristics
The contrasting growth forms between CG and BG were well reflected in the height and bulk density of the swards (Table 1). In the same re-growth period, CG was always shorter and denser than BG. Sward bulk density (>30 mm height) of CG and BG varied from 457 to 4024 and 436 to 1715 g DM/m3, respectively. These values are within the range reported for grazed pastures dominated by these species (Hirata et al. Reference Hirata, Islam, Harada, Furuya and Sakou2008 a, Reference Hirata, Sakou, Terayama, Furuya and Nanbab, Reference Hirata, Yamamoto and Tobisa2010 a).
Taking an account of the 0–30 mm layer biomass obtained from other measurements for the two monocultures used in the current study (300 and 100 g DM/m2 for CG and BG, respectively, means of early July and late September; M. Hirata, unpublished results), sward bulk densities of CG and BG above the ground level are estimated to be 4010–6250 and 1050–2250 g DM/m3, respectively. A comparison of these densities with the 140–2000 and 1600–4100 g DM/m3 ranges summarized for tropical and temperate grasses (>0 mm height; Stobbs Reference Stobbs1975) indicates that CG is exceptionally dense for grasses even including temperate species, while BG is almost as dense as other tropical grasses (i.e. sparser than most temperate species).
Response of ingestive behaviour to sward characteristics
The observation that the bite dimensions, bite mass and intake rate increase with the sward height in CG and BG (Fig. 1) is in line with the findings of previous studies (Black & Kenney Reference Black and Kenney1984; Burlison et al. Reference Burlison, Hodgson and Illius1991; Laca et al. Reference Laca, Ungar, Seligman and Demment1992; Gong et al. Reference Gong, Lambert and Hodgson1996 b; Naujeck & Hill Reference Naujeck and Hill2003). However, the shapes of the responses differed between the two species. The early plateau seen in the response on CG is in stark contrast to the linear (or nearly linear) or exponential increase observed for animals on most other grasses (Burlison et al. Reference Burlison, Hodgson and Illius1991; Laca et al. Reference Laca, Ungar, Seligman and Demment1992; Gong et al. Reference Gong, Lambert and Hodgson1996 b; Naujeck & Hill Reference Naujeck and Hill2003). Although no plateau was observed in the bite depth, bite volume, bite mass and intake rate for BG as the sward height increased up to c. 400 mm, there should be a plateau beyond this range, because the capacity of animals to respond must be subject to limits.
Black & Kenney (Reference Black and Kenney1984) using hand-constructed swards of perennial ryegrass showed that the bite mass and intake rate of sheep increased more steeply and plateaued earlier as the sward height increased on denser swards. Laca et al. (Reference Laca, Ungar, Seligman and Demment1992), using hand-constructed swards of dallis grass and lucerne, found depressive effects of sward bulk density on the rate of increase in bite dimensions of cattle in response to increasing sward height. Thus, the early plateauing, low maximal response of ingestive behaviour of animals grazing CG (Fig. 1) is attributed to the high sward bulk densities (4010–6250 g DM/m3 above the ground level) of this strongly prostrated grass, as discussed above. The fact that sward bulk density was higher in taller swards (Table 1) is taken to have contributed to the clear plateau shape.
Previous studies have shown that an increase in sward bulk density decreases the bite area, bite depth, bite volume and bite rate, and increases bite mass and intake rate (Black & Kenney Reference Black and Kenney1984; Burlison et al. Reference Burlison, Hodgson and Illius1991; Laca et al. Reference Laca, Ungar, Seligman and Demment1992; Casey et al. Reference Casey, Laidlaw, Brereton, McGilloway and Watson2004). The difference in the shape of the ingestive behaviour responses to sward height between CG (more dense) and BG (less dense) was most obvious for bite depth (Table 2). This suggests that animals have difficulty in penetrating the muzzle deep into a highly dense sward, perhaps because the buccal cavity is readily filled by dense vegetation with insertion of the muzzle. Another possibility is that the dense vegetation imposes a physical resistance to insertion of the muzzle, although such a barrier effect has been reported only for stems (Flores et al. Reference Flores, Laca, Griggs and Demment1993; Ginnett et al. Reference Ginnett, Dankosky, Deo and Demment1999; Benvenutti et al. Reference Benvenutti, Gordon and Poppi2006; Drescher et al. Reference Drescher, Heitkönig, Raats and Prins2006). The physical properties of herbage down the canopy profile must be determined to reveal the cause.
The different shapes of the response of time per bite to sward height between CG and BG are attributed mainly to the different fashions of bite mass increase with height (Fig. 1), because the variation across the two grasses almost disappeared when time per bite was related to bite mass (Fig. 2). The significant fit of a broken-line function confirms that cattle are able to perform compound jaw movements that gather herbage into the mouth (manipulative jaw movement) and chew herbage already in the mouth (chewing jaw movement) within one cycle of opening and closing of the jaws (Laca et al. Reference Laca, Ungar and Demment1994; Ungar Reference Ungar, Hodgson and Illius1996; Ungar et al. Reference Ungar, Ravid, Zada, Ben-Moshe, Yonatan, Baram and Genizi2006), although there was a lower critical bite mass in the present study (0·55 g DM) than in the earlier study (1·28 g DM; Laca et al. Reference Laca, Ungar and Demment1994), which cannot be fully explained by the lower live weight of animals (494 v. 750 kg).
Agricultural and ecological implications
Sward height is an important criterion in the management of grazing systems. The present study illustrates the potential impact of the shape of the intake rate response to sward height (Fig. 1) on daily herbage intake by animals (Fig. 3). Studies on grasslands report that the daily grazing time in cattle rarely exceeds 12 h (Arnold & Dudzinski Reference Arnold and Dudzinski1978; Vallentine Reference Vallentine1990; Fraser & Broom Reference Fraser and Broom1997). Hence, daily intake by animals may be restricted when sward height is lower than the critical levels, 61–70 mm for CG and 71–92 mm for BG. Animals on BG would need to increase the grazing time to compensate for lower intake rates and attain similar daily intakes as on CG, when the sward height is above the critical level and below about 200 mm. These results indicate an advantage of CG over BG when grazed at a relatively low height (<200 mm), although this advantage may be reversed at a relatively high height (>300 mm) due to the lower maximum intake rate for CG than for BG (Fig. 1, Table 2).
There is usually a negative relationship between the height or quantity and quality of vegetation (Wilmshurst et al. Reference Wilmshurst, Fryxell and Hudson1995; Cid & Brizuela Reference Cid and Brizuela1998; Bergman et al. Reference Bergman, Fryxell, Gates and Fortin2001; Hirata et al. Reference Hirata, Ogura, Hasegawa and Maćešić2007, Reference Hirata, Nakayama and Tobisa2010 b), which was confirmed in the current study as a decrease in CP with an increase in the sward height and herbage mass for re-growth periods exceeding 1 week (Table 1). This relationship has been widely accepted to impose a quantity–quality trade-off in animals, i.e. a taller sward with a higher herbage mass provides animals with a higher intake rate (availability constraint), but lower diet quality (digestive constraint). Owing to such a trade-off, it has been estimated that herbivores can maximize daily net energy gain (intake minus expenditure) or minimize daily foraging time for daily energy requirement when they graze vegetation of intermediate height and herbage mass (Wilmshurst et al. Reference Wilmshurst, Fryxell and Hudson1995; Bergman et al. Reference Bergman, Fryxell, Gates and Fortin2001). The earlier plateau of intake rate with increasing sward height in CG than in BG (Fig. 1) suggests that animals can optimize quantity and quality of intake at a lower sward height when they graze CG than BG, permitting maximization of net energy gain or minimization of foraging time. Further studies are warranted to measure quantity and quality of herbage intake on CG and BG swards and test this hypothesis.
It is well known that both domestic and wild ungulates often concentrate their grazing on small areas of grassland (patch grazing; Vallentine Reference Vallentine1990) to produce grazing lawns where short, dense, young vegetation develops (McNaughton Reference McNaughton1984; Cid & Brizuela Reference Cid and Brizuela1998). McNaughton (Reference McNaughton1984) discussed the fact that grazers can increase both the rate and quality of intake by creating and maintaining grazing lawns. The results from the current study support the advantage of grazing lawns to animals, and suggest that strongly prostrated, highly dense grasses should be grazed at shorter heights than more erect, less dense grasses, in order to ensure both quantity and quality of intake.
This work was supported by a Grant-in-Aid for Scientific Research from Japan Society for the Promotion of Science (No. 16580222). We wish to thank Yukihiro Nakayama, Kozue Murakami and Kayo Yamamoto for field assistance. David Chapman, University of Melbourne, provided constructive comments on an earlier version of the manuscript.