1. Introduction
Disruptions are an endemic and possibly unavoidable problem for tokamaks (ITER Physics Expert Group on Disruptions, Plasma Control and MHD & ITER Physics Basis Editors 1999; Hender et al. Reference Hender, Wesley, Bialek, Bondeson, Boozer, Buttery, Garofalo, Goodman, Granetz and Gribov2007). The stored thermal energy and magnetic energy are, respectively, lost during the thermal quench (TQ), with heat loads hitting on the first wall and then the current quench (CQ), with electromagnetic (EM) forces acting on the conducting in-vessel components and generation of runaway electrons (REs) (Nygren et al. Reference Nygren, Lutz, Walsh, Martin, Chatelier, Loarer and Guilhem1997; Riccardo, Noll & Walker Reference Riccardo, Noll and Walker2000; Chen et al. Reference Chen, Shen, Qian, Sun, Liu, Shi, Zhuang and Xiao2014), which may do destructive harm to future large fusion devices with huge energy and short time scale of the order of milliseconds. In fact, the damages due to disruptions are strongly related to the channels of plasma energy loss. Therefore, the study of energy loss is of great importance for tokamak in-vessel component design and disruption mitigation research.
Setting up a disruption database is a useful way to study disruption characteristics, such as magnetic energy loss and CQ time, and it can provide an empirical reference for plasma facing components (PFCs) design. Besides, for research on prediction and avoidance of disruptions, a disruption database is extremely valuable. Various tokamaks (ASDEX-U, Alcator C-MOD, DIII-D, JET, JT-60 U and others) (Hutchinson et al. Reference Hutchinson, Boivin, Bombarda, Bonoli, Fairfax, Fiore, Goetz, Golovato, Granetz and Greenwald1994; Luxon Reference Luxon2002; Isayama Reference Isayama2011; Zhang et al. Reference Zhang, Chen, Fang, Jin, Huang, Wang, Yang, Chen, Ding and Zhang2012; Romanelli Reference Romanelli2013; Stroth et al. Reference Stroth, Adamek, Aho-Mantila, Akaslompolo, Amdor, Anigioni, Balden, Bardin, Barrera Orte and Behler2013) have established disruption databases and all have developed suitable methods of characterizing the plasma current decay waveform. What is more, a multidevice International Tokamak Physics Activity (known as ITPA) disruption database (known as IDDB) including nine tokamak devices with various scales describing CQ time, halo current and massive impurity injection, has been developed by the ITPA since 1994 (Eidietis et al. Reference Eidietis, Gerhardt, Granetz, Kawano, Lehnen, Lister, Pautasso, Riccardo, Tanna and Thornton2015) in order to find commonalities of disruption characteristics over different tokamaks, and to provide parametric relationships between predisruption and disruption parameters and scaling extrapolating to International Thermonuclear Experimental Reactor (known as ITER) and other large tokamaks.
In Experimental and Advanced Superconducting Tokamak (known as EAST), a similar disruption database has been established (Chen et al. Reference Chen, Granetz, Shen, Yang, Qian and Xiao2015), recording all disruptions since the beginning of EAST operation (when the upper divertor consisted of graphite tiles), through the installation of the tungsten monoblock upper divertor in 2016, and continuing right up to the present, automatically updating with each new disruption. The characteristics of the CQ time have also been analysed, and show that the lowest area-normalized CQ time in EAST is 3.33 ms m−2.
In this study, the EAST disruption database has enabled a systematic analysis focusing on magnetic energy loss during CQ.
2. Database description and analysis
2.1. Structure of the database
The database analysed in the paper includes all of the disruptions in EAST plasma with the plasma current  ${I_p}$, higher than 0.3 MA during the 2016–2018 operation period. The EAST tokamk is a fully superconducting tokamak with major radius
 $R\sim 1.8\;\textrm{m}$, minor radius
 $a\sim 0.45\;\textrm{m}$. The material of the vacuum vessel wall is stainless steel of which the resistivity is
 $7.4 \times {10^{ - 7}}\;\Omega \cdot \textrm{m}$ with a 25 ms L/R time (Liu et al. Reference Liu, Wan, Qian, Sun, Xiao, Shen, Luo, Ji and Chen2012), in which L is the inductance and R is the resistance. The database contains over 2000 disruption discharges after the upper divertor of EAST was upgraded to a W/Cu ITER-like divertor after 2016. The database includes several key plasma parameters describing the predisruptive plasma, CQ time, eddy current, and mitigation by massive gas injection (MGI). The plasma geometric and kinetic data is recorded at the time of the last acceptably converging equilibrium reconstruction before the onset of the disruption. The CQ time, which is a basic parameter to characterize the CQ phase, is relatively complicated and significantly depends on time evolution of the CQ.
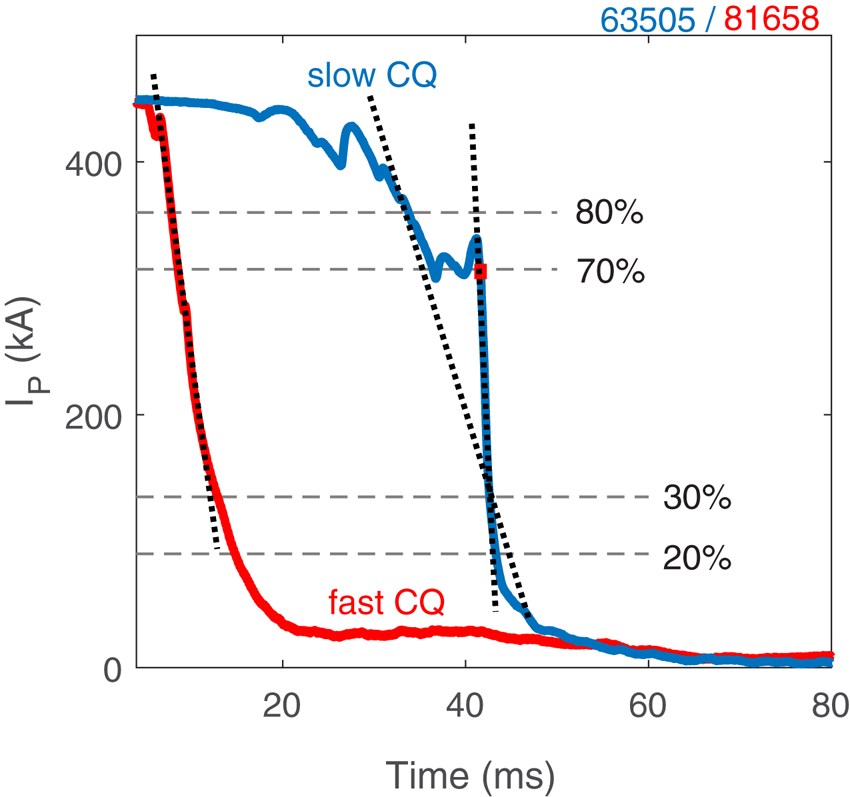
Four objective methods of determining the CQ time are recorded in the database,  $\Delta {t_{80 - 20}}$,
 $\Delta {t_{80 - 30}}$,
 $\Delta {t_{70 - 20}}$,
 $\Delta {t_{70 - 30}}$, as displayed in figure 1. For example,
 $\Delta {t_{70 - 20}}$ means the time it takes for the plasma current to drop from 70 % to 20 %
 ${I_p}$, in which
 ${I_p}$ is the plasma current just before the disruption. If several moments are on the line standing for 70 %
 ${I_p}$, as shown in figure 1, the last one will be selected.
Illustration of time intervals for different definitions of the CQ time. Percentages refer to fraction of predisruption current. The red line indicates the fast CQ case and the blue line means the slow CQ case.

The CQ time  $\tau $ is extrapolated from this decay duration, for example
 \begin{equation}{\tau _{7030}} = \Delta {t_{70 - 30}}/0.4.\end{equation}
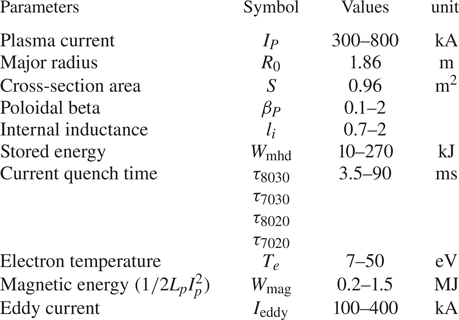
The CQ time can also be calculated using the 80 % to 20 % duration, the 80 % to 30 % duration, or the 70 % to 20 % duration. Then the major parameters characterizing disruptions are listed in table 1.
Major parameters in disruption database.

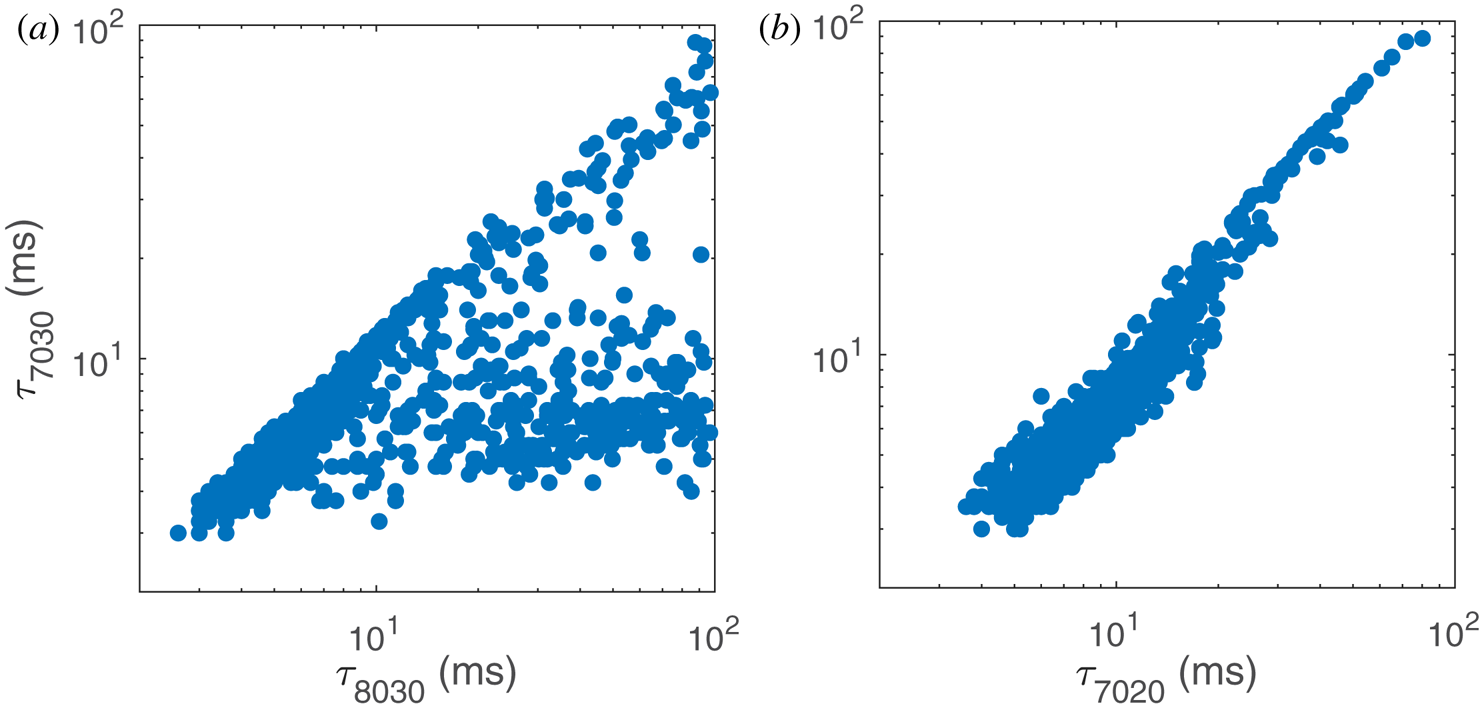
Characteristic details of the current quench dynamics on different tokamaks has led to the adoption of different definitions of the linear CQ time among different devices. The DIII-D uses 90 %–10 %, but 80 %–20 % is used on ASDEX-U to describe the CQ phase (Hender et al. Reference Hender, Wesley, Bialek, Bondeson, Boozer, Buttery, Garofalo, Goodman, Granetz and Gribov2007). In order to determine a suitable fit method for EAST, a comparison of several different decay time definitions has been done, and the results are presented in figure 2. As shown in figure 1, there are two representative waveforms for the CQ phase observed in EAST. One is a fast CQ, in which the plasma current decays directly. For most disruption discharges with this type of waveform, the linear average current decay rate evaluated from 70–30 %  ${I_p}$ is close to the one from 80–20 %
 ${I_p}$. The other type of CQ is called slow CQ. This type can often be divided into two quench phases: a slowly current decay phase, followed by a fast quench phase in which the decay suddenly speeds up. In this type, magnetohydrodynamics (known as MHD) activities lead to a rapid TQ and loss of stored energy. Vertical position control is lost, and the plasma current begins to decay slowly and the plasma drifts vertically. Eventually, the plasma comes in contact with the divertor, which initiates the fast quench phase (Gerhardt, Menard & the NSTX Team Reference Gerhardt and Menard2009). To describe the CQ duration, including the disruptions with compound decay phases, a linear fit is not always appropriate. Instead, a CQ duration based on the time it takes the plasma current to decay from 70 % to 30 % of the predisruption current,
 $\Delta {t_{70 - 30}}$, is always well-defined for a monotonically decreasing current.
Comparison between different definitions of the CQ time. Note that all axes are on a logarithmic scale.

For a fast CQ, the CQ time extrapolated from the four different time intervals can be almost the same. In the EAST tokamak, the CQ time for a fast decay is ~5–10 ms. In contrast, the CQ time in a slow CQ is usually more than 15 ms, because the slow quench phase can last for several tens of milliseconds. In this situation, if the plasma current decays to 80 %  ${I_p}$ during the slow quench phase, there will be a significant difference among the four definitions of CQ time. As illustrated in figure 2(a), most of the
 ${\tau _{8030}}$ values are much larger than the corresponding
 ${\tau _{7030}}$ values when
 ${\tau _{8030}}$ is over 10 ms, because the time of 80 %
 ${I_p}$ is often located in the slow quench phase, but 70 %
 ${I_p}$ is in the fast quench phase. Since
 ${\tau _{8030}}$ contains part of the slow quench phase,
 ${\tau _{7030}}$ is more suitable when precisely characterizing the fast quench phase rather than
 ${\tau _{8030}}$. Then in figure 2(b),
 ${\tau _{7030}}$ and
 ${\tau _{7020}}$ seem quite similar over the entire dataset, considering that in EAST, the plasma current measurement is partly affected by an induced eddy current flowing in conducting structures inside the vacuum vessel (Wan, Li & Weng Reference Wan, Li and Weng2006), especially when the plasma current decays to the same magnitude as the maximum value of the eddy current. As a result,
 ${\tau _{7030}}$, which can be equivalently combined with other machines, is chosen to mainly characterize the fast quench phase for the linear CQ time on EAST for a better comparison. Other definitions can also be used in the following analysis when the central issues are not only related to the fast quench phase.
2.2. Distribution of the database
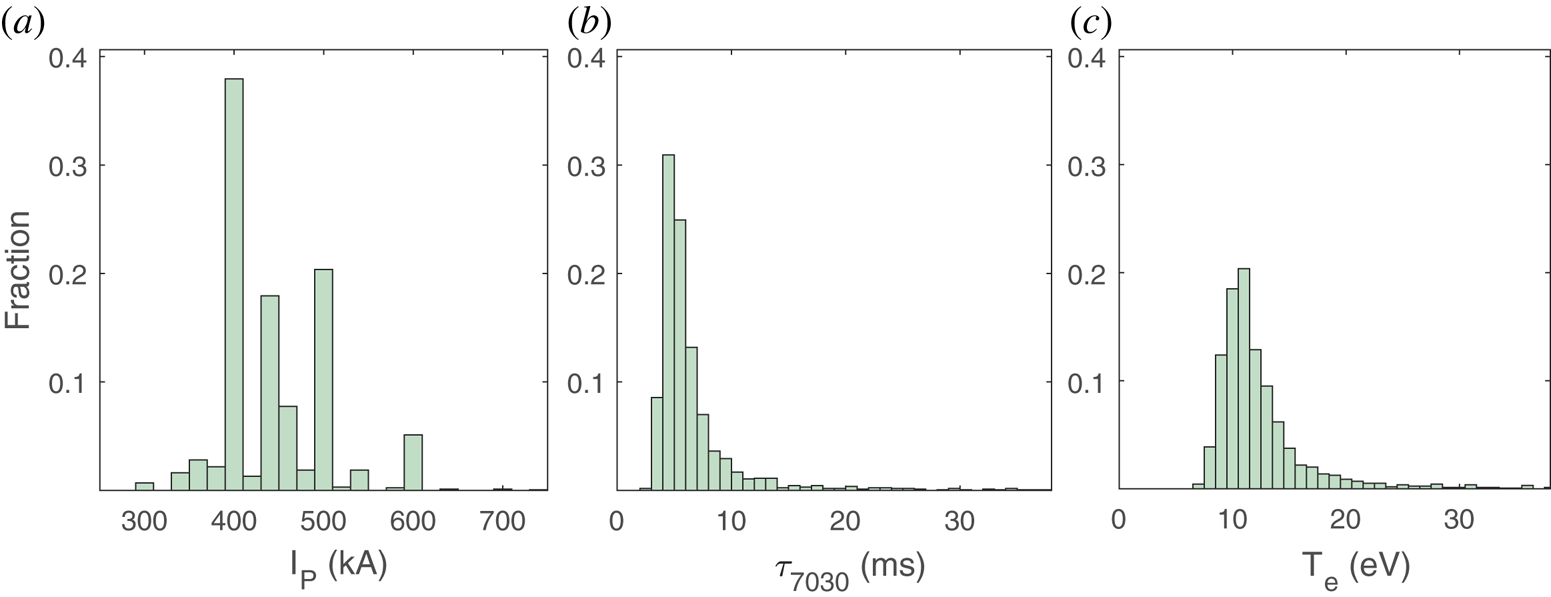
In the database, the plasma current of this database ranges from 300 to 800 kA, and mainly concentrated at 400, 450 and 500 kA, as shown in figure 3(a). Internal inductance is in the range of 0.8~2 and the maximum thermal energy is up to 0.28 MJ. Figure 3(b) represents the distribution of CQ time  ${\tau _{7030}}$. The CQ time
 ${\tau _{7030}}$ of ~90 % disruptions are less than 10 ms. The peak value in record is ~3 ms, and the relatively fastest linear current decay rate is ~150 MA s−1, defined as
 \begin{equation}\frac{{\textrm{d}{I_p}}}{{\textrm{d}t}} = \frac{{{I_p}}}{{{\tau _{7030}}}}.\end{equation}
Due to the significant effect of the electron temperature on the CQ time, a temperature estimation method is essential here. The L/R model, also used in the design of ITER (Wesley et al. Reference Wesley, Hyatt, Strait, Schissel, Flanagan, Hender, Gribov, deVries, Fredrickson and Gates2006), predicts the CQ time (Riccardo, Barabachi & Sugihara Reference Riccardo, Barabachi and Sugihara2005; Shibata et al. Reference Shibata, Watanabe, Ohno, Okamoto, Isayama, Kurihara, Oyama, Nakano, Kawano and Sugihara2011), by assuming that plasma is considered as a simple series circuit consisting of plasma inductance  ${L_p}$ (Shibata et al. Reference Shibata, Watanabe, Okamoto and Ohno2010) and plasma resistance
 ${R_p}$. Then the CQ time can be written as
 \begin{gather}{\tau _{\textrm{CQ}}} = \frac{{{L_p}}}{{{R_p}}},\end{gather}
 \begin{gather}{L_p} = {\mu _0}{R_0}\left( {\ln \frac{{8{R_0}}}{{{a_0}}} - 2 + \frac{{{l_i}}}{2}} \right),\end{gather}
 \begin{gather}{R_p} = \frac{{2\pi{R_0}{\eta _p}}}{S},\end{gather}
where  ${\mu _0}$ is the permeability of vacuum,
 ${R_0}$ is the major radius,
 ${a_0}$ is the minor radius,
 ${l_i}$ is the plasma internal inductance and S is the poloidal cross-sectional area, which are recorded in the database. Here plasma resistance is given (Spitzer & Harm Reference Spitzer and Harm1953) as
 \begin{equation}{\eta _p}(\textrm{cm} \cdot \Omega ) = {Z_{\textrm{eff}}} \times 0.65 \times {10^4}\ln \varLambda T{(\textrm{K})^{ - 3/2}},\end{equation}
where  $\ln \varLambda $ is assumed as 11 when the temperature is below 50 eV (Hilton & Hazeltine Reference Hilton and Hazeltine1976) and
 ${Z_{\textrm{eff}}}$, defined as
 \begin{equation}{Z_{\textrm{eff}}} = \frac{{{n_H} \times 1 + {n_i} \times Z_i^2}}{{{n_H} + {n_i} \times {Z_i}}},\end{equation}
is estimated to be ~8 during the unintended EAST disruptions, in which the plasma density is  $\mathrm{\sim }{10^{19}}\;{\textrm{m}^{ - 3}}$ and the impurity density, mainly
 ${W^{10 + }}\sim {W^{30 + }}$ (Zhang et al. Reference Zhang, Morita, Xu, Yang, Cheng, Li, Wu, Yang, Ding, Oishi and Dai2019), is estimated two orders of magnitude lower than the plasma density. As all the parameters here are recorded in the database except the plasma temperature,
 ${T_e}$ can be obtained. In EAST discharges, the plasma temperature during disruption calculated from L/R model is approximately 10~30 eV, and most of values are concentrated at 15 eV.
Distribution of (a) plasma current before disruption, (b) plasma CQ time, (c) plasma temperature calculated by L/R model.

Compared with results based on previous EAST database (Chen et al. Reference Chen, Shen, Qian, Sun, Liu, Shi, Zhuang and Xiao2014), in which the upper divertor material was carbon and most of CQ times are between 4~5 ms with electron temperature less than 10 eV, the electron temperature during the CQ presented here is significantly higher. The corresponding CQ time is also longer with the tungsten divertor. A similar result was also observed in JET, showing that the CQ time is longer with an ITER-like metal wall than with a carbon wall (Lehnen et al. Reference Lehnen, Arnoux, Brezinsek, Flanagan, Gerasimov, Hartmann, Hender, Huber, Jachmich and Kiptily2013).
3. Magnetic energy dissipation during CQ
The total plasma energy consists of thermal energy  $({W_{\textrm{th}}} = \int {1.5nkT\,\textrm{d}v} )$ and magnetic energy
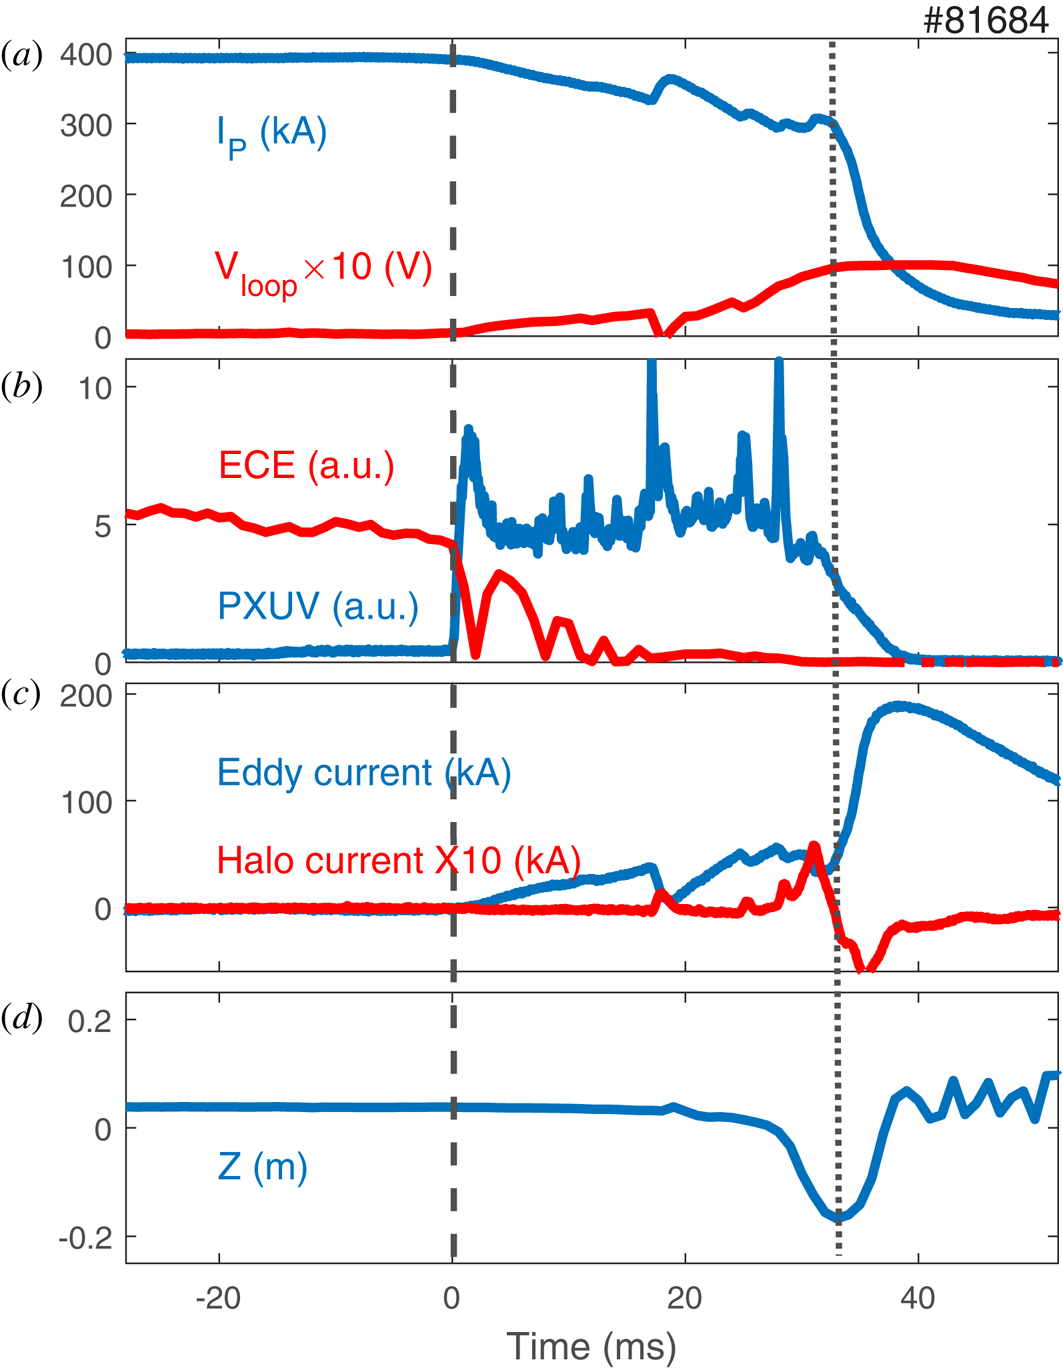
 $({W_{\textrm{mag}}} = 1/2{L_p}I_p^2)$ (Granetz et al. Reference Granetz, Hollmann, Whyte, Izzo, Antar, Bader, Bakhtiari, Biewer, Boedo and Evans2007), which are, respectively, dissipated mainly during the TQ (~1 ms) and CQ (~10 ms), and can lead to destructive heating flux and EM forces. During the CQ, the damages induced by magnetic energy dissipation strongly depend on the channels of energy loss. As shown in figure 4, there're three main channels of magnetic energy losses, including (1) radiation mainly in slow quench phase, (2) conduction into PFCs, (3) inductive coupling which mainly occurs during the fast quench phase and leads to eddy currents, causing appreciable
 $J \times B$ forces on the structure component when interacting with the poloidal field and halo current, which is the reason for strong EM loads on the conducting first wall structures. Runaway electrons (REs) induced by high loop voltage during fast CQ should also pose destructive threats to the device (ITER Physics Expert Group on Disruptions, Plasma Control and MHD & ITER Physics Basis Editors 1999). However, RE plateau is hard to observe during the unintended EAST disruptions and the energy transformation term is relatively lower, so REs are not taken into consideration here.
Time traces showing (a) plasma current and loop voltage, (b) electron cyclotron emission and radiation intensity, (c) eddy current and halo current, which is 10 times larger than the original data, (d) vertical position during disruption. The start time of disruption and end of slow quench phase are noted as different dashed lines.

During the disruptions, the TQ onset is obviously defined by the sharp drop of the central electron cyclotron emission (known as ECE) signal, shown in figure 4(b), during which the whole plasma temperature decreases to ~10 eV. After the TQ, a high plasma resistance has been induced due to low temperature  $({\eta _p} \propto T_e^{ - 3/2})$ and finally a fast CQ occurs. For disruptions with slow quench phase, the plasma current decays quite slowly and stays high for a relatively long time, compared to the duration of the fast quench phase. This process can result in an amount of thermal energy coming from ohmic heating
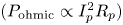 $({P_{\textrm{ohmic}}} \propto I_p^2{R_p})$, which is called ohmic reheat. The reheat process may keep the plasma temperature rising until the radiation and conduction, which occur at the same time of reheating, can completely compensate this effect (Lehnen et al. Reference Lehnen, Arnoux, Brezinsek, Flanagan, Gerasimov, Hartmann, Hender, Huber, Jachmich and Kiptily2013). Then the slow quench phase terminates, the plasma comes in contact with the lower/upper divertor, and the fast quench phase follows. There is a higher plasma current decay rate and less radiation, in which inductive coupling will be dominant in magnetic energy loss.
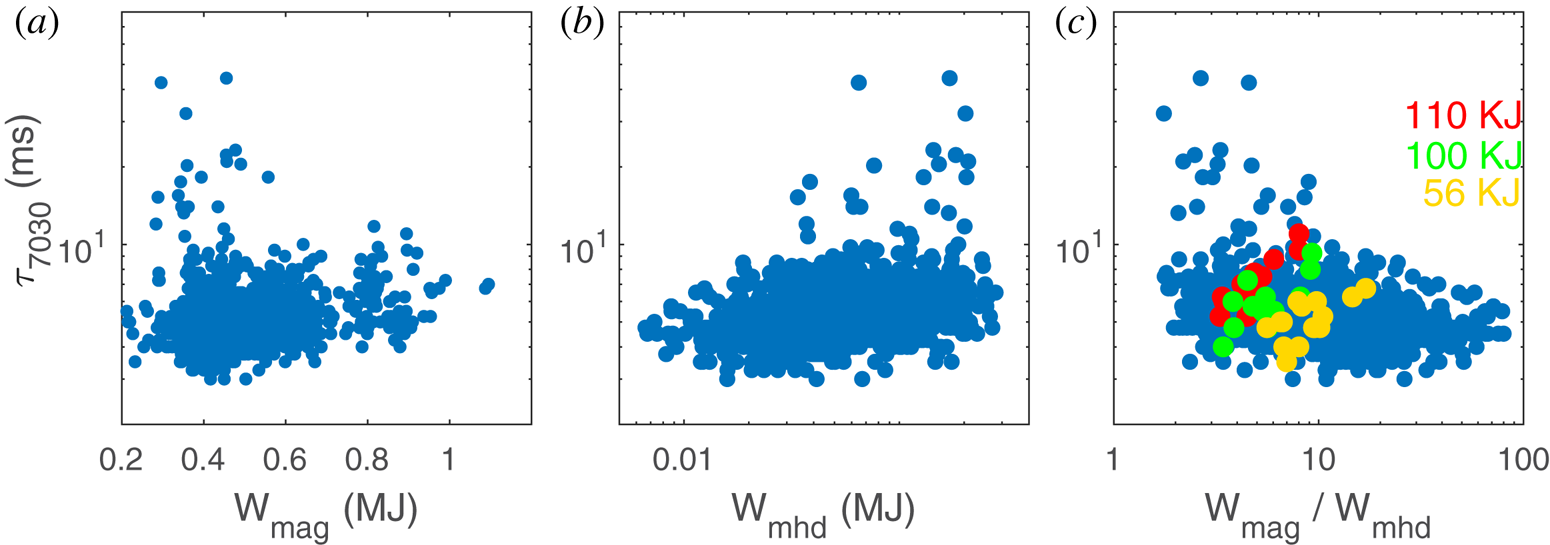
Magnetic energy of most disruption discharges ranges from 0.3~1 MJ, and the maximum can even reach 1.5 MJ. Figure 5 displays the relation between  ${\tau _{7030}}$, thermal energy and magnetic energy. As the magnetic energy becomes higher, the lowest CQ time seems to increase slightly, in which the lowest CQ time is closely linked with the maximum forces from eddy currents and provides the design basis for a tokamak vacuum vessel (Hender et al. Reference Hender, Wesley, Bialek, Bondeson, Boozer, Buttery, Garofalo, Goodman, Granetz and Gribov2007). However, this trend is probably not obvious enough to support a definite conclusion, thus further evidence is presented in figure 5(c) showing the linear CQ time as a function of a ratio of total magnetic energy and the stored energy. In figure 5(c), disruptions with 110, 100 and 56 kJ stored energy are highlighted and it presented a more convincing trend that there is a significant increase in CQ time when the total magnetic energy becomes higher. Thermal energy before disruption covers from 10~270 kJ as presented in figure 5(b) and the loss of thermal energy could affect impurity influxes, but no clear dependence of
 ${\tau _{7030}}$ on this value is found.
The CQ time  ${\tau _{7030}}$ as a function of (a) magnetic energy, (b) thermal energy, (c) ratio of magnetic energy and thermal energy. Disruptions with 56, 100 and 110 kJ thermal energy are, respectively, plotted as yellow, green and red points.

More details about magnetic energy are analysed in the following, including a description of magnetic energy loss channels and their relations with the CQ time.
3.1. Ohmic reheating and radiation
During the slow quench phase, the plasma can be ohmically reheated by the high loop voltage, which is induced by the evolution of the plasma current and its profile. Whether the thermal energy from reheat can be completely eliminated by radiation and conduction is complicated because the plasma temperature keeps changing and is unable to be accurately measured. Moreover, the thermal energy conducted to PFC cannot be well estimated. However, a probable supposition may be obtained from the disruption database here.
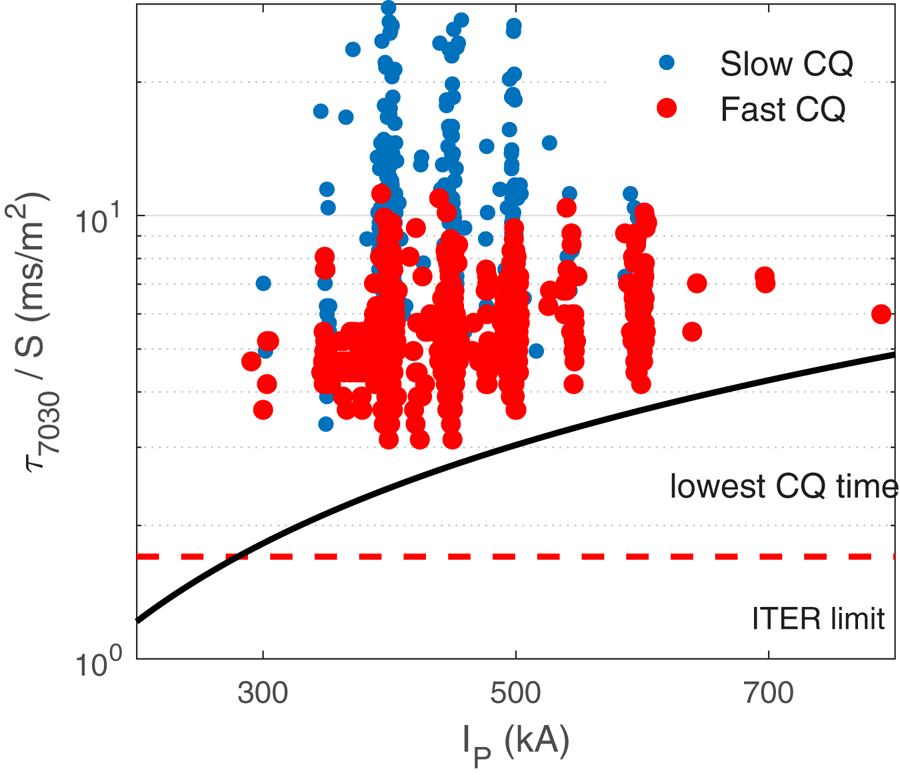
As shown in figure 6, the CQ time normalized by the poloidal cross-sectional area  $({\tau _{7030}}/\textrm{S)}$ is clearly affected by the ohmic reheating process and the value with the slow quench phase is generally longer than without the slow quench phase. Considering that the CQ time
 ${\tau _{\textrm{CQ}}}$ is derived to be proportional to
 $T_e^{3/2}$, there should be a higher plasma temperature for the slow CQs compared with the fast CQs. The result also indicates that during the slow quench phase, plasma is reheated by thermal energy transferred from magnetic energy.
The CQ time normalized by poloidal cross-sectional area as a function of plasma current. Fast CQ and slow CQ are shown by red and blue circular. respectively. Black solid line means the slowest CQ time which will be introduced in § 3.2. The lowest limit for CQ time in ITER is displayed by red dashed line.

3.2. Eddy current
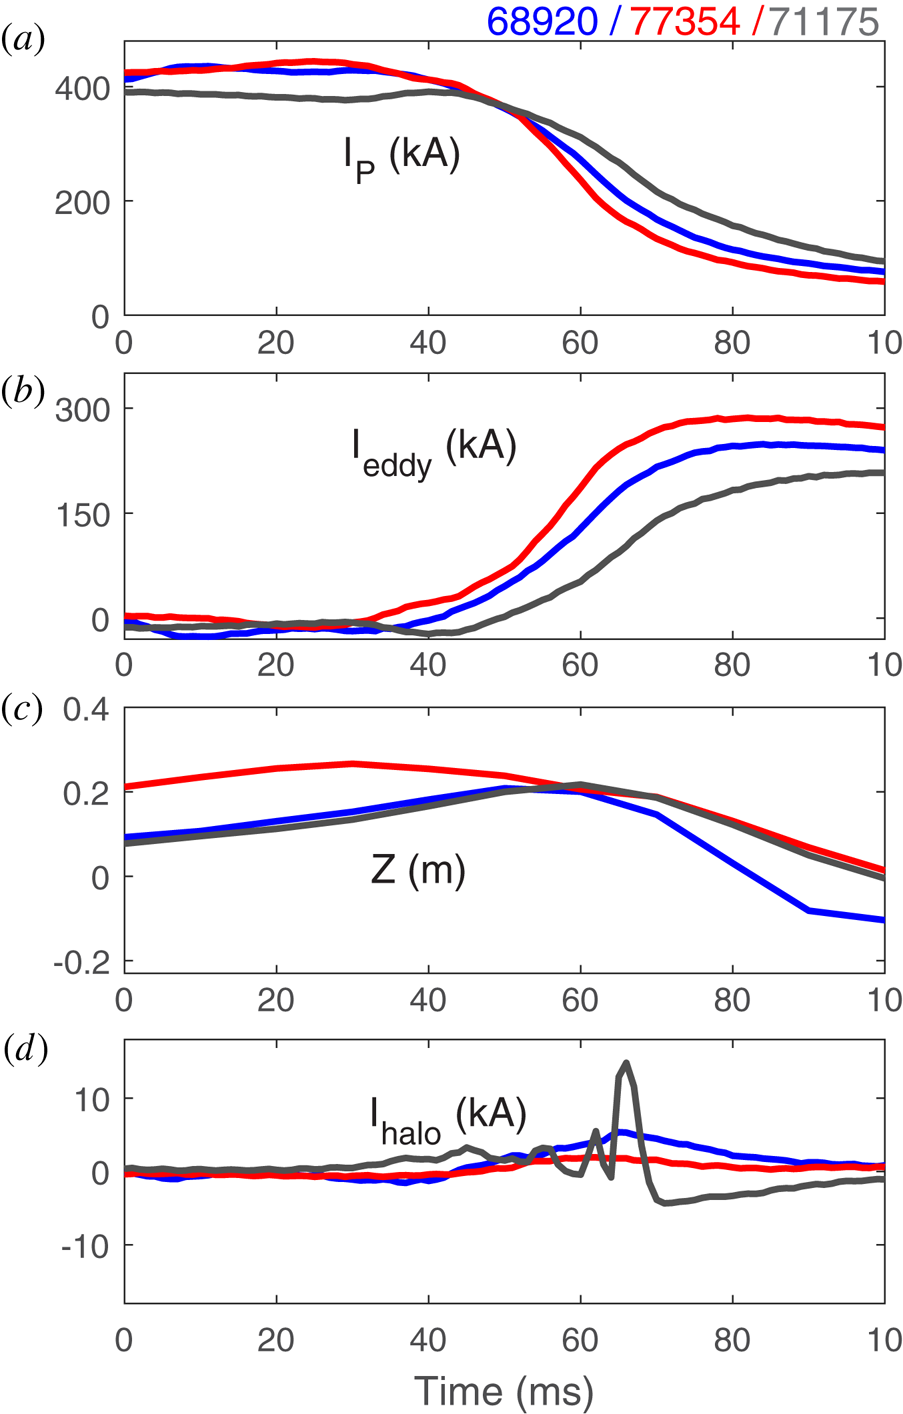
The rapid loss of plasma current during the CQ can significantly induce eddy currents and pose threats to the mechanical integrity of in-vessel components. Lots of magnetic energy is simultaneously coupled into the vacuum vessel. In ITER, it places a lower bound on the expected CQ time (~1.7 ms m−2) to robustly design in-vessel components. In EAST disruptions, after the slow quench phase, the radiation intensity gets lower, but the eddy current increases sharply up to half of  ${I_p}$, which is large enough to interfere with the measurement accuracy of the current when
 ${I_p}$ is below 30 %, shown in figure 7(a) and (b). In EAST, the maximum eddy current can reach up to 400 kA during a vertical displacement event (known as VDE), and the corresponding CQ time is 3 ms, which can finally produce ~200 MPa force density acting on the conducting structures. For larger tokamaks such as ITER and CFETR, the value can be much higher, so the study of eddy currents is of great importance.
Time traces for three USN discharges showing (a) plasma current, (b) eddy current, (c) vertical position and (d) halo current.

Figure 7(b) shows the evolution of eddy currents in detail. All three upper single null (USN) discharges are carried out with  ${I_p} = 400\;\textrm{kA}$. In the three disruption discharges, the shorter the CQ time, the higher eddy current and the lower the halo current. Halo current (maximum 20 kA) is one order of magnitude smaller than eddy current (~200 kA) in the same discharge (Chen et al. Reference Chen, Shen, Qian, Sun, Liu, Shi, Zhuang and Xiao2014). Also, in a slow CQ disruption shown in figure 4(c), eddy current is much higher than halo current. Thus, only eddy current is taken into consideration for magnetic energy dissipated by coupling.
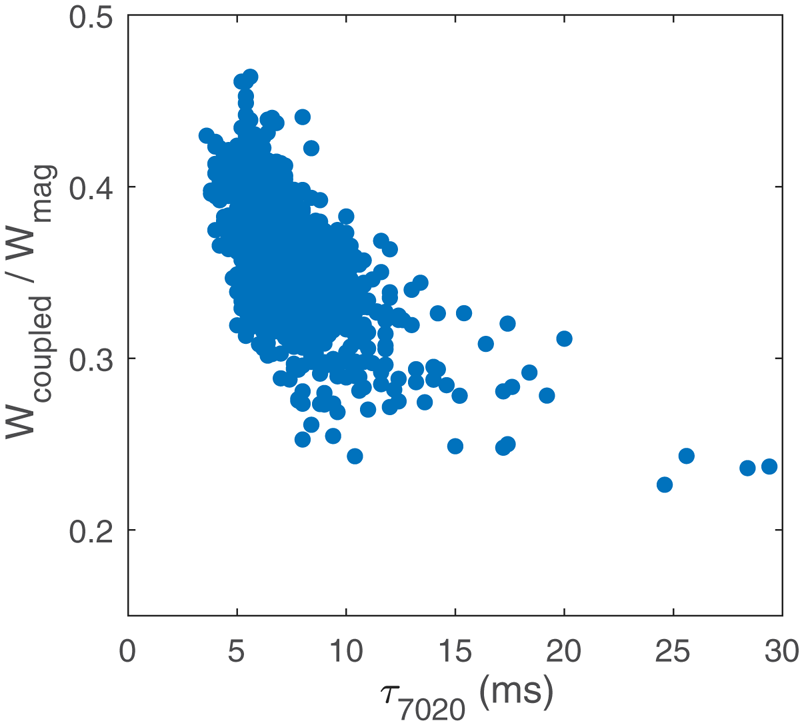
Figure 8 shows  ${f_{\textrm{coupled}}}$, the fraction of magnetic energy coupled into a vessel
 $({W_{\textrm{coupled}}} = \int {{P_{\textrm{coupled}}}\,\textrm{d}t} )$ in the total magnetic energy, as a function of the CQ time. It should be noted that in EAST, the maximum eddy current usually occurs when the current decays to 20 %–30 % of
 ${I_p}$, at which the
 ${W_{\textrm{coupled}}}$ reached the peak value, so
 ${\tau _{7020}}$ is chosen to characterize the CQ time here. The ratio
 ${f_{\textrm{coupled}}}$ drops from 45 % to 20 % with increasing CQ time. The maximum energy dissipated in the vessel is ~45 % of the magnetic energy for the fastest CQs with ~4 ms duration.
The fraction of magnetic energy coupled into a vacuum vessel as a function of CQ time. The CQ time is extrapolated from the time duration that plasma current drops from 70 % to 20 %  ${I_p}$.

As mentioned above, the lowest CQ time is often closely related to the maximum forces from eddy current (Hender et al. Reference Hender, Wesley, Bialek, Bondeson, Boozer, Buttery, Garofalo, Goodman, Granetz and Gribov2007) and this value is given by the maximum coupled energy into the vessel. The lowest CQ time versus plasma current can be obtained and the result is shown in figure 6 as the black solid line. All derivation is based on an energy balance formula which will be given in the next part and assumptions: (1) a fast CQ; (2) the amount of magnetic energy coupled into the vessel is ~45 %; (3)  ${l_i} = 0.8$, almost the lowest value in the EAST experiments nowadays. Taking those assumptions and values into the energy balance formula provides the lower limit of CQ time. According to figure 6, the lowest CQ time increases with plasma current. Higher ohmic heating
 $({\propto} I_p^2)$ causing a higher temperature, and lower plasma resistance might be a reason, but this effect can be only partly compensated by radiation and conduction. In addition, the CQ time normalized by S for ITER is predicted to be not less than
 $\textrm{1}\textrm{.7}\;\textrm{ms}\,{\textrm{m}^{ - 2}}$ given by the maximum acceptable electromagnetic loads from eddy currents (Hender et al. Reference Hender, Wesley, Bialek, Bondeson, Boozer, Buttery, Garofalo, Goodman, Granetz and Gribov2007), and this value is much lower than the observed lowest value in EAST (
 $\mathrm{\sim 3}\textrm{.00}\;\textrm{ms}\,{\textrm{m}^{ - 2}}$), which is nearly the same result from JET with ITER-like wall, even when then plasma current is one order lower than ITER.
3.3. Energy balance model
For a clearer expression of the magnetic energy dissipation during CQ, an energy balance method is necessary. As analysed above, magnetic energy dissipation can be expressed as (Lehnen et al. Reference Lehnen, Arnoux, Brezinsek, Flanagan, Gerasimov, Hartmann, Hender, Huber, Jachmich and Kiptily2013)
 \begin{gather}\frac{{\textrm{d}{W_{\textrm{mag}}}}}{{\textrm{d}t}} ={-} {P_{\textrm{coupled}}} - {P_{\textrm{ohmic}}},\end{gather}
 \begin{gather}\frac{{\textrm{d}{W_{\textrm{th}}}}}{{\textrm{d}t}} ={-} {P_{\textrm{cond}}} - {P_{\textrm{rad}}} + {P_{\textrm{ohmic}}}.\end{gather}
Here  ${P_{\textrm{coupled}}}$ means magnetic energy coupled into the surrounding structure and
 ${P_{\textrm{ohmic}}}$ represents ohmic heating, during CQ, they are often expressed as
 \begin{gather}{P_{\textrm{coupled}}} = {I_p}{M_p} \cdot \frac{{\textrm{d}{I_s}}}{{\textrm{d}t}}, \end{gather}
 \begin{gather}{P_{\textrm{ohmic}}} = 2\pi{R_0}{\eta _p}\frac{{I_p^2}}{S},\end{gather}
 \begin{gather}{P_{\textrm{rad}}} = 2\pi{R_0}S{n_e}{n_Z}{L_Z},\end{gather}
in which  ${M_p}$ is mutual inductance between plasma and structure elements,
 ${I_s}$ is current flowing in the structure,
 ${R_0}$ is major radius,
 ${\eta _p}$ is plasma resistance and S is poloidal cross-sectional area. In this model,
 ${M_p}$ is considered as a constant during disruption, and
 ${L_Z}$, impurity emissivity, has a strong dependence on impurity type and temperature which is chosen as the average value during the CQ and considered as a constant (Summers Reference Summers2004). Since halo current is much smaller than eddy current in EAST, here
 ${I_s}$ can be replaced by
 ${I_{\textrm{eddy}}}$ only.
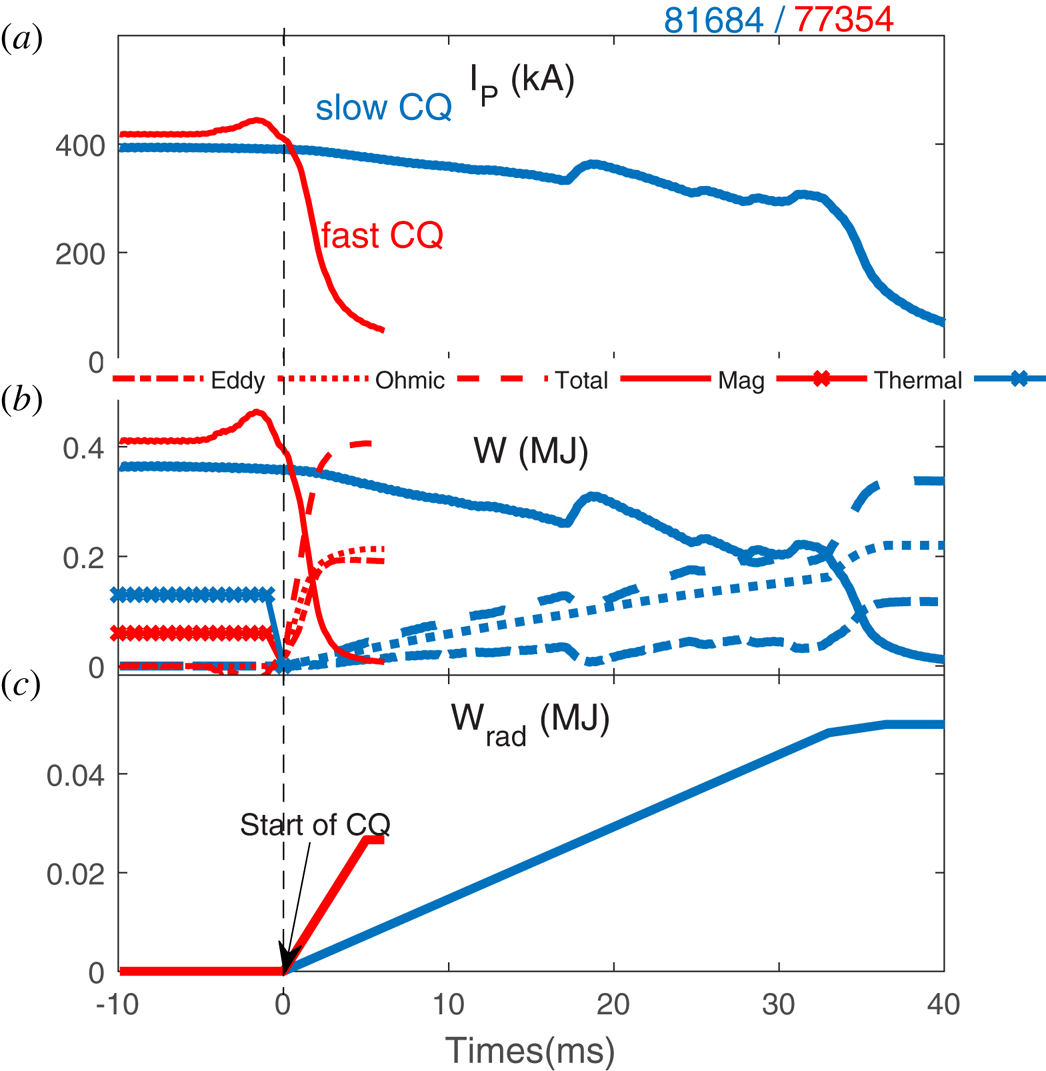
The magnetic energy decay process of two typical disruptions, including coupled energy, ohmic heating energy, total magnetic energy added by coupling and ohmic terms  $({W_{\textrm{coupled}}} + {W_{\textrm{ohmic}}})$ and magnetic energy
 $(0.5{L_i}I_p^2)$, are calculated and measured predisruption thermal energy is also presented in figure 9. Simulation results show that in the fast CQ, the coupled term and ohmic term are almost the same, ~0.2 MJ. In the slow CQ, the ohmic term and coupled term play major roles, respectively, in the slow quench phase and the fast quench phase, there also shows a stronger radiation intensity in the slow quench phase. For the energy dissipation process of slow CQ with 0.4 MJ total energy,
 ${W_{\textrm{ohmic}}}$ is also 0.2 MJ, however, the coupled term is only approximately a half of ohmic term, ~0.1 MJ. It can be understood that the loop voltage during the fast CQ is larger than during the slow CQ but the duration is much shorter, so the final ohmic reheating is almost the same. Moreover, smaller current decay rate during the slow CQ couples less magnetic energy into surrounding structure. Energy dissipated by radiation (shown in figure 9c) is one order lower than other loss channels, when compared with the results in JET with ITER-like wall, the fraction of magnetic energy dissipated by radiation in EAST (~10 %) is much lower than the 30 % though the metal wall used in EAST and JET. Moreover, magnetic energy calculated by this model during the CQ in the two cases is almost consistent with the measured magnetic energy in equilibrium just before the disruption. The difference between the calculation and the measurement could be understood by the absence of halo currents and energy coupled into PF coils.
Time traces showing (a) plasma current and (b,c) energy flow for the fast CQ and the slow CQ according to the energy balance model. Magnetic energy dissipated by eddy current, ohmic reheating, total energy added by the first two and the magnetic energy before disruption are, respectively, displayed by dash-dotted line, dotted line, dashed line and solid line in panel (b).

4. Effect of MGI on magnetic energy dissipation
Radiation dissipates part of both the thermal energy and magnetic energy during disruption. This fast deposition of heat flux on a small area can do great harm to both divertor and the nearby first wall (Hender et al. Reference Hender, Wesley, Bialek, Bondeson, Boozer, Buttery, Garofalo, Goodman, Granetz and Gribov2007). Massive gas injection has been proved to be an effective way to mitigate the heat loads during the disruption (Riccardo & JET EFDA Contributors Reference Riccardo2003; Finken et al. Reference Finken, Kraemer-Flecken, Lehnen and Savtchkov2003; Pautasso et al. Reference Pautasso, Fuchs, Gruber, Maggi, Maraschek, Pütterich, Rohde, Wittmann, Wolfrum and Cierpka2007; Thornton et al. Reference Thornton, Gibson, Harrison, Lehnen, Martin and Kirk2012; Chen et al. Reference Chen, Shen, Granetz, Qian, Zhuang, Zeng, Duan, Shi, Wang, Sun and Xiao2018). Systematic MGI studies indicate that with massive impurities injected, plasma current shutdown with reduction of divertor thermal loads and suppression of runaway electrons has been observed in many tokamaks such as DIII-D, JET, JT-60 U and others. For EAST, similar conclusions have been shown in previous work (Chen et al. Reference Chen, Shen, Granetz, Qian, Zhuang, Zeng, Duan, Shi, Wang, Sun and Xiao2018). All MGI experiments on EAST are also recorded in the database.
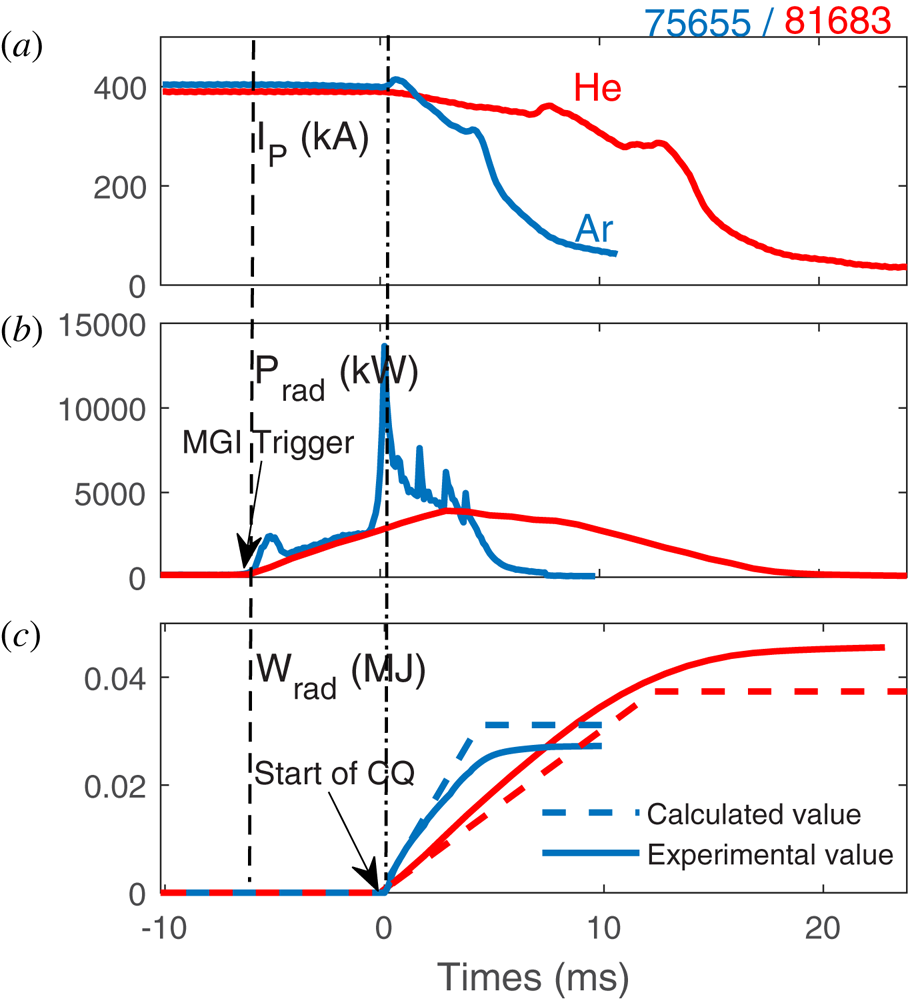
Massive gas injection mitigation experiments on EAST are carried out with  ${I_p} = 350{\sim}400\;\textrm{kA}$ and two species of noble gases (helium and argon) are used to trigger disruptions. Two samples of injected gas are shown in figure 10. The time points of MGI trigger and start of CQ are noted by arrows. It shows a much shorter slow quench phase duration for Ar injection than He injection and radiation power with Ar injection is approximately twice of that with He injection, which is due to the strong dependence of radiation power on impurity mass number. Besides, the energy dissipated by radiation gained from the energy balance model, plotted as dashed line, is consistent with the experimental measurement (shown in figure 10c by solid lines). Note that the calculated value is 15 % lower than the measurement for He but 15 % higher for Ar. The error between the calculation and the experiment could be caused by lack of density measurement of both plasma and impurity, which strongly depends on species of impurity.
Time traces showing (a) plasma current, (b) radiation power and (c) energy dissipated by radiation for MGI triggered by helium and argon. Dashed line means energy calculated from the magnetic energy dissipation model while the solid line is data measured during experiments.

Obviously, even in MGI experiments in EAST, radiation can only dissipate up to 20 % of total ohmic-heating inducing thermal energy, ~40 kJ of the total of several hundreds of kJ of thermal energy. Most of the thermal energy transferred from magnetic energy via ohmic heating will still end up on the divertor or vessel wall in EAST. A similar conclusion is also confirmed (Chen et al. Reference Chen, Shen, Granetz, Qian, Zhuang, Zeng, Duan, Shi, Wang, Sun and Xiao2018).
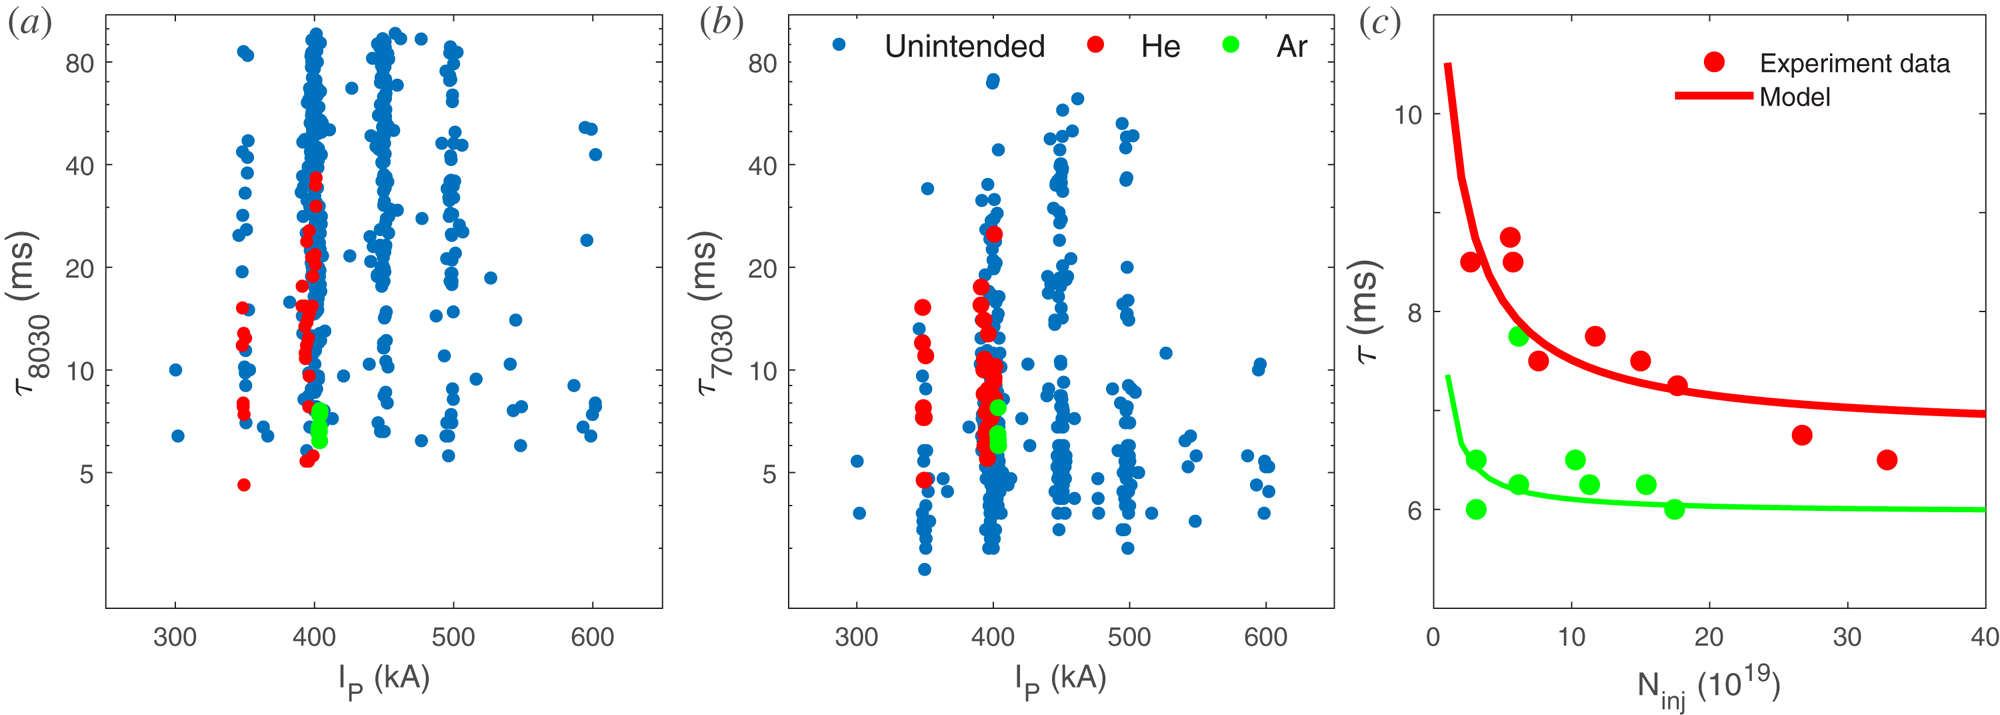
Figure 11(a,b) presents the distribution of MGI triggered disruptions among slow CQ disruptions when the definition of CQ time is  ${\tau _{8030}}$ and
 ${\tau _{7030}}$ , respectively. Different species of gas injection and unintended disruption are separated by three colours. The
 ${\tau _{8030}}$ for the disruptions caused by MGI are statistically smaller than the unintended disruptions, especially MGI with Ar, which indicates that MGI can efficiently shorten the duration of the slow quench phase. However, no clear change in
 ${\tau _{7030}}$ (figure 11b) suggests that there are no significant effects on the fast quench phase.
(a,b) Distribution of MGI triggered disruption among slow CQ with  ${\tau _{8030}}$ and
 ${\tau _{7030}}$. (c) Current quench time as a function of the numbers of particles injected, in which lines are provided by L/R model and points are data in experiments.

The L/R model mentioned above is used to estimate the effect of the impurity injection on the CQ time and the results are shown in figure 11(c). In order to study the effects of the number of injection gases on the CQ time based on the model, it is essential to keep another variable- plasma temperature – to be constant, thus in figure 11(c), this value is chosen acceptably as ~8 and 11 eV, respectively, for most of the Ar and He MGI discharges. Results are shown here presenting the CQ time as a function of changing  ${Z_{\textrm{eff}}}$. Figure 11(c) shows that in both helium and argon injection, the CQ time
 $({\tau _{7030}})$ becomes shorter with more gases injected, and the CQ time with argon is lower than helium injection. These simulation results are consistent with experimental data in EAST, which also proves the reliability of this model.
5. Conclusion
In this paper, a disruption database consisting of more than 2000 disruption discharges of EAST experiments has been set up and has been presented clearly and in detail. The EAST disruption database provides a large number of plasma parameters describing the predisruption plasma, the CQ time, eddy current and mitigation by massive impurity injection. According to the disruption database, the CQ time gets longer with the increase of the plasma magnetic energy before disruption. Ohmic reheating and coupling, as two main channels of magnetic energy dissipation, play majority roles, respectively, in the slow quench phase and the fast quench phase. Eddy current can carry up to 45 % total magnetic energy with lowest area-normalized CQ time of 3.0 ms m−2, which is much higher than the ITER limit (1.7 ms m−2). An energy balance model is used to analyse the magnetic energy dissipation during the CQ, which is consistent with the experimental results. Also, disruptions triggered by MGI are taken into consideration and it is demonstrated that MGI can efficiently shorten the slow quench phase duration from a series of MGI experiments in EAST. The low fraction of the radiation term may concern the material of the metal wall, which will be studied on in future. The disruption database on EAST, especially with the ITER-like tungsten divertor and fully metal PFCs, will be a necessary and desirable complement for the ITPA disruption database and can also enhance the existing modelling efforts.
Acknowledgements
This material is based upon work supported in part by Youth Innovation Promotion Association of Chinese Academy of Sciences under Contract no. 2017480, the National Magnetic Confinement Fusion Science Program of China under Contract no. 2017GB106004B, and the National Natural Science Foundation of China under Contracts no. 11775267 and no. 11775266.
Editor Tünde Fülöp thanks the referees for their advice in evaluating this article.