





1. Introduction
Glow discharge plasma is one of the most straightforward and effective methods for producing plasma in laboratory settings, characterised by distinct regions between the cathode and anode where the gas transitions from a dielectric to a conducting state once the applied voltage exceeds a critical threshold (Bogaerts & Gijbels Reference Bogaerts and Gijbels1996). It has a wide range of applications, notably in materials processing for surface modification, thin-film deposition, etching and doping, as it provides a stable and controllable source of ions and radicals (Venugopalan Reference Venugopalan1984; Aronsson, Lausmaa & Kasemo Reference Aronsson, Lausmaa and Kasemo1997; Dai, Griesser & Mau Reference Dai, Griesser and Mau1997; Yang & Feng Reference Yang and Feng2007; Zhang et al. Reference Zhang2013; Yari, Zakerhamidi & Ghomi Reference Yari, Zakerhamidi and Ghomi2022; Akther et al. Reference Akther, Sheikh, Miran, Adawi and Rahman2023). Also, glow discharge plasmas are leveraged in catalytic processes for environmental and chemical synthesis applications (Van Turnhout et al. Reference Van Turnhout, Rouwenhorst, Lefferts and Bogaerts2025), plasma-enhanced chemical vapour deposition, cleaning and activation of surfaces (Aronsson et al. Reference Aronsson, Lausmaa and Kasemo1997). Additionally, such plasma systems are widely used in analytical spectroscopy for elemental analysis (Bogaerts Reference Bogaerts1999), in lighting (fluorescent and neon lamps), manufacturing of semiconductors due to their ability to produce uniform plasma conditions, and in plasma catalysis reactors for efficient CO2 conversion and other catalytic reactions (Hammer, Kappes & Baldauf Reference Hammer, Kappes and Baldauf2004; Dȩbek et al. Reference Dȩbek, Azzolina-Jury, Travert, Mauge and Thibault-Starzyk2019). The versatility of glow-discharge plasma across industrial, environmental and biomedical fields makes it an important plasma source.
In the discharge chamber, free electrons, originating from field emission or cosmic rays, initiate the discharge process. Once an electric field is applied, these electrons accelerate along the field lines, gaining energy and undergoing repeated collisions with neutral gas molecules. Each collision may transfer enough energy to ionise the neutral species, releasing additional electrons. This cyclic process, governed by the mean free path (
 $\lambda$
) and characterised by an average drift velocity, leads to sustained electron multiplication and the development of a self-sustaining discharge. Breakdown and discharge characteristics depend on properties such as gas type, gas pressure and electrode spacing (Paschen Reference Paschen1889).
Paschen’s law, formulated by the German physicist Paschen (Reference Paschen1889), describes the relationship between the breakdown voltage (
 $V_B$
) required to ionise a gas, and the product of the gas pressure (
 $p$
) and the inter-electrode distance (Lisovskiy, Yakovin & Yegorenkov Reference Lisovskiy, Yakovin and Yegorenkov2000) (
 $d$
), i.e.
 $V_B = f(pd)$
. Townsend introduced three coefficients to explain the breakdown process and the breakdown criterion (Townsend Reference Townsend1915; Posin Reference Posin1936). The first Townsend coefficient (
 $\alpha$
) is the probability per unit length of path to ionise neutral gas by electron impact collision and is expressed as
 \begin{equation} \alpha = \frac {1}{\lambda _e} \exp \left (-\frac {E_i}{\epsilon _e}\right )\!, \end{equation}
where
 $\lambda _e$
is the mean free path
 \begin{equation} \lambda _e = \frac {k_BT}{\sigma _ip}, \end{equation}
where
 $\sigma _i$
is an electron impact ionisation cross-section,
 $E_i$
is the gas ionisation threshold, and
 $\epsilon _e$
is the energy gained by the electron between two consecutive collisions with neutral atoms and is assumed to be (
 $\epsilon _e = eE\lambda _e$
) (Talviste et al. Reference Talviste, Paris, Raud, Plank, Erme and Jõgi2021). For a uniform electric field, the electric field before breakdown is taken to be
 $E=\frac {V}{d}$
, where V is the applied voltage and d is the inter-electrode distance, neglecting space charge effects. Including all these in (1.1),
 $\alpha$
can be written as
 \begin{equation} \alpha = A p \exp \bigg({\frac {-Bp}{E}}\bigg), \end{equation}
where
 $A=({\sigma _i}/{k_bT})$
and
 $B= ({\sigma _iE_i}/{ek_BT})$
are gas-dependent constants (Burm Reference Burm2007). The second ionisation coefficient (
 $\beta$
) is the ionisation caused by positive ions during breakdown. Because the energy of positive ions is much lower than that of electrons, they are usually considered to be at zero energy, making this the least important of the three. The third Townsend coefficient, or the effective secondary emission coefficient (
 $\gamma _{se}$
), describes the electron emission due to the impact of particles bombarding on the cathode (Sen & Ghosh Reference Sen and Ghosh1962; Auday et al. Reference Auday, Guillot, Galy and Brunet1998; Donkó Reference Dȩbek, Azzolina-Jury, Travert, Mauge and Thibault-Starzyk2001). The particles can be ions, metastable atoms, energetic electrons or photons and fast neutrals. i.e.
 $\gamma _{se}$
can be written as
 \begin{equation} \gamma _{se} = \gamma _{ion} +\gamma _{meta} + \gamma _{electron} + \gamma _{neutrals} +\gamma _{photon}. \end{equation}
Secondary electron emission can result from multiple factors, but ion impact is the dominant mechanism. So, combining the exponentially increasing electron number due to avalanche processes and secondary electron emission processes. If the ionisation threshold energy of the gas is higher than the work function of the cathode, the
 $\gamma _{se}$
due to ion impact will be higher. Combining the avalanche of exponentially growing electron number and the secondary electron emission processes from the cathode, the total current density can be expressed as
 \begin{equation} J = \frac {J_0 \exp {(\alpha d)}}{1-\gamma _{se}(\exp {(\alpha d)}-1)} ,\end{equation}
where
 $J_0$
is considered to be the initial current near the cathode surface, due to the cosmic rays. For a self-sustaining discharge, the total current will be a non-zero value even if
 $J_0$
vanishes, i.e. the denominator of (1.5) should be zero, introducing the Townsend breakdown criterion:
 \begin{equation} \gamma _{se} (\exp {(\alpha d)}-1) =1. \end{equation}
Here,
 $\gamma _{\mathrm{se}}$
and
 $\alpha$
depend on external voltage. Rearranging,
 \begin{equation} \alpha d = \ln {\left(1+\frac {1}{\gamma _{se}}\right)} \end{equation}
By comparing (1.3) and (1.7), the breakdown voltage can be expressed as
 \begin{equation} V_B = \frac {B pd}{\ln {(Apd)}-\ln {(\ln {(1+ {1}/{\gamma _{se}})})}} .\end{equation}
Equation (1.8) is the mathematical form of the Paschen law (Loveless & Garner Reference Loveless and Garner2017; Fu et al. Reference Fu, Zhang, Verboncoeur and Wang2020), which can also be written as
 \begin{equation} V_B = \frac {Bpd}{\ln {(pd)}+C}, \end{equation}
where
 $C= \ln ({{A}/{\ln {(1+{1}/{\gamma }})}})$
(Husain & Nema Reference Husain and Nema1982). In the literature, the values of the coefficients for argon gas are reported as
 $A \approx$
10.20 mbar
 $^{-1}$
cm
 $^{-1}$
and
 $B\sim$
176 V mbar
 $^{-1}$
cm
 $^{-1}$
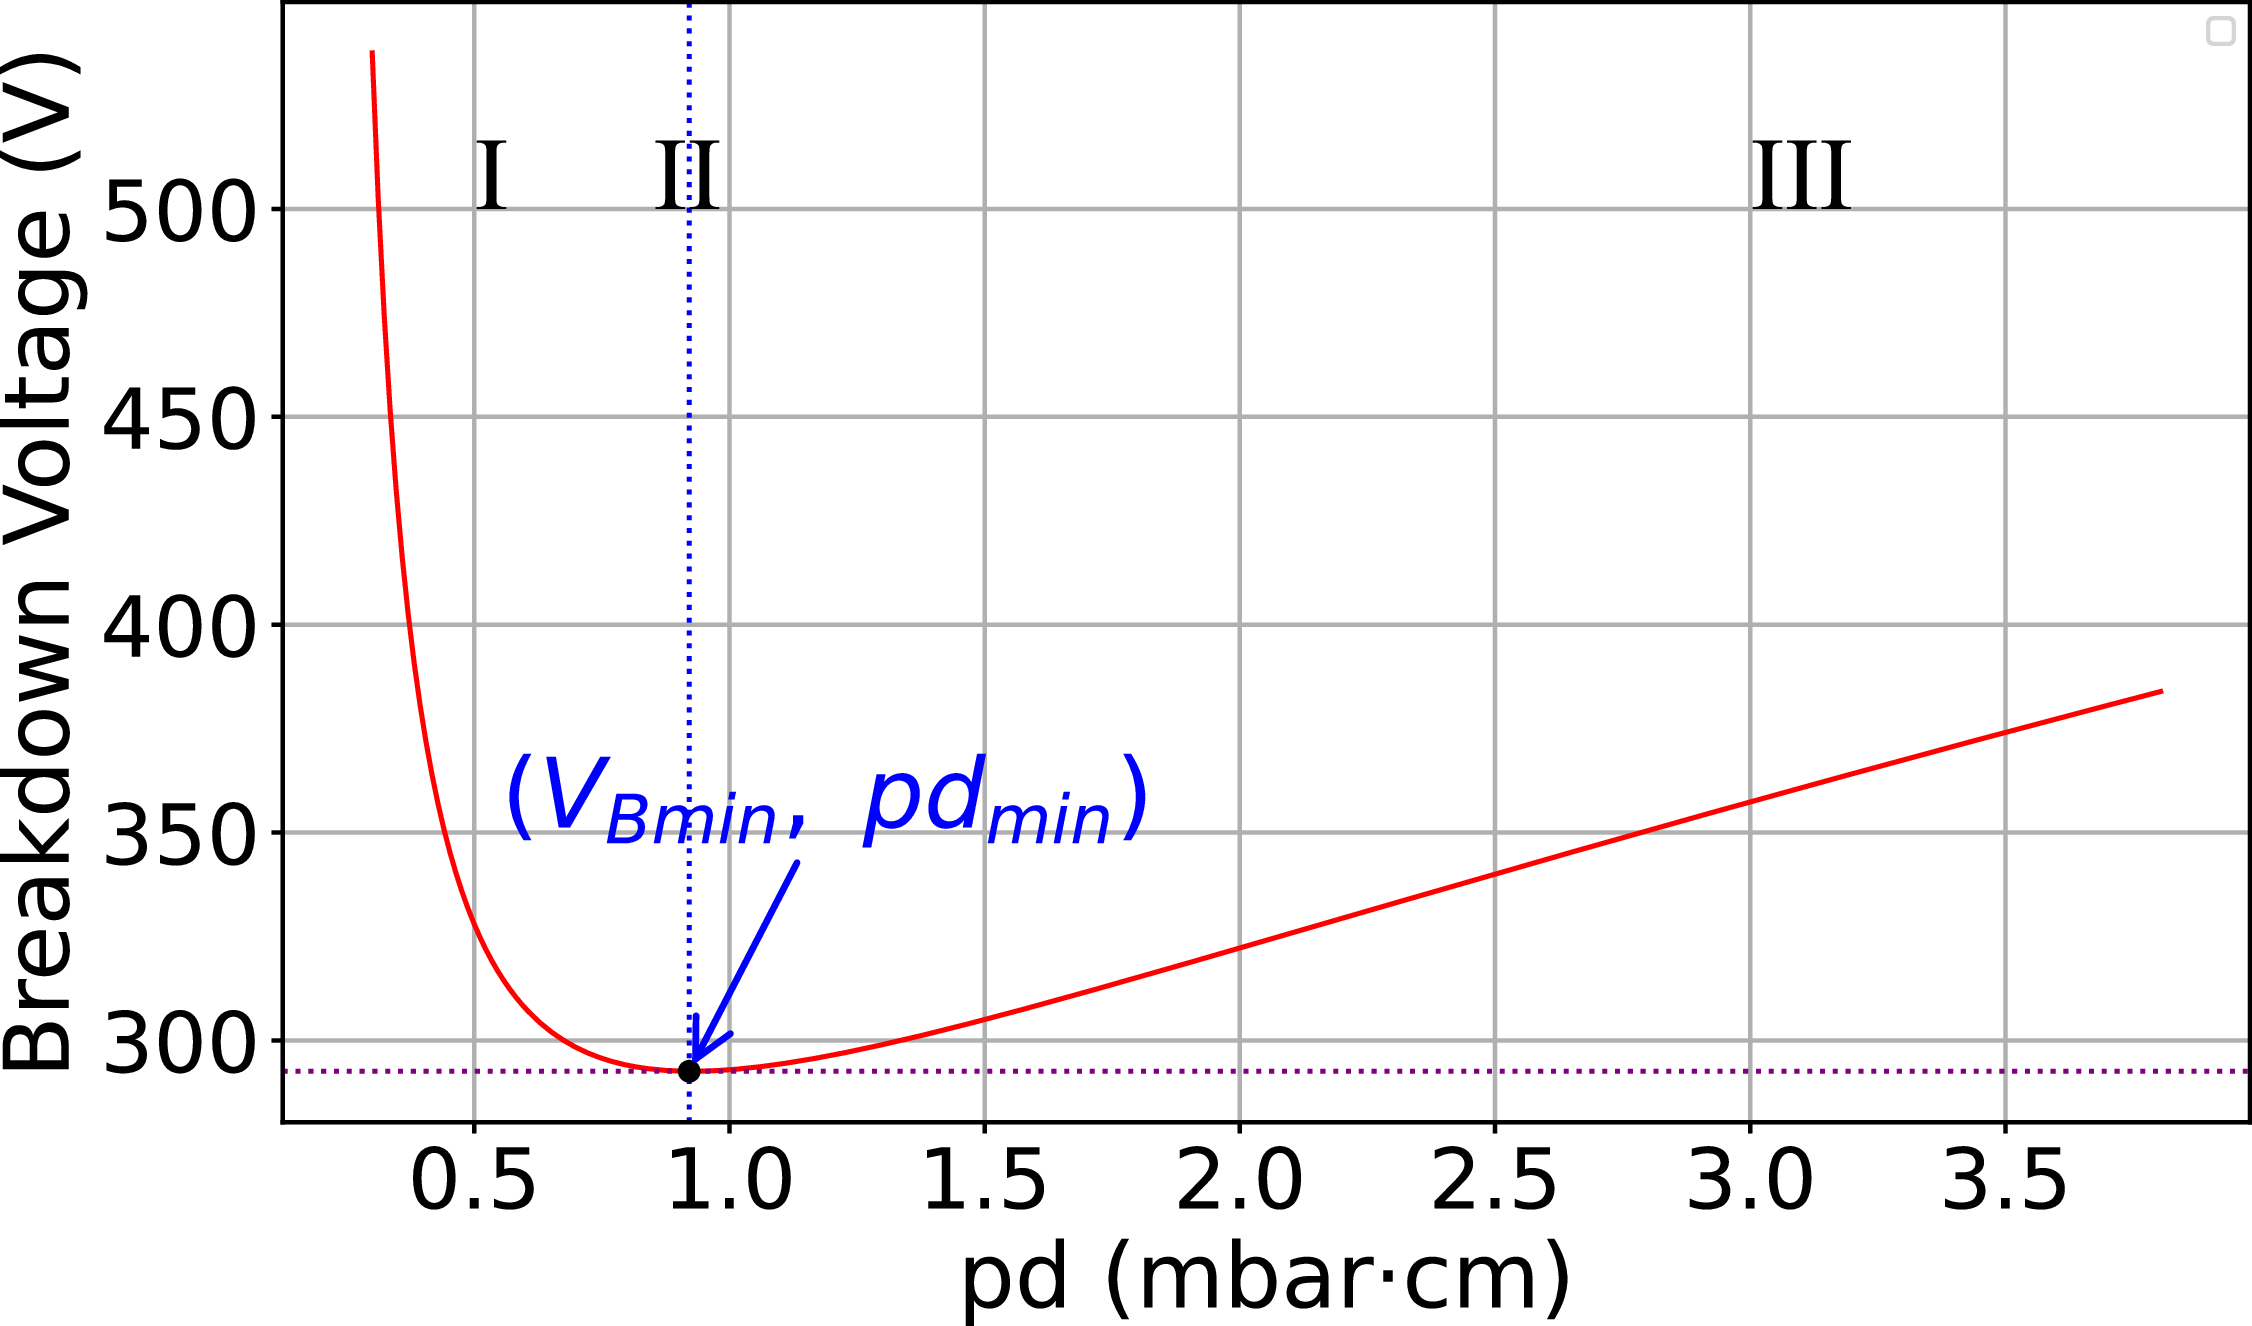
(Cobine Reference Cobine1958; Burm Reference Burm2007). The graphical representation of (1.9) is depicted in figure 1. This V-shaped curve, called Paschen’s curve, has three distinct regions (see figure 1). At lower
 $pd$
values (Region-I), the gas pressure in the chamber or the inter-electrode distance, or both, will be low, leading to a longer electron collisional mean free path. Thus, gas breakdown occurs at a higher discharge voltage. As
 $pd$
increases, the mean free path decreases and reaches a minimum point, at which the breakdown voltage is also minimum (Region-II). Further increasing
 $pd$
leads to frequent collisions, causing electrons to lose energy rapidly. Therefore, a higher voltage is required to accelerate electrons sufficiently to achieve ionisation, despite frequent energy losses leading to an increase in the breakdown voltage (Region-III).
A general Paschen’s curve for gas breakdown.

Townsend mentions that Paschen’s law is just a special case of the uniform electric field, of a more general similarity theorem, which can be applied also to non-uniform E-fields, if the breakdown depends on ionisation due to collision between electrons and neutral atoms (Townsend Reference Townsend1915). The similarity theorem is explained in detail by Von Engel (Von Engel Reference Von Engel1965; Fu et al. Reference Fu, Yang, Zou, Luo and Wang2016b
). Studies back in 1928 reported that the breakdown voltage actually depends independently on pressure and interelectrode distance, i.e.
 $V_B =f(p,d)$
rather than
 $V_B =f(pd)$
(Townsend & MacCallum Reference Townsend and MacCallum1928; Penning & Addink Reference Penning and Addink1934; Boyle & Kisliuk Reference Boyle and Kisliuk1955; Fu et al. Reference Fu, Yang, Zou, Luo and Wang2016a
). Some recent studies suggest that the size of the electrodes also affects the breakdown process, and the breakdown voltage can be expressed as
 $V_B = f(pd,{d}/{r})$
, where
 $r$
is the radius of the electrode. This is also considered as a special case of the above-mentioned similarity theorem, of a non-uniform field between parallel-plate electrodes (Mezei et al. Reference Mezei, Cserfalvi, Janossy, Szöcs and Kim1998; Osmokrović et al. Reference Osmokrović, Živić, Lončar and Vasić2006; Dekić et al. Reference Dekić, Osmokrović, Vujisić and Stanković2010; Kartalović et al. Reference Kartalović, Jusić, Nikezić and Stanković2023).
Ledernez, Olcaytug & Urban (Reference Ledernez, Olcaytug and Urban2012) refined Paschen’s law using low-pressure argon experiments and Townsend’s theoretical analysis, demonstrating that the breakdown voltage depends not only on the product
 $pd$
but also independently on the electrode gap
 $d$
(Ledernez et al. Reference Ledernez, Olcaytug and Urban2012; Mathew et al. Reference Mathew, George, Mathews and Kurian2019). They introduced an effective secondary emission coefficient,
 $\gamma _{eff}$
, to replace the classical
 $\gamma _{se}$
, accounting for various emission mechanisms such as ion, metastable, photon, electron and neutral particle induced emissions. Palomares et al. (Reference Palomares, Reyes, Gómez, Rodríguez, Torres, Vergara and Martínez2022) experimentally studied ethanol (CH
 $_3$
CH
 $_2$
OH), methanol (CH
 $_3$
OH) and their mixtures, observing that Paschen curve parameters
 $A$
,
 $B$
and the secondary emission coefficient
 $\gamma$
vary with electrode geometry, specifically on the electrode radius ratio
 ${d}/{r}$
(Palomares et al. Reference Palomares, Reyes, Gómez, Rodríguez, Torres, Vergara and Martínez2022). Notably, the 50 % ethanol–methanol mixture yielded the lowest breakdown voltage, attributed to combined molecular ionisation potentials and enhanced secondary emission. Lyu et al. (Reference Lyu, Yuan, Avtaeva, Kudryavtsev, Yao, Zhou and Wang2020) modified the Paschen curve for large-area, short glow discharges by generalising the breakdown voltage formula from the classical form (1.8) to
 \begin{equation} V_B = \frac {B' (pd)^\chi }{\ln \left [ A' (pd)^\delta \right ] - \ln \left [ \ln \left (1 + {1}/{\gamma } \right ) \right ]}, \end{equation}
where
 $\chi \leqslant 1$
,
 $\delta \leqslant 1$
,
 $\gamma = {\gamma _{se}}/{\zeta }$
(
 $\zeta$
accounts for the effects of surface structure and cleanliness) and the normalised coefficients are defined as
 \begin{align} A' = A \frac {p_0 d_0}{(p_0 d_0)^\delta }, \quad B' = B \frac {p_0 d_0}{(p_0 d_0)^\chi }, \quad p_0 d_0 = 1 \,\mathrm{ Pa.m}. \end{align}
This formulation accounts for non-uniform fields and electrode geometry effects (Lyu et al. Reference Lyu, Yuan, Avtaeva, Kudryavtsev, Yao, Zhou and Wang2020).
Additional verification and refinement of modified Paschen laws have been reported by Mathew et al. (Reference Mathew, George, Mathews and Kurian2019), showing breakdown voltage variation with electrode geometry beyond the
 $pd$
product (Mathew et al. Reference Mathew, George, Mathews and Kurian2019). A study by Lisovskiy et al. (Reference Lisovskiy, Osmayev, Gapon, Dudin, Lesnik and Yegorenkov2017) presented the influence of the size of the discharge tube in influencing the electric field and in turn affecting the breakdown of gas (Lisovskiy et al. Reference Lisovskiy, Osmayev, Gapon, Dudin, Lesnik and Yegorenkov2017). Furthermore, the effects of temperature, electrode material and field emission at microscale distances have been studied extensively (Schonhuber Reference Schonhuber1969; Go & Pohlman Reference Go and Pohlman2010; Tirumala & Go Reference Tirumala and Go2010; Sili, Cambronne & Koliatene Reference Sili, Cambronne and Koliatene2011; Torres et al. Reference Torres, Reyes, Castillo and Martínez2012; Elradi et al. Reference Elradi, Ahmed, Nasser, Ghalab, Elsabagh, Hassaballa, Samir, Elakshar and Garamoon2014; Fu et al. Reference Fu, Yang, Zou, Luo and Wang2016b
; Fu et al. Reference Fu, Yang, Zou, Luo and Wang2017; Brayfield et al. Reference Brayfield, Fairbanks, Loveless, Gao, Dhanabal, Li, Darr, Wu and Garner2019; Galli et al. Reference Galli, Hamrita, Jammes, Kirkpatrick, Odic, Dessante and Molinié2019; Radwan et al. Reference Radwan, Azouz, Samad and El-Khabeary2023). These results collectively suggest a generalised breakdown voltage relation:
 \begin{equation} V_B = f\left (pd, d, \frac {d}{r}, T, \text{geometry}\right ) \!, \end{equation}
which reduces to classical Paschen’s law under uniform electric fields and typical electrode configurations. Levko, Arslanbekov & Kolobov (Reference Levko, Arslanbekov and Kolobov2019) studied the gas breakdown with voltage pulses of different rising times. With a faster rise in the applied voltage across the electrodes, ions do not have sufficient time to reach the cathode. Therefore, the role of secondary electrons emitted from the cathode can be neglected. Second, for a faster rise time, the electron distribution function gets modified. Therefore, the constant E-field approximation is not valid to estimate the ionisation rate. However, in the DC discharge case, we consider the role of secondary electrons as well as the constant E-field approximation to understand the breakdown mechanism of gases.
It is a fact that extensive studies have been conducted to understand the electric breakdown of different gases under different experimental conditions. However, many open questions remain regarding the validity of Paschen’s law in non-uniform electric fields with different-sized electrode configurations. Is there a threshold inter-electrode distance up to which Paschen’s law is valid in the case of a symmetric or asymmetric electrode configuration? How does the minimum breakdown voltage vary with increasing inter-electrode spacing in symmetric and asymmetric electrode configurations? How does the
 $pd_{\textrm{min}}$
correspond to the breakdown voltage vary with increasing inter-electrode spacing in symmetric and asymmetric electrode configurations? How much additional voltage is required to initiate the breakdown in the case of different geometric-sized electrode configurations? To address these questions, numerous experiments with symmetric and asymmetric electrode configurations (cathode and anode) are performed in a newly built direct current (DC) discharge plasma device. The results reveal that the existing Paschen law does not adequately describe the breakdown characteristics for these electrode geometries at different inter-electrode spacings. Furthermore, the commonly proposed modifications to Paschen’s law, which incorporate additional parameters or adjustment factors, also fail to accurately explain the observed experimental behaviour. Consequently, a more general form of Paschen’s law was proposed to account for the effects of electrode configurations and inter-electrode spacings. We have also examined the variation of
 $pd_{\min}$
and the breakdown voltage as a function of the inter-electrode distance, highlighting the influence of electrode asymmetry and size on the discharge behaviour.
A detailed description of the experimental set-up and pd curve measurements is given in § 2. The experimentally observed pd curves, variations in breakdown voltage, and shifts in
 $pd_{\textrm{min}}$
for symmetric and asymmetric electrode configurations are presented in § 3. The experimentally observed results are explained in § 4. A summary of the work and concluding remarks are provided in § 5.
2. Experimental device and measurement
The experimental studies are conducted in a newly built in-house VMC DC (direct current) discharge plasma device at the Plasma Physics Laboratory. A photograph of the VMC DC discharge plasma device is depicted in figure 2. The device consists of a cylindrical borosilicate glass tube, 70 cm in length and 10 cm in radius, with 5 radial and 2 axial ports. The end ports of the tube are used to fix the cathode and anode, while the radial ports are used to evacuate the glass chamber through a rotary pump, measure the gas pressure using a Pirani gauge, and feed gas through a needle valve. The position of the cathode and the anode can be changed by moving the stainless steel 304 rods through the end-port flanges. A schematic diagram of the experimental set-up is shown in figure 3. The cathode and anode of desired sizes were made in the in-house physics workshop from an aluminium sheet of 5 mm thickness and their front surfaces were mechanically polished to obtain a visually smooth finish prior to each set of measurements. The rear surfaces of the electrodes are covered with heat-resistant insulating material, polytetrafluoroethylene, to prevent additional areas of the cathode and anode from being exposed. Two additional insulating (Acrylic) disks, mounted on SS rods, are fixed inside the chamber to keep the electrodes parallel to each other at a greater distance. A DC power supply (1000 V, 1 A) is used to provide the voltage necessary to initiate the breakdown of argon gas at a given gas pressure (p) and inter-electrode distance (d). The glass tube is evacuated to the lowest base pressure (
 ${\sim}10^{-3}$
mbar) and then injected argon gas to conduct experiments.
A DC discharge plasma set-up: (i) borosilicate glass tube; (ii) rotary pump; (iii) digital ammeter; (iv) pressure gauge; (v) needle valve; (vi) electrodes; (vii) supporting insulating disk; (viii) and (ix) SS-304 rods; (x) argon gas pipe connected to cylinder; and (xi) oscilloscope.

To measure the breakdown voltage at given values of
 $p$
and
 $d$
, an ammeter is connected in series with the discharge path. A sudden jump in discharge current indicates the gas breakdown point, and the corresponding voltage is recorded as the gas breakdown voltage. The breakdown voltage is measured by keeping the inter-electrode spacing (
 $d$
) constant and varying the gas pressure. The same exercise is repeated after changing the inter-electrode distance for a given cathode–anode size configuration. In this way, a Paschen curve (
 $pd$
curve) is constructed for a given electrode configuration. The same exercise is repeated three times on different days to confirm the consistency of the observed
 $pd$
curves for a given electrode configuration and the average value of
 $V_B$
and
 $pd_{\textrm{min}}$
of all three experiments is plotted in respective figures. For another set of experiments with different electrode configurations, the electrodes (cathode and anode) are replaced by opening the device’s side ports. It should be noted that although no additional microscopic characterisation (for example, SEM) of the surface roughness was performed, the electrodes were smoothed and cleaned well for all experiments, and avoided possible conducting paths by using insulation. The conducting path is limited to the area between the front of the cathode and the anode. For a subset of conditions at both low and high
 $pd$
, we also compared the directly measured
 $V_B$
values (with a sudden jump in current) with breakdown voltages obtained by extrapolating the discharge voltage to zero current in the low-current (dark Townsend) discharge regime following the procedure of Petrović and Phelps (Reference Petrović and Phelps1997). The difference in
 $V_B$
with the two methods was found to be less than the range of error over the average value (
 $\lt$
5 %), so the final results are considered true with the direct measurement of
 $V_B$
in this present study.
Schematic diagram of experimental set-up.

3. Experimental results
To study argon gas breakdown with symmetric and asymmetric electrodes of different sizes in an insulating glass tube at various pressures and inter-electrode spacings, numerous experiments are conducted. We define a ‘symmetric electrode configuration’ as one in which the electrodes are similarly sized, and an ‘asymmetric electrode configuration’ as one in which the anode is smaller in size than the cathode.
Experimental data obtained from various electrode configurations were initially fitted to the classical Paschen law (1.9) using the reported coefficient values. As anticipated, substantial deviations were observed, particularly at both small (
 $\sim$
1 cm or 2 cm) and large (
 $\sim$
30 cm) gap distances. So, we moved on to apply modified versions of Paschen’s law, including (1.10), but this also failed to produce a better fit for the measured data.
To achieve the best agreement with our experimental data, we iteratively modified the classical equation through systematic empirical fitting, initially prioritising good curve fitting over physical interpretation. We concluded a more flexible parametrisation and introduced a more general form for the Paschen law that offered an accurate fit for all tested configurations:
 \begin{equation} V_B = \frac {B^*(pd)^k}{\ln(pd)^m +C^*} ,\end{equation}
where
 $B^*$
is a corrected form of the gas-dependent coefficient (originally denoted as
 $B$
), having a value observed to vary across the range for different
 $d$
values. The parameter
 $C^*$
encompasses contributions from both the secondary electron emission coefficient and constant
 $A$
, with values ranging from 1 to 15 over the measured
 $pd$
regime. As expected, the exponents
 $k$
and
 $m$
deviate from unity, indicating a dependence on
 $d$
, which highlights the departure from the original Paschen’s equation and the presence of nonlinear effects. This generalisation accommodates the observed empirical deviations and provides a more accurate fit to the measured breakdown voltages across all electrode configurations examined. This form yields excellent fits (
 $R^2 \gt 0.99$
for most curves).
As for the role each parameter plays in altering the shape of the curve,
 $B^*$
and
 $C^*$
mainly shift the curve vertically, while
 $m$
and
 $k$
adjust the slope and play no role in determining
 $pd_{\textrm{min}}$
. As the value of
 $C^*$
increases, the minimum breakdown voltage decreases and slightly shifts
 $pd_{\textrm{min} }$
to the left, but has a small effect on the slope. In contrast, the parameter
 $B^*$
moves the minimum breakdown voltage upward. Also, as
 $B^*$
increases, the slope of the right branch of the curve increases. The parameters
 $m$
and
 $k$
, while keeping
 $pd_{\textrm{min}}$
constant, focus on adjusting mainly the right branch of the slope. As
 $m$
increases, the slope of the right branch decreases, but the right branch increases with increasing
 $k$
values. The left branch of the curve has a steep slope, but it changes slightly when the parameter values are altered.
Experimentally observed Paschen breakdown curves (
 $pd$
curves) for symmetric and asymmetric electrode configurations, validation of proposed modified Paschen’s law (3.1), variation of
 $V_{B_{\textrm{min} }}$
(
 $V_B$
corresponding to minimum
 $pd$
) and
 $pd_{\textrm{min}}$
with inter-electrode gap (
 $d$
) for different electrode configurations are discussed in the respective subsections.
3.1. Experiments with 80 mm diameter cathode
Fitted Paschen curves for (a) symmetric (80 mm cathode and 80 mm anode diameter) configuration and (b) asymmetric (80 mm cathode and 20 mm anode diameter) configuration at different inter-electrode distances.

The experiments are performed with a symmetric electrode configuration (cathode and anode of 80 mm diameter) and an asymmetric electrode configuration (cathode of 80 mm and anode of 20 mm diameter) to explore the role of both configurations in gas breakdown. Figures 4(a) and 4(b) represent the variation of
 $V_B$
versus
 $pd$
for the symmetric and asymmetric electrode configurations, respectively. Across different electrode gaps, the proposed modified Paschen relation (3.1) provides a better fit to the measured pd curves than classical formulations. Both configurations showed similar overall Paschen curve trends, but the Paschen minimum (
 $V_{B_{\textrm{min} }}$
,
 $pd_{\textrm{min}}$
) is observed to shift in every curve.
For closer inspection, the
 $V_B$
corresponding to
 $pd_{\textrm{min}}$
at different inter-electrode distances are extracted from the obtained
 $pd$
curves for both electrode configurations. The variation of
 $V_B$
corresponding to
 $pd_{\textrm{min}}$
against
 $d$
for both configurations is displayed in figure 5(a). It is clear from figure 5(a) that
 $V_B$
remains nearly constant up to
 $d \lt$
6 cm and then starts to increase approximately linearly up to
 $d = 30$
cm. The argon gas breakdown occurs at a lower applied DC voltage (
 $\sim$
250 V) in the symmetric configuration, where both electrodes are close to each other (
 $d \lt 80$
mm). However,
 $\sim$
140 more volts are required to initiate argon breakdown when both electrodes are 30 cm apart, demonstrating the influence of the inter-electrode gap on the breakdown process.
(a) Variation of
 $V_{B}$
, corresponding to the minimum value of
 $pd$
with inter-electrode spacing for symmetric (80 mm cathode and 80 mm anode diameter) and asymmetric electrode (80 mm cathode and 20 mm anode diameter) configurations. (b) Variation of
 $pd_{\textrm{min}}$
with inter-electrode spacing for symmetrical and asymmetric electrode configurations.

However, the scenario is slightly different in an asymmetric electrode configuration. We observe a sudden linear increase in
 $V_B$
up to
 $d\lt$
4 cm, then it varies slowly between 4 and 6 cm, and after that, it increases linearly with increasing the electrode gap up to
 $d$
= 30 cm. In the asymmetric configuration, gas breakdown happens at a higher DC voltage at any inter-electrode separation. An additional 25–50 volts are required to trigger the breakdown when electrode spacing is changed from
 $d =$
1 to 30 cm [see figure 5(a)].
Figure 5(b) deals with the variation of
 $pd_{\textrm{min}}$
against
 $d$
for both electrode configurations. The plots in figure 5(b) show that the value of
 $pd_{\textrm{min}}$
is slightly higher when the electrodes are very close (
 $d \lt$
2 cm) to each other. The
 $pd_{\textrm{min}}$
shifts towards a lower value and then again attains the same value as the spacing (
 $d \lt$
10 cm) between cathode and anode increases. A nearly linear increase in
 $pd_{\textrm{min}}$
is observed beyond
 $d \gt$
10 cm for both electrode configurations. However, there is no significant difference in the variation of
 $pd_{\textrm{min}}$
with
 $d$
between symmetric and asymmetric electrode configurations. Such a variation in
 $pd_{\textrm{min}}$
is reported for the first time in DC gas breakdown. For further verification, experiments were conducted with cathode configurations of 40 and 20 mm.
3.2. Experiments with 40 mm diameter cathode
The second set of experiments used a cathode of 40 mm diameter paired with a 40 and 20 mm diameter anode for comparison of symmetric and asymmetric electrode configurations. The breakdown voltage against
 $pd$
values for the symmetric (40–40 mm) and asymmetric (40–20 mm) electrode configurations is plotted in figures 6(a) and 6(b), respectively. All data are analysed using the modified Paschen breakdown law, and the extracted curve parameters show modest deviations from those for the 80 mm cathode experiments, owing to the role of electrode size in argon gas breakdown.
Fitted Paschen curves for (a) symmetric (40 mm cathode and 40 mm anode diameter) configuration and (b) asymmetric (40 mm cathode and 20 mm anode diameter) configuration at different inter-electrode distances.

(a) Variation of
 $V_{B}$
, corresponding to the minimum value of
 $pd$
with inter-electrode spacing for symmetric (40 mm cathode and 40 mm anode diameter) and asymmetric electrode (40 mm cathode and 20 mm anode diameter) configurations. (b) Variation of
 $pd_{\textrm{min}}$
with inter-electrode spacing for symmetrical and asymmetric electrode configurations.

The
 $pd$
curves for symmetric and asymmetric electrode configurations are used to determine the minimum
 $V_{B}$
and
 $pd_{\textrm{min}}$
at different inter-electrode distances. For the symmetric case,
 $V_B$
remains nearly constant up to
 $d \leqslant$
4 cm and then it increases linearly with further increase in the inter-electrode spacing. However, the rate of increase of
 $V_{B}$
is observed to be slightly higher for
 $d \lt$
10 cm compared with
 $d \gt$
10 cm. Argon gas breakdown occurs at a lower applied DC voltage (
 $\sim$
265 V) in the symmetric configuration when both electrodes are close to each other (
 $d \lt$
4 cm). However,
 $\sim$
170 additional voltage is required to initiate the breakdown of argon if both electrodes are placed 30 cm apart from each other.
In the asymmetric electrode configuration, we see a nearly 10 V difference in
 $V_{B}$
if the electrode spacing increases from 1 to 4 cm (see figure 7
a). Further increase in the inter-electrode spacing,
 $V_B$
corresponding to
 $pd$
minimum, increases linearly with slightly different rates between
 $d=$
4 and 30 cm. The gas breakdown occurs at
 $\sim$
280 V when both electrodes are very close to each other (
 $d$
= 1 cm). However, we need a
 $\sim$
500 V potential difference between cathode and anode when the inter-electrode spacing is approximately 30 cm. In this case, the breakdown voltage difference of
 $\sim$
220 V is observed if the inter-electrode distance is increased from 1 to 30 cm. After comparing the minimum value of
 $V_{B}$
in figure 7(a) for both electrode configurations, it is concluded that gas breakdown occurs at a lower discharge voltage when both electrodes are of the same dimensions (40 mm in diameter). However, the value of
 $V_B$
does not remain the same for all inter-electrode spacings, which contradicts the classical Paschen law.
In figure 7(b),
 $pd_{\textrm{min}}$
is plotted against
 $d$
for both electrode configurations. We observe a shift in
 $pd_{\textrm{min}}$
from a slightly larger value to a minimum value as the electrode spacing increases from 1 to 2 cm. After that (
 $d\gt$
2 cm), it increases with increasing
 $d$
and again attains the same value at
 $d\sim$
10 cm. The value of
 $pd_{\textrm{min}}$
increases with increasing the inter-electrode distance from 10 to 30 cm for both electrode configurations. However, we do not observe a significant difference in the variation of
 $pd_{\textrm{min}}$
with
 $d$
between symmetric and asymmetric electrode configurations. The
 $pd_{\textrm{min}}$
follows a nearly similar trend, with a slight difference in its value at a given
 $d$
for the symmetric and asymmetric electrode configurations.
3.3. Experiments with 20 mm diameter cathode
Fitted Paschen curves for (a) symmetric (20 mm cathode and 20 mm anode diameter) configuration and (b) asymmetric (20 mm cathode and 10 mm anode diameter) configuration at different inter-electrode distances.

(a) Variation of
 $V_{B}$
, corresponding to minimum value of
 $pd$
with inter-electrode spacing for symmetric (20 mm cathode and 20 mm anode diameter) and asymmetric electrode (20 mm cathode and 10 mm anode diameter) configurations. (b) Variation of
 $pd_{\textrm{min}}$
with inter-electrode spacing for symmetrical and asymmetric electrode configurations.

To explore the role of a smaller cathode in gas breakdown, additional experiments are performed with a 20 mm-diameter cathode and different-sized anodes (20 and 10 mm). The Paschen breakdown curves (
 $V_B$
versus
 $pd$
) for the symmetric and asymmetric electrode configurations are plotted in figures 8(a) and 8(b), respectively. The obtained
 $pd$
curves in both cases are fitted to the proposed modified Paschen law. The values of fitted coefficients are slightly different from those recorded in the case of an 80 and 40 mm-diameter cathode.
The plotted
 $pd$
curves at different
 $d$
are used to determine the minimum breakdown voltage and the corresponding minimum
 $pd$
(
 $pd_{\textrm{min}}$
). In the case of a symmetric electrode configuration,
 $V_{B}$
remains nearly constant up to
 $d \leqslant$
3 cm and then varies linearly with further increasing the inter-electrode spacing. It is clear from figure 9(a) that
 $V_{B}$
increases at a higher rate when the electrode spacing is between 3 and 11 cm. Then,
 $V_{B}$
increases continuously at a lower rate until the inter-electrode distance reaches 30 cm. The gas breakdown occurs at a comparatively low applied DC voltage (
 $\sim$
280 V) in the symmetric configuration, where both electrodes are close to each other (
 $d \lt$
2 cm). However,
 $\sim$
240 additional volts are required to achieve the gas breakdown when electrodes are placed 30 cm apart from each other.
It is understandable from figure 9(a) that
 $V_{B}$
variation against
 $d$
for asymmetric electrode configuration follows nearly the same trend that is recorded for the symmetric configuration. In the asymmetric case, gas breakdown occurs at
 $\sim$
300 V when the electrodes are very close to each other (
 $d \lt$
3 cm). However, we need a
 $\sim$
550 V voltage difference between cathode and anode if the inter-electrode spacing is approximately 30 cm. The estimated voltage difference in this case is
 $\sim$
250 V if the inter-electrode distance is increased from 1 to 30 cm. A comparative analysis indicates that gas breakdown typically occurs at a lower discharge voltage when a symmetric electrode configuration (20 mm cathode-20 mm anode) is used in the experiments. A slightly elevated voltage (20–30 V) is required to initiate gas breakdown in the asymmetric electrode configuration. It should also be noted that, in both symmetric and asymmetric electrode configurations, the required discharge voltage to initiate gas breakdown increases with increasing inter-electrode spacing. It is also noticed from figure 9(a) that there is no significant role of electrode asymmetry on the gas breakdown processes for smaller-sized electrodes.
Figure 9(b) shows the variation of
 $pd_{\textrm{min}}$
against
 $d$
for both electrode configurations. A shifting of
 $pd_{\textrm{min}}$
from a slightly larger value to a minimum value is observed with changing inter-electrode spacing from 1 to 2 cm. After that (
 $d \gt 2$
cm),
 $pd_{\textrm{min}}$
increases at a comparatively higher rate as
 $d$
increases to 10 cm. When the inter-electrode distance is greater than 10 cm, a continuous increase in
 $pd_{\textrm{min}}$
is observed, with a lower rate in both configurations. However, we do not observe a significant difference in the variation of
 $pd_{\textrm{min}}$
with
 $d$
between symmetric and asymmetric electrode configurations.
3.4. Comparative study of Paschen minimum for symmetric configurations
The experimentally obtained value of
 $V_{B}$
and
 $pd_{\textrm{min}}$
for different-sized symmetric electrode configurations are compared in figures 10(a) and 10(b), respectively. The gas breakdown occurs at a comparatively lower discharge voltage for larger electrodes (80 mm in diameter) than for smaller ones (20 mm in diameter). For a fixed gap of approximately 5 cm, the
 $V_B$
for 20 mm electrodes is roughly 50 V higher than that for 80 mm electrodes, and this difference grows to over 150 V as the inter-electrode spacing is increased to approximately 30 cm. At small gaps (
 $d$
= 1–2 cm), the
 $V_{B}$
difference is approximately 30 V between 20 and 80 mm electrodes, with 40 mm electrodes yielding intermediate values. For large gaps (
 $d$
= 30 cm), the difference in breakdown voltage between small and large electrodes can reach approximately 150 V.
(a) Variation of
 $V_{B}$
, corresponding to the minimum value of
 $pd$
with inter-electrode spacing. (b) Variation of pd minimum (
 $pd_{\textrm{min}}$
) with inter-electrode spacing for different symmetric configurations (80–80 mm, 40–40 mm and 20–20 mm).

At any inter-electrode distance, the gas breakdown voltage (
 $V_{B}$
) is highest for the 20 mm cathode configuration and decreases with increasing electrode size, thereby shifting the Paschen curve vertically with changes in electrode size. The smallest electrodes require higher voltages for breakdown across all gap distances.
For
 $pd_{\textrm{min}}$
, the variation is subtler at small gaps (1–5 cm), where it is nearly the same for all configurations. However, as the gap increases,
 $pd_{\textrm{min}}$
rises faster for the 20 mm electrodes compared with the 40 and 80 mm electrodes, indicating that both the minimum breakdown conditions, and the position and shape of the Paschen curve strongly depend on electrode size and spacing.
4. Discussion
Electric field distribution obtained using FEMM software for (a) symmetric (80 mm cathode and 80 mm anode diameter) configuration at
 $d=$
4 cm, (b) asymmetric (80 mm cathode and 20 mm anode diameter) configuration at
 $d=$
4 cm, (c) symmetric configuration at
 $d=$
25 cm, (d) asymmetric configuration at
 $d=$
25 cm. The horizontal axis corresponds to the direction along the electrode diameter and the vertical axis represents the distance between the electrodes. The black curves indicate the equipotential contours.

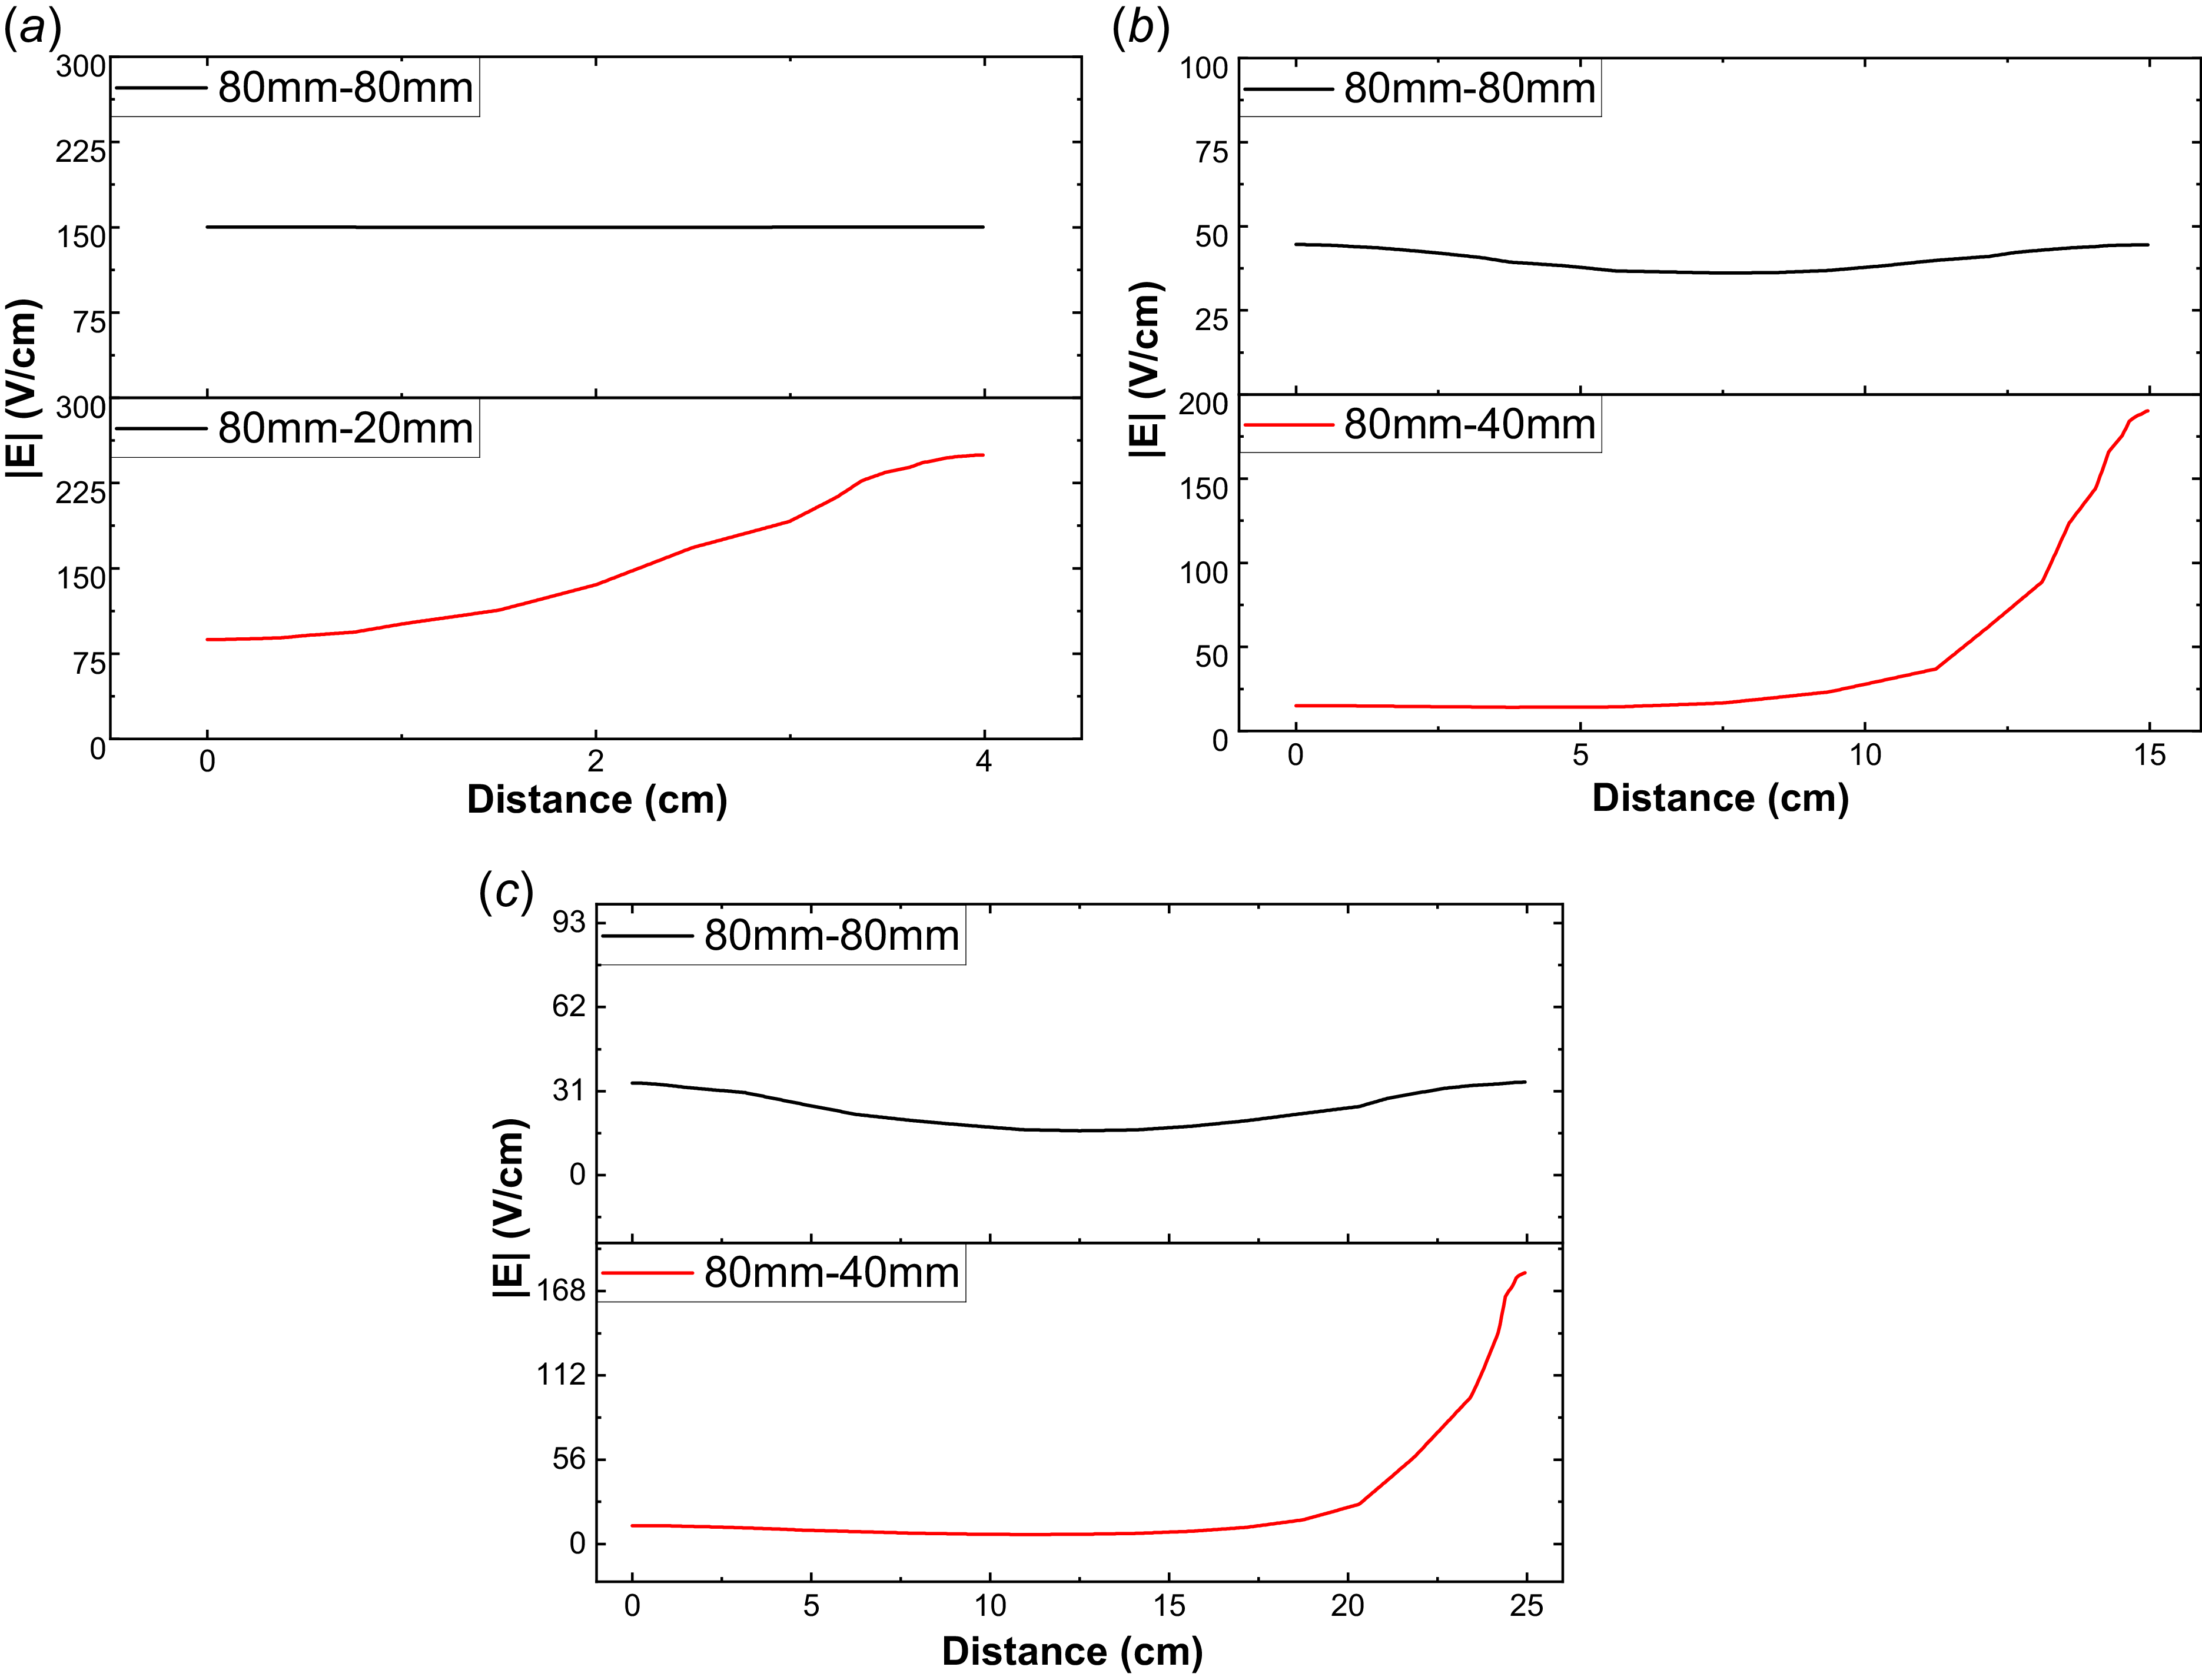
Axial electric field intensity along the line connecting the electrode centres for (a)
 $d$
= 4 cm, (b)
 $d$
= 15 cm and (c)
 $d$
= 25 cm in 80–80 mm configuration and 80–20 mm configuration.

It is evident from experimental results, which are presented in § 3, that the Paschen curve is not just a function of
 $pd$
alone, but also depends on the inter-electrode distance, size of electrodes and configuration of electrodes (symmetric or asymmetric). Other factors, such as electrode geometry, electrode type (solid or mesh) and electrode materials, also affect gas breakdown processes. The ideal Paschen curve is derived by considering a uniform electric field between electrodes (cathode and anode). Therefore, the electric field distribution (uniform or non-uniform) between biased electrodes strongly influences the gas breakdown processes through ionisation and diffusion rates. The distribution of the electric field between electrodes at different spacings and configurations (symmetric and asymmetric) may qualitatively explain the observed results. By keeping this in mind, Finite Element Method Magnetics (FEMM) software (https://www.femm.info) is used to obtain the electric field distribution (two-dimensional) between the cathode and the anode for a fixed applied voltage of 600 V in all cases (figures 11, 13 and 15). The variation in electric field intensity between the central points on cathode and anode (along axis of cylindrical tube) is separately plotted for different electrode configurations in figures 12, 14 and 16.
The two-dimensional (2-D) electric field distributions for 80 mm cathode configuration obtained from FEMM is presented in figure 11. Similar plots are observed for 40 and 20 mm cathode configurations as well, which provide a spatial picture of how the field fills the discharge region for different gaps and electrode sizes. In general, for a symmetric electrode configuration (figure 11
a), at small inter-electrode distances, it is observed to have a nearly uniform field between cathode and anode, which favours efficient ionisation throughout the volume and results in low, almost constant breakdown voltages. As the gap is increased (figure 11
c), a low-field region develops in the central part of the gap, while high fields remain localised near the electrodes, so a higher applied voltage is required to sustain an avalanche, in agreement with experimental output of
 $V_B$
versus
 $d$
. In asymmetric configurations, the 2-D plots clearly show a strong field enhancement near the smaller anode and a weaker field in the bulk, indicating increased diffusion losses and reduced effective ionisation in the middle region between electrodes, which explains why higher breakdown voltages are observed for asymmetric electrodes at the same inter-electrode spacing. Similar plots were observed across all electrode configurations (20, 40 mm cathode configurations). For closer inspection, we also examined the variation in the electric field (
 $|E|$
) along the central axial line (
 $r$
= 0 cm) between the electrodes for all electrode configurations.
Figure 12 shows the variation in electric field for symmetric (80–80 mm) and asymmetric (80–20 mm) electrode configurations along the electrode gap for
 $d=$
4, 15 and 25 cm. For a symmetric electrode configuration, the electric field remains nearly constant up to an inter-electrode distance of
 $\sim$
5 to 6 cm (figure 12
a). The nearly uniform E-field across the gap supports a more efficient ionisation process that leads to relatively lower and a constant breakdown voltages. This corresponds to the nearly constant breakdown voltage observed experimentally [figure 5(a)]. On further increasing the inter-electrode distance (15 and 25 cm), the electric field in the middle region reduces, causing a gradient with a strong field near the electrodes and a weak field in the central region [see figures 12(b) and 12(c)]. This increase in the weak-E-field region leads to a reduction in ionisation and thereby the electron avalanche development for higher inter-electrode distances, causing the breakdown to happen at higher voltage (Lisovskiy, Koval & Yegorenkov Reference Lisovskiy, Koval and Yegorenkov2011). Therefore, we see a nearly linear increase in the breakdown voltage, as shown in figure 5(a), with increasing the inter-electrode spacing beyond 6 cm.
In the asymmetric configuration (80 mm cathode and 20 mm anode), non-uniformity in E-field starts at even smaller electrode separations (
 $d\lt$
5 cm). The electric field becomes stronger and more concentrated near the anode while remaining weaker in the central region and cathode side at a given inter-electrode separation [see figure 12(a)]. This strong E-field near the smaller anode or weak E-field in the central region reduces the effective ionisation rate compared with the symmetric case; consequently, a higher breakdown voltage is required to start a gas avalanche for a given electrode gap, as is depicted in figure 5. The non-uniformity in the E-field, along with some other factors, is responsible for a linear increase in the breakdown voltage when the electrode gap is less than 6 cm. Furthermore, as the inter-electrode distance increases, the E-field gradient becomes more pronounced, maintaining the strongest field near the anode while expanding the weak E-field zone between the electrodes. The weaker E-field in the central region of the discharge gap [figures 12(b) and 12(c)] reduces the primary ionisation rates and the asymmetry increases the diffusion of charged particles from the discharge volume (a conical discharge volume is expected in the asymmetric case). Therefore, a gas avalanche is expected at a higher applied voltage at a large inter-electrode spacing (see figure 5) compared with the symmetric case.
Electric field distribution obtained using FEMM software for (a) symmetric (40 mm cathode and 40 mm anode diameter) configuration at
 $d=$
3 cm, (b) asymmetric (40 mm cathode and 20 mm anode diameter) configuration at
 $d=$
3 cm, (c) symmetric configuration at
 $d=$
25 cm, (d) asymmetric configuration at
 $d=$
25 cm. The horizontal axis corresponds to the direction along the electrode diameter and the vertical axis represents the distance between the electrodes. The black curves indicate the equipotential contours.

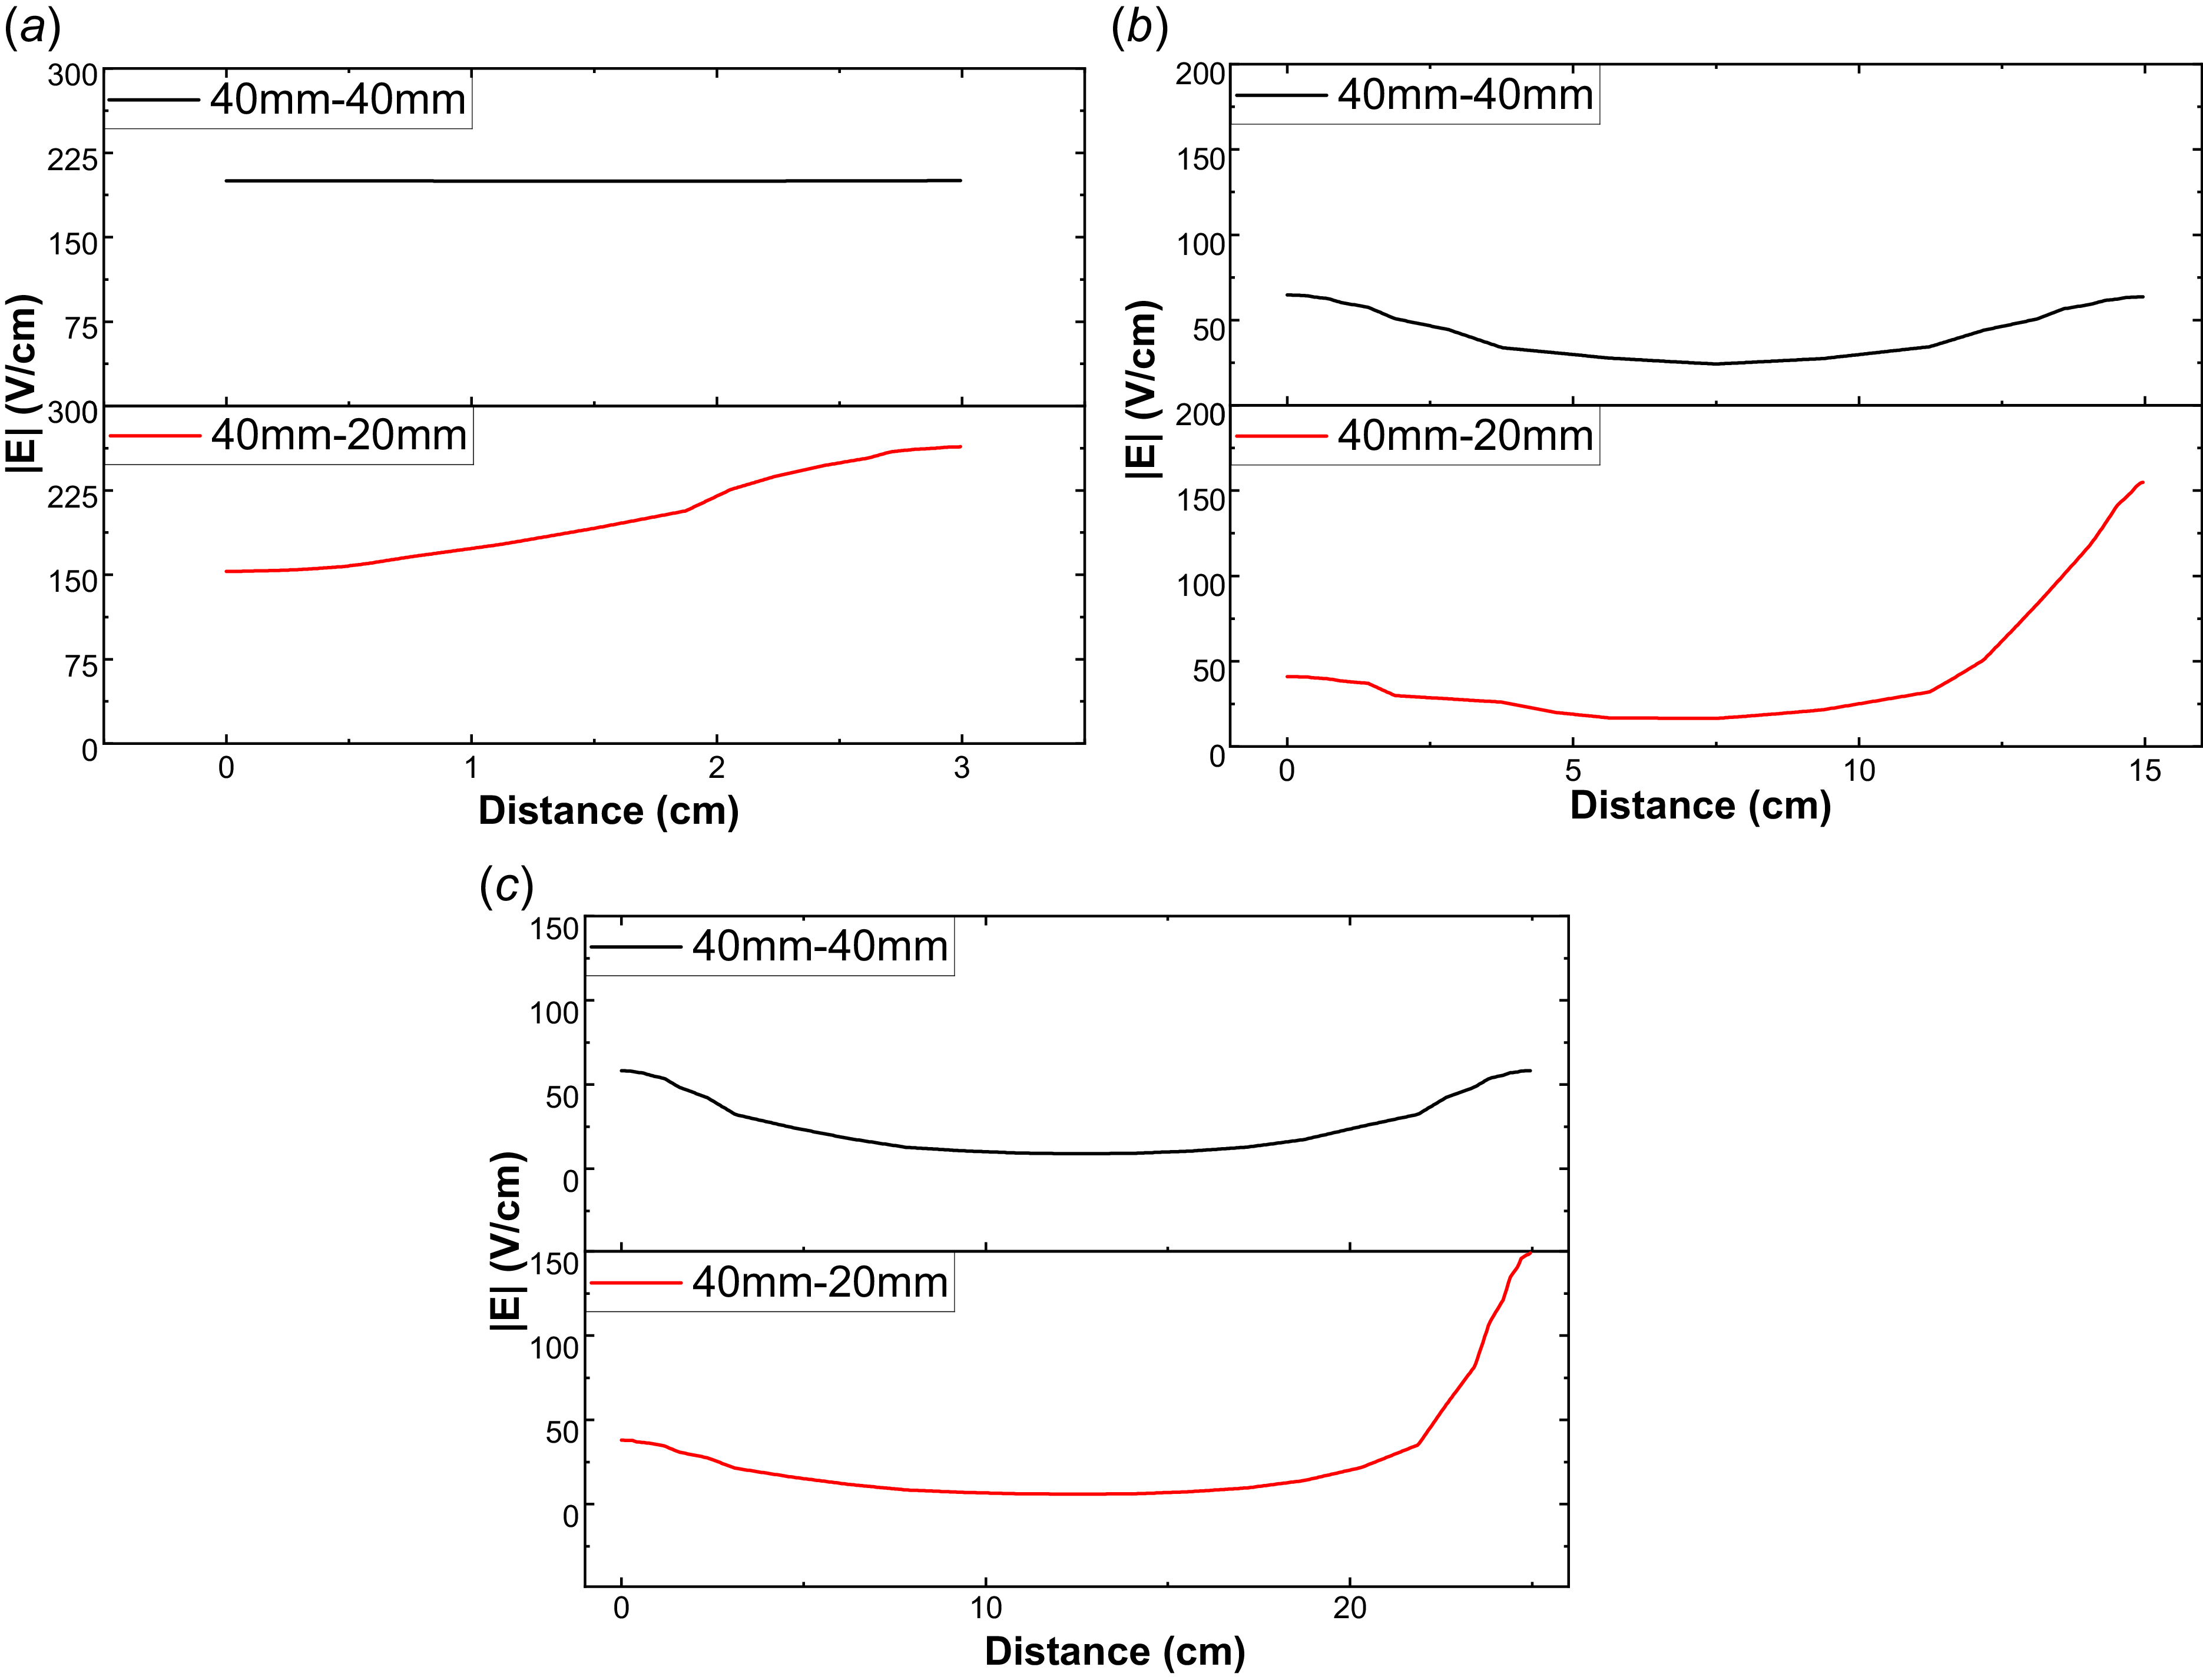
Axial electric field intensity along the line connecting the electrode centres for (a)
 $d$
= 3 cm, (b)
 $d$
= 15 cm and (c)
 $d$
= 25 cm in 40–40 mm configuration and 40–20 mm configuration.

For a 40 mm–40 mm symmetric electrode configuration, the electric field between electrodes is nearly uniform for small inter-electrode distances, specifically up to approximately 3–4 cm [figures 13(a), 14(a)]. In this region, the breakdown voltage is observed to remain low and fairly constant [figure 7(a)]. As the separation increases beyond 5 cm, the E-field profile begins to change, with strong gradients developing near the electrode surfaces and a weak E-field region expanding in the central region of the discharge gap. For intermediate gap values (
 $\lt$
12 cm), the electric field at the centre of the electrode gap is not as weak as in larger configurations (d = 25 cm), so the breakdown voltage increases at a slightly different rate. At greater separations, the central region’s field weakens much more substantially, causing the breakdown voltage to rise more sharply as a larger applied voltage is needed to sustain electron avalanches and initiate gas breakdown [see figure 7(a)]. However, for the 40 mm–20 mm asymmetric electrode configuration, the non-uniformity in the E-field begins below d
 $\lt$
4 cm. Near both electrodes, the E-field strength is non-uniform, with a notably stronger electric field concentrated near the smaller 20 mm anode. This effect reflects in
 $V_B$
variation below d
 $\lt$
4 cm in figure 7(a). As the inter-electrode spacing increases (beyond 4 cm), the field strength decreases in the middle discharge region while remaining strong near the electrodes (near the anode). This non-uniformity in the E-field reduces the effective ionisation rate and increases the diffusion rate in the bulk discharge region. Hence, high voltage is required to initiate gas breakdown in case of larger inter-electrode spacing [see figure 7(a)].
Electric field distribution obtained using FEMM software for (a) symmetric (20 mm cathode and 20 mm anode diameter) configuration at
 $d=$
2 cm, (b) asymmetric (20 mm cathode and 10 mm anode diameter) configuration at
 $d=$
2 cm, (c) symmetric configuration at
 $d=$
25 cm, (d) asymmetric configuration at
 $d=$
25 cm. The horizontal axis corresponds to the direction along the electrode diameter and the vertical axis represents the distance between the electrodes. The black curves indicate the equipotential contours.

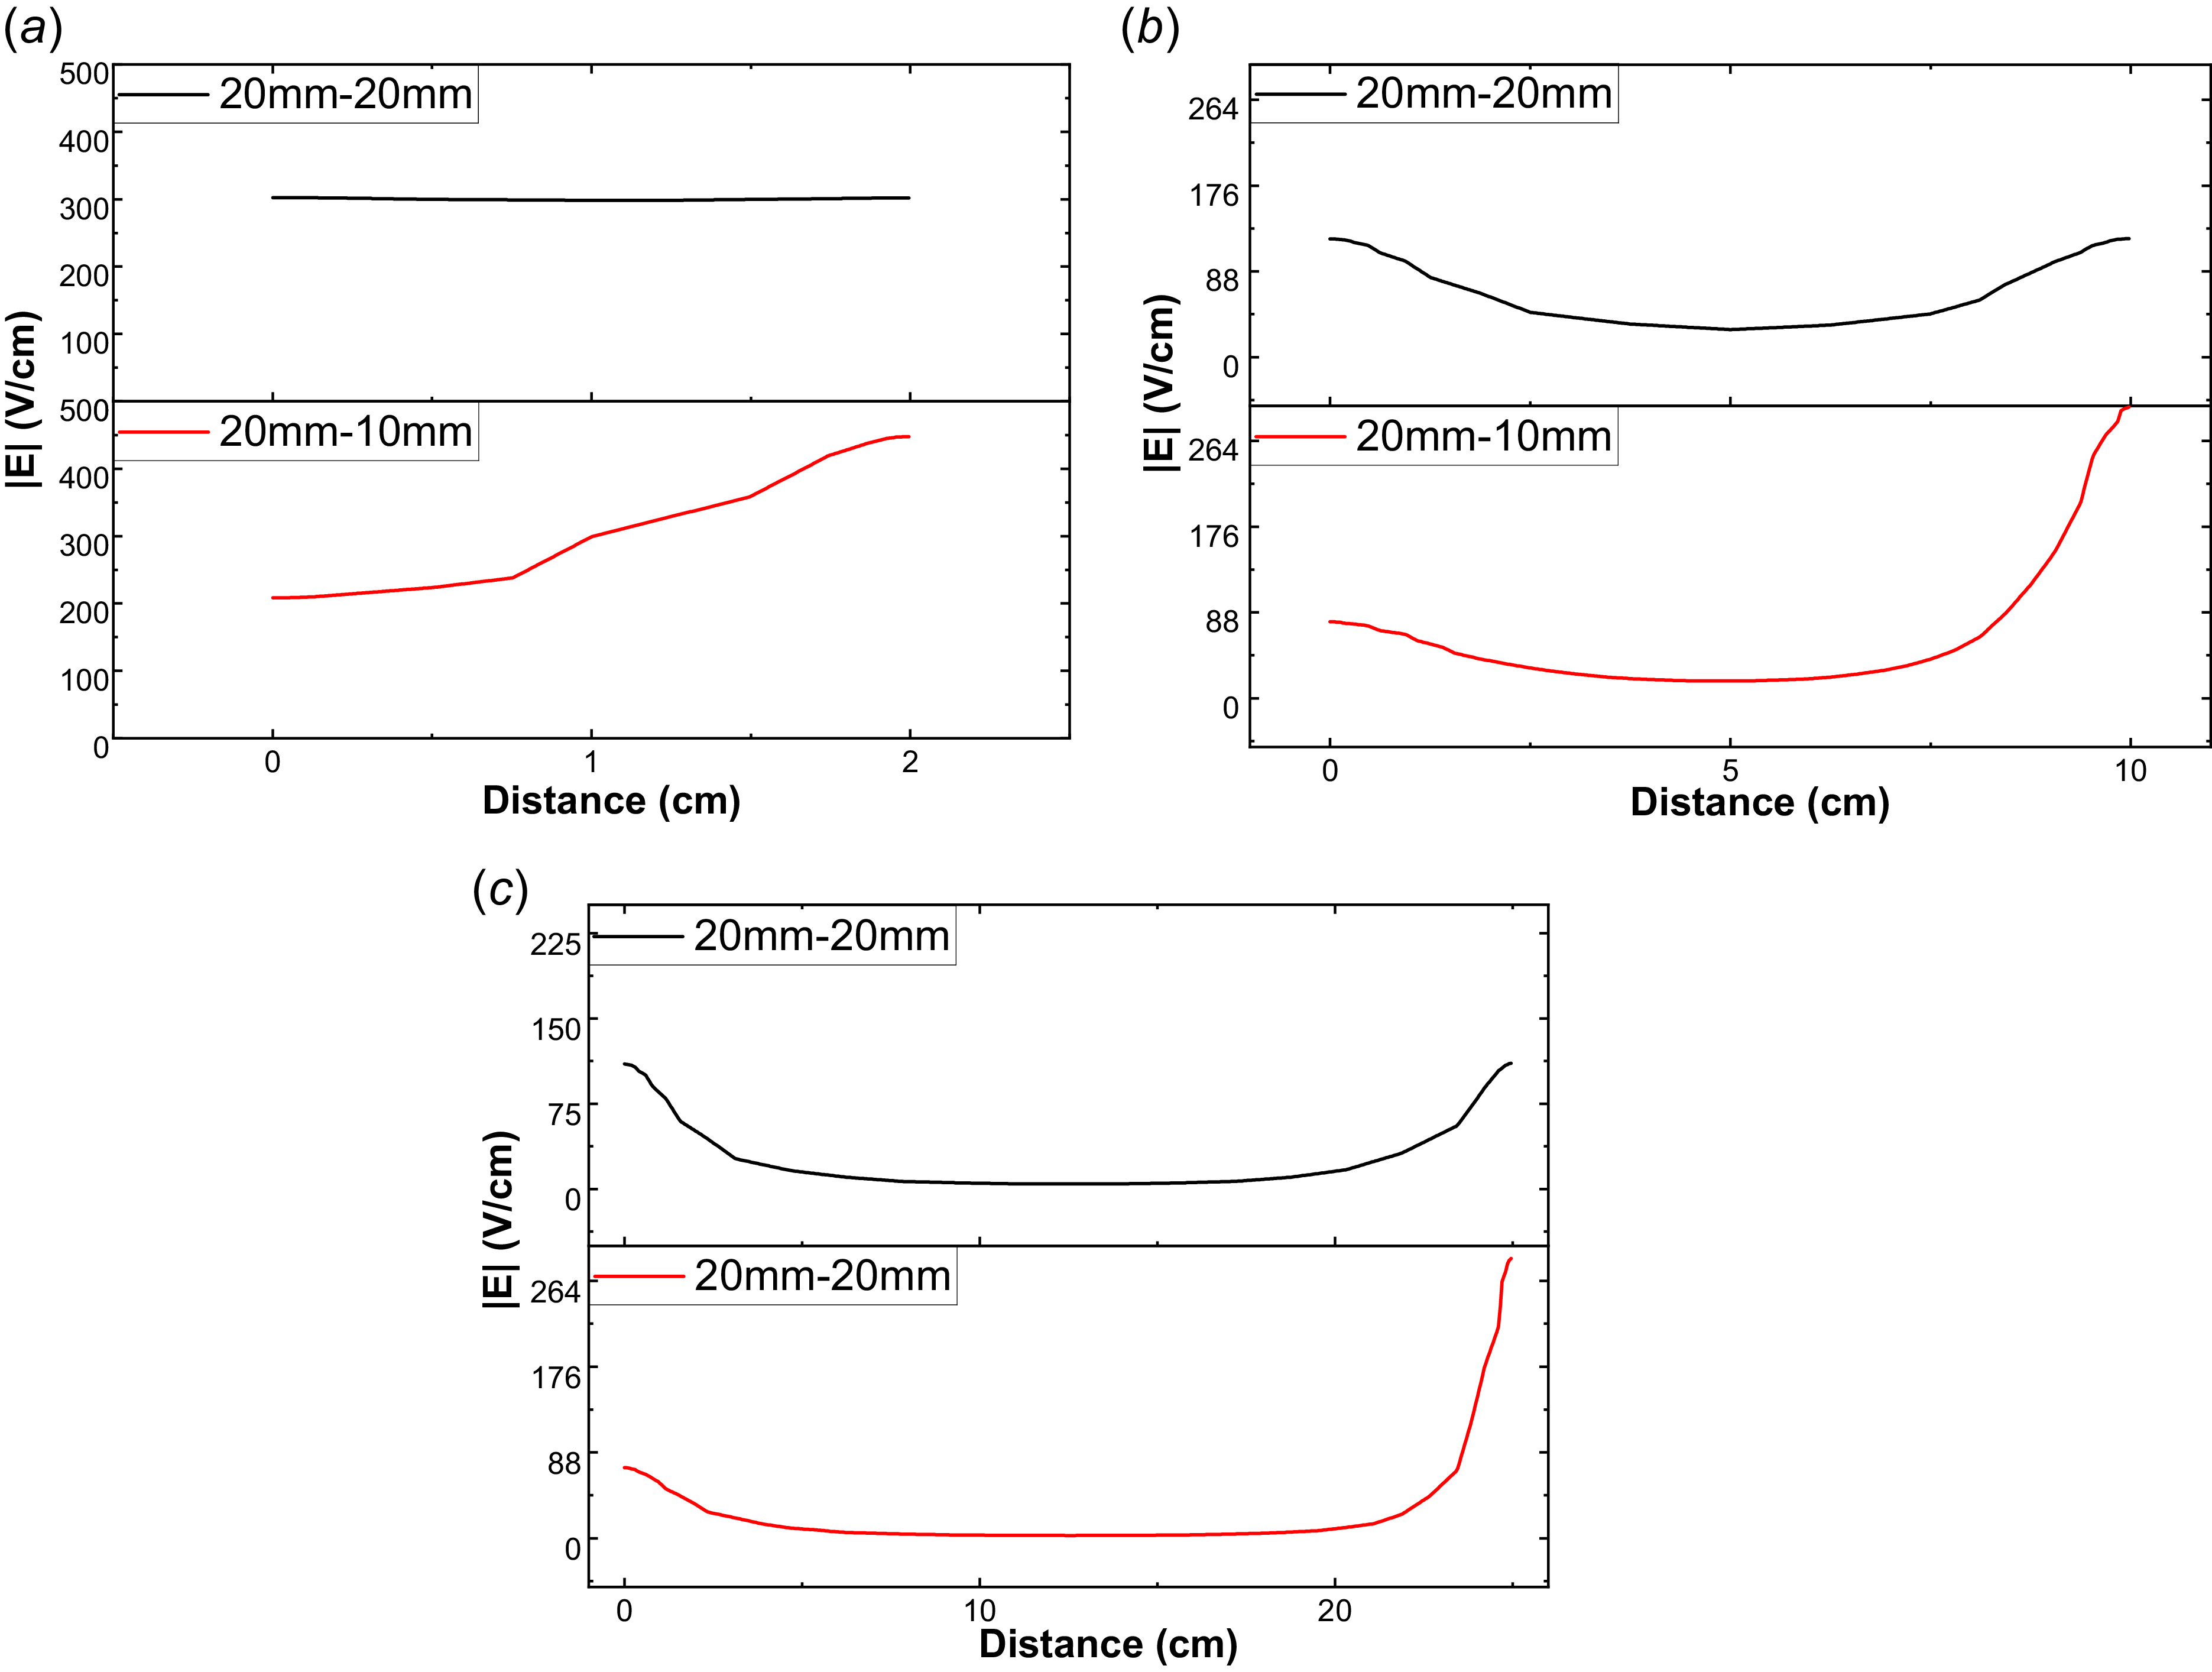
Axial electric field intensity along the line connecting the electrode centres for (a)
 $d$
= 2 cm, (b)
 $d$
= 10 cm and (c)
 $d$
= 25 cm in 20–20 mm configuration and 20–10 mm configuration.

In the case of the 20–20 mm symmetric electrode configuration, the E-field is nearly uniform up to
 $d$
= 2 or 3 cm [see figures 15(a) and 16(a)]. The uniformity in E-field causes a more consistent acceleration of electrons, leading to lower breakdown voltages [see figure 9(a)]. On further increasing the inter-electrode distance (beyond 3 cm), the E-field strength in the middle region of the discharge gap decreases and will reach a minimum value when
 $ d=$
25 cm. The length of the weak E-field region increases with the increase in inter-electrode distance [figures 15(c), 16(b) and 16(c)]. The weak E-field in the bulk discharge gap reduces ionisation rates, so more voltage is required to start an avalanche at large inter-electrode distances, as depicted in figure 9(a).
For the 20–10 mm asymmetric electrode configuration, the non-uniformity in the E-field starts before
 $d=$
2 cm. The strength of the E-field is also non-uniform near both electrodes [figure 16(a)]. This effect is reflected in an increasing trend of
 $V_B$
for smaller inter-electrode distance
 $d \lt 3$
cm, as shown in figure 9(a). With increasing distance (beyond 3 cm), the stronger E-field region is concentrated near the electrodes, especially the anode, while the weaker E-field extends into the discharge region. This spatial variation causes fewer ionising collisions in the weak field regions, increasing the overall breakdown voltage with increasing inter-electrode spacing. For asymmetric and symmetric configurations, the discharge volume is a cone and a cylinder, respectively. The diffusion rate of plasma particles is expected to be higher in the case of conical discharge volume compared with cylindrical volume, resulting in higher breakdown voltage for asymmetric electrode configuration at a given d [figure 9(a)].
In symmetric configurations with different electrode sizes (80–80, 40–40 and 20–20 mm), differences in E-field strength and discharge-region volume determine the gas breakdown voltage at a given inter-electrode spacing. The higher expected diffusion rates of plasma particles (before Townsend avalanches) and comparatively lower ionisation rates due to a weaker E-field in the bulk discharge gap in smaller-sized electrode configurations (20–20 mm) favour higher breakdown voltage compared with 80–80 mm symmetric configurations (see figure 10). It should be noted that the results of the present work are qualitatively understood based on the electric field distribution for different cases. Notably, the 2-D FEMM simulations reveal enhanced E-fields at electrode edges, which locally boost Townsend ionisation rates. However, this edge-effect contribution was not isolated in our analysis as the primary focus remained on variation in the central region. Nevertheless, other factors, such as anode material (Adams et al. Reference Adams, Demidov, Kurlyandskaya, Miles and Tolson2017), roughness of electrode surface (Adams et al. Reference Adams, Demidov, Kurlyandskaya, Miles and Tolson2017), orientation of electrodes, composition of gases, diffusion of charged particles etc., also affect the gas breakdown processes and possible sources to modify pd curves.
The theoretical value of
 $pd_{\textrm{min}}$
is obtained from (1.8) by finding out the turning point of the curve:
 \begin{equation} pd_{\textrm{min}} = \frac {e\ln {(1+({1}/{\gamma _{se}})})}{A}. \end{equation}
As per the classical Paschen law,
 $A$
and
 $\gamma _{se}$
are constant, so
 $pd_{\textrm{min}}$
should also be a constant. However, our experimental results show that these coefficients vary throughout the measurements. Also, the coefficient
 $A$
depends upon the ionisation cross-section. For larger inter-electrode gaps, the electric field in the central region will be weak, reducing the electron energy and making it insufficient for effective ionisation. Therefore, the ionisation cross-section decreases, and this in turn contributes to the increase in the
 $pd_{\textrm{min}}$
at larger inter-electrode distances as observed in the present study [figure 10(b)]. For a very small inter-electrode distance, the E-field will be too high, causing the ionisation cross-section to be large owing to the lower
 $pd_{\textrm{min}}$
observed. In the symmetric configuration [see figure 10(b)], the 20 mm configuration has a higher
 $pd_{\textrm{min}}$
because, as the electrode size reduces, the electric field in between the electrodes decreases, causing the
 $pd_{\textrm{min}}$
to increase. It is still not clear how the
 $pd_{\textrm{min}}$
varies at smaller distances when the inter-electrode distance is comparable with the radius of the electrodes.
5. Summary and future outlook
In this study, we investigated the breakdown of argon gas at different inter-electrode distances for symmetric and asymmetric electrode size configurations. The key findings of these investigations are as follows.
-
• Classical Paschen law is found to be inadequate in describing the breakdown characteristics of gas for asymmetric and symmetric electrode configurations if inter-electrode spacing is greater than the size of the cathode. However, it describes the breakdown behaviour of gas for larger-sized symmetric electrodes (e.g. 80–80 mm) when
 $d \lt$
80 mm.
-
• A modified empirical relation incorporating power-law dependencies, which better captures deviations from the classical law, is proposed and fitted to experimental data. A strong dependency of the fitting parameters on electrode configurations and inter-electrode spacing is observed.
-
• The gas breakdown happens at a higher applied voltage in asymmetric electrode configurations compared with the symmetric-sized electrode configuration.
-
• The gas breakdown strongly depends on the size of the electrodes, especially the size of the cathode. The gas breakdown voltage increases as electrode size decreases.
-
• The breakdown (corresponds to the minimum
$pd$
value) voltage increases approximately linearly for asymmetric electrode configurations as the inter-electrode gap increases. In symmetric configurations, it increases linearly once the inter-electrode gap exceeds the cathode size. -
• The minimum
$pd$
(
$pd_{\textrm{min}}$
) value shifts to a lower value and then starts to attain the original value, and then increases as the inter-electrode distance changes from minimum (1 cm) to maximum (30 cm) for both electrode configurations.


The experimentally observed results are supported by a finite-element analysis of the electric-field distribution between the cathode and anode for a given electrode configuration. The non-uniformity in the E-field, whether in a symmetric or asymmetric electrode configuration in the discharge gap, qualitatively explains the shifting of the Paschen minimum and the increase in breakdown voltages with increasing discharge gap length. It is expected that the breakdown voltage depends on the volume of the discharge zone (available volume for ionisation), which could be an additional factor, along with the E-field, in the bulk discharge regime for a difference in breakdown voltage for larger and smaller-sized electrodes. The diffusion of charged particles from the discharge zone (discharge gap) also affects the gas breakdown process in both symmetric and asymmetric electrode configurations, which is beyond the scope of the present study. For a better understanding of the observed results, detailed computational simulations of the present set-up could be a future project.
Acknowledgements
The authors sincerely thank Mr S. Tomar for his technical help in developing the plasma setup in the plasma physics laboratory. M.C. thanks Dr N. Chaubey and Dr V. Singh Dharodi for their valuable support in developing the VMC DC discharge device. The authors also extend their sincere thanks to the physics workshop and store personnel for their constant support during the development of this plasma device at the Department of Physics and Astrophysics, University of Delhi.
Editor Edward Thomas, Jr. thanks the referees for their advice in evaluating this article.
Data availability
The datasets generated during and/or analysed during the current study are available from the corresponding author upon reasonable request.
Declaration of interests
The authors declare no conflicts of interest.
Author contributions
M.C. conceived the idea for this project and performed the experiments. P.H. performed the literature search to fit and explain the experimental data. The first draft of the manuscript was written and revised by both authors. Both authors read and approved the final manuscript.








 Open access

