The United States, by the mid-twentieth century, had achieved an historically unprecedented productivity lead, with a real GDP larger than (and a real GDP per capita more than double) Western Europe's.Footnote 1 At that time the United States' industrial giants were even more dominant: they outnumbered those of Europe by two or three to one.Footnote 2 Economists investigating the sources of this productivity lead thus naturally linked it to the unparalleled opportunity to achieve scale economies offered by the United States' exceptionally large domestic market.Footnote 3 Historians, too, interrogated earlier experience to understand why many Europeans from the late nineteenth century failed to match America's scale advantages.Footnote 4 This was a natural scholarly reflex, but the argument that follows is that—for the decades before 1914, in terms of plant scale and of market size—their perspectives were almost completely misguided. That is because Europe—and especially its affluent northwest heartland—was a market space that was larger and on some dimensions more integrated than the United States.
SHIPS AND TRAINS
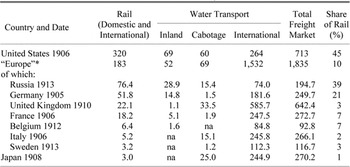
A key factor integrating European nations' economies in the early twentieth century was increasingly cheap transportation. The choice between the two main logistic options of 1900 was, to some extent, geographically determined: there were no ships in Santa Fe and no trains to Hawaii. Yet, as Table 1 shows, water substituted for rail on long-haul routes more substantially in global historical fact than in Fogel's American counter-fact. In tonne-kilometer terms, water transport dominated everywhere, though much less in North America than elsewhere.Footnote 5 These data relate to transport use: an alternative table showing national production of transportation services would increase water's share for the United Kingdom and Germany (large net exporters of shipping services) and lower it for the United States (whose share of the world's seagoing fleet had shrunk from 20 percent to 3 percent in the previous half-century).
As we move to the right in Table 1, the data become more speculative: rail freight is reasonably hard data, but column 4 is crudely estimated from a coefficient relating the known capacities of arriving and departing cargo-ships to voyage lengths and freight carried.Footnote 6 The estimated quantities cannot be relied upon, though the orders of magnitude are broadly plausible. Islands or peninsulas—Britain, Italy, Japan—naturally used ships prolifically.Footnote 7 America's use of rail was exceptionally high: only the comparable continental expanse of Russia approached it. The United States and Europe made similar use of inland waterways (the Great Lakes and the Mississippi were more than a match for the Rhine and the Volga) and cabotage (ships between domestic seaports): Europe's lead on the water was essentially in international shipping. In the case of intercontinental voyages, Europe was—by construction—an equal partner in U.S.-Europe trade, but its global engagement with Asia, Africa, Australasia, and Latin America exceeded that of the United States. Despite many common land frontiers between European countries, most cross-border trade went by sea rather than rail. Much of this was intra-European and, in that sense, treating Europe as one economic area, part of Europe's column 4 is functionally equivalent to the U.S. cabotage in column 3.Footnote 8 Perhaps a third of European marine capacity was exclusively engaged in such trade, though ships plying the oceans also stopped to pick up and set down intra-European cargoes on the way.Footnote 9 Europe's “domestic” sea freight also had a higher value-to-volume ratio than the oceanic trades, perhaps reflecting the high share of manufactures and fuel carried.Footnote 10
FREIGHT MARKET SHARES, CA. 1906

* “Europe” is the sum of the seven countries shown.
Sources:
Cols. 1–3: Barger, Transportation Industries, pp. 184, 254–56; Bureau, Transportation, p. 33 (with Barger's water traffic distance coefficients, applied to the 1906 regional tonnages); Scherer, USSR, p. 231 (with cabotage share from Williams, Freight Transportation, p. 12); Hoffmann, Wachstum, pp. 406–18, updated by Kunz, “Performance,” p. 51; Armstrong, “Role,” p. 176; Toutain, “Transports,” pp. 81, 158, 197; Laffut, “Belgium,” pp. 217–18; Mitchell, International Historical Statistics, pp. 688–89 (with ratio of Italian cabotage from Schram Railways, p. 151; and Swedish cabotage from Krantz, “Competition,” p. 30); Minami, Railroads, p. 194 (cabotage estimated from indications in Ericson, Sound, pp. 39–40, 397–98). Col. 4: Hoffmann's estimate of the German relationship between registered ship capacities, loads and voyage lengths is taken as the base coefficient, which is then applied to the national port data on the capacity of steamers entered and cleared with freight for the relevant year given in Anon, Statistical Abstract 1901/12, pp. 36–57; and Woytinsky, Welt, 5, p. 77, the resulting tonne-km being equally apportioned between destination and departure countries.
Ships had lower infrastructure costs and also had the advantage of greater fuel-efficiency and lower (more frequently crane-assisted) terminal costs.Footnote 11 Ships therefore offered tonne-km freight rates only a half or a quarter of those of land transport, even, sometimes, as low as the one-seventh achieved by the modern development of supertankers and container shipping.Footnote 12 Yet trains could still struggle to compete if speed counted. British freight trains averaged around 32 kmph and American ones around 17 kmph, and both could, if required, go faster (the fastest passenger expresses—which also carried some freight—averaged 85 kmph). At sea, tramps and tankers managed 15–17 kmph and some coastal liners 25 kmph, but 44 kmph—the top speed of ships—was attained only by a few transatlantic liners.Footnote 13 Rail was also used when there was no access by water, or it offered more direct routing. Some routes—Galveston to Key West, Stockholm to St. Petersburg, Barcelona to Genoa—were more direct (and usually faster) by ship. Even circuitous steamer routes, such as Odessa to Antwerp (more than twice as far via the Bosphorus, Mediterranean, and Atlantic than by overland rail), were cheaper, especially for low-value traffic with low inventory costs.
Marine geography, and a semi-depleted continent's global quest for raw materials that America found abundantly in its virgin interior, no doubt partly explain Europe's preference for ships, but relative prices also played a role. U.S. rail freight rates were below the European norm, whereas U.S. cabotage rates were not.Footnote 14 Possible reasons include factor costs, quality differences (freight carried, speeds, journey lengths, safety), ownership/regulation/competition, the U.S. ban on foreign crews and cabotage (compared with Europe's, largely open, ports), and the failure to invest in Panama as speedily as Europe invested in ship canals.Footnote 15 Some of these imply that marginal social costs differed from market prices.Footnote 16 Whatever the reasons, the upshot is clear: the American domestic market was glued together primarily by the train, but the First European Integration was driven by the ship. Europe's long-haul costs per tonne-km were thus below what they would have been with a U.S. ship-train mix. The European imperialists, who argued for emulating transcontinental American railroads on what they then thought of as their frontier—whether it was unifying the Tsar's Empire with the Trans-Siberian railway or consolidating control of Africa with a Cape-to-Cairo line—were deranged dreamers, not transport economists. Ships were the efficient option for Vladivostok or Cape Town, as within Europe.Footnote 17 The future belonged substantially to sea-routes and already their advantage over land transport was clear.
TRAINS AND HORSES
The major logistical bottleneck of 1900 was transport by road. At this time, of course, this was principally by horse-drawn wagon or what in Asia was called the jinrikisha (“man-power-vehicle”), but, for most countries, such freights are a statistical desert. Road was unimportant in overall tonne-km terms because, given its cost, it was, before the motorized truck and improved intercity roads, sensibly avoided for long-haul freight.Footnote 18 Yet, for the same reason, when there was no alternative and for short-haul trips and final delivery, it added massively to logistical costs. We might reasonably suppose, following the contemporary European stereotype encouraged by American cowboy showmen, that America was much more horse-dependent than western Europe and (despite probable undercounting) the census data on teamsters and horses confirm this. In 1901, there were perhaps 3.3 million horses in Britain; the number in U.S. cities alone equaled that and in the nation as a whole exceeded 24 million.Footnote 19 The American “love affair with the horse” is also shown by the market for carriages, wagons, carts, and similar mobiles.Footnote 20 In 1904 more than 1.7 million were made in the United States, though these were skewed toward buggies (designed for cheap personal transport and only incidentally carrying goods).Footnote 21 In Britain, there were 702,000 horse-drawn freight vehicles in service in 1901 and about the same number of passenger carriages, so Britain's accumulated stock was less than the annual production of these road vehicles in America.Footnote 22 The United States evidently entered the twentieth century as an exceptionally road-dependent society.Footnote 23
Of course, some of the short-haul freight expensively carried by the American teamster and his horses was more cheaply transported on Europe's denser steam railway network.Footnote 24 In 1900 the U.S. rail system, at 311,287 km, was understandably a third longer than Europe's west of Russia, but it served only 76 million people (compared with Europe-ex-Russia's 285 million, in an area only half the size), so the services provided in America were necessarily less close to the median producer or consumer and less frequent (most was still single-track).Footnote 25 The mid-Atlantic region was the most densely networked and included four of America's seven largest cities and major operations of its largest railroads and industrial corporations. This region resembled urbanized, industrialized northwest Europe: it had a land area and track length much the same as the United Kingdom's. In such regions, on both sides of the Atlantic, most lines were double-tracked (permitting around five times the traffic flow), though British railway managers scheduled higher-intensity traffic on their busier network: twice as many locomotives served a U.K. population one-and-a-half times larger than the mid-Atlantic region's.Footnote 26 London, alone, had, in the early twentieth century, 500 passenger rail stations (where parcels could be consigned or received: the railways competed with the state Post Office and private road haulers for this business) and 74 goods depots (for heavier traffic such as coal, timber, and beer), with 770 freight trains a day running among them.Footnote 27 Rail companies in Britain were among the largest importers and owners of horses, but only for the short collection and delivery runs necessary in such densely rail-served cities. In Germany, too, the railways were more involved in the distribution of parcels and finished manufactures (and less in raw materials) than in the United States.Footnote 28 With this well-organized and competitive delivery network (doing work differently divided among express companies, manufacturers' wagon fleets, and self-drive farmers and storekeepers in the United States), European factories and warehouses could outsource distribution to tens of thousands of retailers more cheaply than their American counterparts.Footnote 29
Once again, Europe probably had a logistical advantage. For example, many Americans had less choice than Europeans: only one of hundreds of Belgian rural communes was further from a railhead than the 17km average for American cotton and wheat farmers.Footnote 30 In France, transport by horse on major roads cost 4.8 cents per tonne-km in the early twentieth century (against just over 1 cent per tonne-km on French railways), and short-hauls on central London roads cost 14.8 cents per tonne-km.Footnote 31 V. N. L. Van Vleck argues that the horse/rail fuel cost ratio—oats to coal—was more favorable in the United States, but the Department of Agriculture reported a rural rate by horse-drawn wagon to railheads in 1905 of 12.5 cents per tonne-km for wheat and 18.8 cents for cotton, against an average rail freight rate of 0.5 cents per tonne-km.Footnote 32
MARKETS WITH AND WITHOUT BORDERS
At critical points on the logistics spectrum, then, the United States was different: using trains where Europeans used ships, horses where Europeans used trains. Europeans thus had a scale economy advantage in transport: the horse-drawn wagon carried up to 4 tonnes, the typical 1900 railcar 8–36 tonnes, and the ship upwards of a hundred tonnes to many thousands.Footnote 33 Although we do not have satisfactory price and quantity data for all modes, it is clear that—allowing for greater European use of ships and greater American use of horses—their costs per tonne-km were closer together than unadjusted rail rate comparisons suggest and it is conceivable that average all-mode freight rates were similar for both continents.Footnote 34
Whatever their relative freight rates, per tonne-kilometer, American businesses had to contend with the distances of a relatively empty continent, whereas European markets benefited from the mutual proximity of dense settlement.Footnote 35 The average U.K. rail haul in 1910 was only 64 km, and in France 190 km, against 402 km in the United States, and this tyranny of distance is also reflected in the U.S. large requirement of domestic tonne-km in Table 1.Footnote 36 What was extraordinary about turn-of-the-century northwest Europe was the existence of nine large conurbations of more than a half-million affluent consumers in a compact area (not to speak of 15 more cities of that size in the rest of Europe, against only seven in the whole United States). The average distance between all nine north-west European 500,000+ population city pairs—London, Birmingham, Glasgow, the Lancashire and Yorkshire conurbations, Amsterdam, Paris, the Ruhr conurbation, and Hamburg—was around 500 km and none of them were 1,000 km apart. The average distance between all seven American cities with that population (New York, Chicago, Boston, Philadelphia, Pittsburgh, St Louis, and Baltimore) was 762 km and Boston to St Louis was 1,670 km; the American cities also had smaller populations than the European ones. The United States was distinctively a land of small towns (and correspondingly fragmented markets).Footnote 37 Of the world's busiest transport nodes, seven—London, Liverpool, Cardiff, Newcastle, Antwerp, Rotterdam, and Hamburg—were in northwest Europe, against only two—New York and Chicago—in the United States.Footnote 38 Europe's internal trade was—with larger urban markets, shorter distances, and a cheap transport mix—clearly less logistically constrained than America's.
We know little of other logistics costs, though modern studies suggest that the combined costs of order processing, communications, “shrinkage” (losses in transit by theft or otherwise), warehousing, and inventory interest can exceed those of transport alone. One problem America avoided—the time to clear Europe's border inspections—was a deadweight loss. That apart, the factors that gave Europe its advantage in transport—short distances to market, urbanization, bias to sea freight—were more likely to reduce these costs than increase them.Footnote 39 International comparisons of interest rates also suggest that European inventory holding costs, particularly in France, Belgium, the Netherlands, and the United Kingdom, were lower than those in the United States.Footnote 40 Again, then, the costs of getting goods from the manufacturer to the retail distributor or user were probably lower in Europe.
Other factors—well rehearsed in the literature—limited the First European Integration, including its patchwork quilt of customs barriers, notoriously exacerbated by the German Zollverein's 1879 tariff and the French Méline tariff of 1892. These certainly created real trade barriers and supported inefficient national industries, but they should not be exaggerated. In 1900 British import duties amounted to only 4.6 percent of import values, German to only 8.1 percent and French to only 8.8 percent: the prohibitive levels imposed in the United States (27.6 percent) and Russia (32.6 percent) were generally avoided in western Europe before the 1930s.Footnote 41 The contemporary protectionist drift was thus much more extreme in the United States, and all European countries exceeded the low U.S. trade/GDP ratio that resulted from its abnormally high tariffs. British import duties did not seriously inhibit trade: they were “revenue” tariffs, levied only on goods not produced in Britain or paralleled by excise duties on domestic products.Footnote 42 Low tariff policies, with similarly mild protectionist effect, were also followed by most small west European countries, notably Belgium, the Netherlands, Denmark, Norway, and Switzerland. With the United Kingdom, they collectively amounted to a “common market” a third bigger than the Germany-Luxemburg Zollgebiet and two-thirds the size of the United States, with the advantage over both of equally low import barriers against neighbors.Footnote 43 Even in higher tariff countries, many goods were on the free list (half the imports of France, Germany, and Italy were duty-free), and the major European countries all had extensive bilateral most-favored nation treaties.Footnote 44 Britain did not retaliate against America's exceptional tariffs (pity was the reaction of free trade ideologues, when friends overseas unwisely handicapped their economies), but some continental countries (with a U.S.-style mercantilist mindset) responded by imposing higher duties on American than European imports; British exporters were often the collateral beneficiaries.Footnote 45 Despite a range of tariffs on machines and parts that led to complex sourcing decisions, the European market sometimes came as close as the United States to being a single one, by Marshall's touchstone of the “law of one price.” Singer sewing machines, for example, were available throughout Europe for $30 each.Footnote 46 America's Founding Fathers could outlaw internal tariffs and nontariff barriers, thus creating an abiding competitive advantage over Europe, but they could not legislate against the laws of physics. Domestic transport costs for American mines and factories were often a higher proportion of cost and a more significant barrier to internal trade than the low European tariffs.Footnote 47
International trade was relatively unimportant for Russia (imports plus exports of $10 per head in 1913) and the United States ($43), but a high proportion of incomes for Belgium ($207), Switzerland ($162), the United Kingdom ($134), and Denmark ($126), and not trivial for Germany ($73) and France ($70).Footnote 48 The British are sometimes accused of having focused on trade with Anglophones (the United States and the Empire), neglecting their European neighbors. The accusation is not without foundation, for language, culture, and kinship did count in defining markets. U.S.-U.K. trade exceeded that of any other country pair, and an English tourist could reasonably expect to find his Lea & Perrins Worcestershire sauce in a Mississippi steamboat restaurant. With the inauguration of the “Imperial Penny Post” in 1898, it was (absurdly) cheaper to send a letter from London to Vancouver (7,606 km) than to Paris (341 km) and, ten years later, when the United States instinctively joined the system (diplomatically re-branded the “Ocean Post”), the whole English-speaking world was united by one postal rate.
Yet such culturally driven (and economically difficult to justify) British affinities with settler societies on other continents did not prevent European engagement. A nation that added to its geographical advantage of island status the created advantage of unilateral free trade policies naturally won a quite disproportionate share of world manufacturing exports: its businessmen, effectively, answered the inappropriate question “Anglophone or European?” with the sensible “both.” Within the European economic space, the best customer for exports from Germany, France, Scandinavia, Iberia, and Greece in 1900 was the free-trading United Kingdom. Yet the top export customer of the United Kingdom itself—and of Switzerland, Italy, the Netherlands, Belgium, Russia, and Austria-Hungary—was mildly protectionist Germany, which consistently imported more manufactures than the United Kingdom.Footnote 49 In the decades before the First World War, “Fortress America's” tariffs curtailed its import growth, but Germany's rapid industrialization proceeded, more conventionally, on the basis of increasing the ratio of imports to national income. Europe accounted for more than three-quarters of “world” trade and most of that was intra-European.Footnote 50
Investment sometimes led or followed trade (and, then as now, some international exchange was intracompany). It is true that the United States exerted a powerful attraction for international investors—by 1914 they had $7.1 billion invested there—but nearly twice as much ($12.7 billion) was invested by Europeans across their own borders, much of it private venture funding to develop the poor south and east (notably Russia).Footnote 51 Businesses as varied as BAT, J & P Coats, Thomas Cook, Crédit Lyonnais, Deutsche Bank, De Wendel, Empain, Lothringer Hüttenverein, Mannesmann, Nestlé & Anglo-Swiss, Nobel Dynamite, Ralli Brothers, Rio Tinto, Rothschild, St Gobain, Schneider, Royal Dutch Shell, Siemens, Thyssen, van den Bergh, Vickers, Vieille Montagne, and Wagons-Lits & Grands Express Européens were the dynamos of much intra-European trade, travel, and investment. Though all were headquartered in the rich north and west, such firms often had directors from several countries and operated plants and services in neighboring countries and more widely.Footnote 52
Modern studies suggest that factors beyond tariffs and transport costs—including currency unions, information flows, and cultural links—also encourage trade. No significant political union drove the First European Integration.Footnote 53 Yet consumer and business interests could still triumph over national particularities: for example, international agreements guaranteed unhindered passage on major waterways such as the Sound, Bosphorus, Suez, Rhine, and Danube. The Italian and German governments had joined with the Swiss in financing their key 1882 St. Gotthard rail tunnel under the Alps. Cross-border rail traffic was smoothed by the International Rail Traffic Association in Berne (also home to the International Telegraph Union and Universal Postal Union).Footnote 54 German was the official language of several countries and widely spoken throughout northern and eastern Europe; French had a similar franchise, extending also to Rumania, Russia, and French North Africa; and Russian itself dominated the multi-ethnic Tsarist empire. The numbers of competent speakers of each of these three languages averaged a higher figure than the English-speaking population of North America, and brands could be defined by language not frontiers: Austrian cigarettes, for example, were popular in south Germany. Given the dominance of international settlement by the sterling bill on London, the ubiquity of U.K. ships in European ports and open access to trade and cabotage in Britain and its Empire, many continental merchants and mariners were also fluent in English.Footnote 55 The educated elites were often trilingual. Queen Victoria could converse in either language with her grandson, Kaiser Wilhelm, or at her favorite vacation spot, the Promenade des Anglais in Nice. Passenger fares within Europe were generally lower than in the United States, and even the more difficult, multimode journeys such as London to Berlin (via the Vlissingen ferry) could be completed slightly faster (under 22 hours one-way) and at the same price ($20 first class) as the longer New York-Chicago run. Passports were required for neither trip.Footnote 56
Telegrams were then the favored medium for time-critical business communication, and it was as cheap to cable London from Berlin as New York from Chicago.Footnote 57 In the smaller countries—Scandinavia, Belgium, the Netherlands, and Switzerland—nearly half the telegraph traffic was international (and overwhelmingly intra-European).Footnote 58 A businessman from Paris or Berlin might find a branch of his home bank in London, whereas, within the dollar area, one from Chicago, St. Louis, or Havana would search in vain in New York (though the default option—bank correspondent relationships—worked well on both continents). The Latin currency union meant that currencies including the Swiss, Belgian, and French francs and Italian lira were identical; there was also a Scandinavian currency union. All currencies, including the pound sterling (in which half world trade was transacted), had a fixed (gold standard) relationship, eliminating exchange rate uncertainty from cross-border deals. A German visitor did not consult a conversion table to work out the value of an English gold sovereign (20 shillings): she could see and feel it was the same weight and value as her Doppelkrone (20 marks). The First European Integration was, on some dimensions, more palpable than the postwar European Union.
THE UPSHOT FOR TRADE
If European markets were integrated before 1914, one would expect to find nations developing specializations, whether because of knowledge spillovers, imperfect competition, the exploitation of internal or external economies of scale, or differing resource endowments.Footnote 59 The latter were evident in mining, which had to be located where the deposits were, though some industrial processing often followed. In 1900 Russia produced 94 percent of Europe's crude oil, 89 percent of its gold, and 74 percent of its manganese, Italy mined 98 percent of its sulfur, Spain 68 percent of its copper ore and 58 percent of its mercury, Britain 55 percent of its hard coal, and Germany 42 percent of its zinc.Footnote 60 These high market shares largely resulted from geological fortune, though national shares could be boosted by developing relevant technical expertise or curtailed by resource depletion. They are no more surprising than that much copper came from Montana or coal from Pennsylvania. However, natural resources were not permitted to have a similar effect in agriculture, where—except in Britain, Belgium, the Netherlands, and Denmark—autarkic policies generally delayed trade-driven agricultural restructuring and forestalled efficiency gains on the scale America experienced. Massachusetts wheat farms were reverting to forest or converting to dairy; uneconomic farms in France and Germany survived.
In manufacturing and services, natural resources and protection played a smaller part. Retail banks and insurance companies were, in order to serve their customers, necessarily spread throughout Europe, but the Bank of England, with a larger international role, was bigger than the Reichsbank, Banque de France, and Banque Nationale de Belgique combined.Footnote 61 Other specialist financial and commercial services also centered on the United Kingdom. The assets of overseas banks with offices in London exceeded those of all British domestic banks and most foreign investment emanated from there; more securities were quoted there and more companies were formed there than in the whole of the rest of Europe; London insured most foreign (as well as British) ships and cargoes, though in the re-insurance industry (that is wholesale insurance) Germany took the lead.Footnote 62 National post offices monopolized domestic telegraphs, but the worldwide web of international cables was mainly in private sector hands: 57 percent of the European-owned undersea cable network was run by London-based companies.Footnote 63 It is more difficult to be precise about Britain's share in the operations of international trading companies, providing a sophisticated mix of financial, managerial, risk control, exploration, engineering, investment, and logistic services.Footnote 64 However, the main, separately identifiable tradable service—shipping—was clearly measurable, and 60 percent of Europe's capacity in 1900 was in British-flagged ships. Shipping movement worldwide was directed via cable communication with the ports (and, increasingly, directly to ships by Marconi radio) by the polyglot owners and shipbrokers at the (modestly named, but actually global) Baltic Exchange in London.Footnote 65 The United Kingdom was, at this time, the first nation to derive most of its income from the service sector, its specialization in service exports boosted by European market integration.Footnote 66
In basic industries, where German catch-up was clearer, access to cheap coal supplies remained critical for many processes and products. Coal-producing regions such as the Ruhr and Scotland had advantages in iron and steel manufacture, relative to Italy and France (which imported coal from Britain). The United Kingdom and Germany in 1900 produced three-fifths of Europe's iron and steel, and both were large exporters, though Britain was cutting back (relatively speaking) in such basic intermediates.Footnote 67 Factories making soap, cement, sugar, cigarettes, woolen textiles, stoves, bicycles, agricultural machinery, and locomotives were quite widely spread around industrialized Europe, but sometimes one country had a pronounced lead. Despite textiles being a favored protectionist objective, U.K. producers still operated 58 percent of Europe's cotton spindles, and Italy produced 84 percent of Europe's silk in 1900.Footnote 68 In more challenging industries, divisions of labor were also evident: the United Kingdom produced 90 percent of Europe's sewing machines, more than two-thirds of its ships, and over half its soda ash; Germany made half its pianos and nearly all its dyestuffs; Switzerland over three-quarters of its watches and half its aluminum; and France three-quarters of its automobiles.Footnote 69
By these indicators, European economies appear more integrated in 1900 than a hundred years later. Following the Second European Integration, at the two-digit level, only Italian leather goods manufacturers (with 52 percent of EU25 output) now have a similar degree of dominance.Footnote 70 It is possible to interpret this as a sign that extensive specialization through trade was better developed in well-integrated European markets before 1914 than within the modern European Union, but that deduction is unsafe. Other factors, such as the spread of industrialization and catch-up in living standards, especially in Europe's south and east, explain some of the contrast. There was parallel regional de-specialization within the United States after 1930, caused by southern economic development, less resource-intensive manufacturing production, new (and more mobile) energy resources, and more reliance on created (and mobile) human capital. Such factors probably also account for much of the reduced modern manufacturing specialization among European countries relative to the level attained in the different regime of trade, technology, and income distribution that obtained before 1914.Footnote 71 What is clear is that the factors identified here did make Europe—and particularly its highly developed northwest—a large, integrated trading and investment area. The European economic space is not—before the disaster of 1914—sensibly treated as an uncoordinated, bickering Tower of Babel, fatally divided by protectionism and national identities.
THE WORLD'S GIANT FACTORIES
Contemporary national statistical bureaus typically defined the largest plants as those employing 1,000+.Footnote 72 The modal giant plant was still the classic Victorian factory, a multistory “cube” optimizing power distribution by belt and requiring only a modest footprint for 1,000 workers, though many acres were required by the hundred or more plants then employing more than 5,000.Footnote 73 Such factories clearly required not only a large market but also a shift toward professional management. An owner-entrepreneur's family might run a plant with 200 employees, or, with the help of a few senior clerks, even stretch that to 1,000, but supervising more usually required the recruitment of nonfamily managers, with greater professional specialization of functions such as payroll, book-keeping, production, and sales. These plants were where managerial and bureaucratic techniques, hitherto mainly found in financial institutions, railways, and state organizations, were now being more widely developed. Managerial hierarchies were relatively small in textiles (with its standardized machine production by skilled or semi-skilled workers and commonly single-plant operation), but more managers and other salaried workers were required where first-generation industrial labor needed more supervision, in complex steel, chemical, and engineering plants and in multiplant firms.Footnote 74
We can infer that there were perhaps 3,000 giant manufacturing plants—employing around six million people—globally at this time.Footnote 75 From earlier censuses, it is also clear that a majority of these were the creation of the last quarter-century. In Germany, there had been only 40 plants employing 1,000+ in the private sector in 1882, but this rose to 144 in 1895 and 315 by 1907, with the proportion of all manufacturing employees in these giant plants rising from 2 percent to 8 percent over the same period. In French manufacturing the number of giant plants rose from 108 in 1896 to 162 in 1906, in Hungary from 11 in 1890 to 29 in 1900, in Belgium from 8 in 1880 to 27 in 1910, in the United States from 443 in 1899 to 648 by 1914, and in Russia from 243 in 1901 to 372 by 1914, an unweighted mean compound annual growth in numbers of 5 percent. This transformation had two strands: wider investment in industries such as textiles, iron, and steel, where large mills had appeared decades earlier, together with newer large-scale plants, driven by recent logistics improvements and scaleable production innovations.Footnote 76
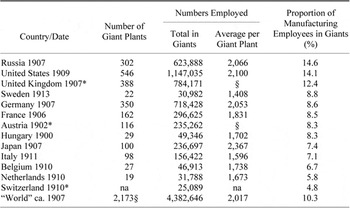
GIANT MANUFACTURING PLANTS (1000+ EMPLOYEES) IN THE EARLY TWENTIETH CENTURY

* estimated
§ “World” is the 13 countries, estimated on the basis that the average giant plant size in countries without data is a weighted average (2,017 employees) of those for which data exist (1,655 plants). This procedure is applied to estimate the number of plants from the totals for employees in such plants in the United Kingdom, Austria, and in the aggregate, but not for Switzerland separately (where the numbers are too small for reliable estimation).
Sources:
Bureau, Manufactures, p. 185; Lebergott, Manpower, p. 514; Kaiserlichen Statistischen Amte, “Gewerbliche Betriebstatistik,” pp. 4–13, 58–153; Centraal Bureau, Jaarcijfers, pp. 206–07; Statistique Générale, Annuaire 1909, p. 188; Woytinsky, Welt, 4, pp. 43–45; Ministère, Recensement; Rashin, Formirovanie, pp. 42, 96; Statistiska Centralbyrån, Statistisk Arsbok, p. 106; Statistischen Bureau, Statistisches Jahrbuch, p. 114; Ungarischen Statistischen Zentralamt, Volkzählung, pp. 203*–05*, 259–62; Ministère des Finances, Annuaire, pp. 74–75 (with further tobacco factory breakdown from Anon., Tabako Senbaishi, pp. 622–24); Anon., Kojo Tsuran; Ufficio, Censimento, pp. 158–59; and see notes 78–80, for additional adjustments.
Table 2 covers more countries than earlier studies and separates manufacturing from three sectors—mining, construction, and utilities—with which it was sometimes grouped as “industry.” This removes “noise,” which has compromised previous international comparisons: national censuses did not consistently include these three discarded sectors, and mine sizes, especially, were both higher and more variable, for largely geological reasons.Footnote 77 For censuses that excluded small producers, the un-enumerated workers need to be added back to the denominator of the last column, for comparison with countries that conducted a full census. Where census tables did not include government plants, consolidated totals are required.Footnote 78 Finally, some censuses enumerated only blue-collar workers, so an adjustment is required for white-collar employees (typically, at this time, adding 5–10 percent).Footnote 79 I have attempted to standardize the data in all these ways. The figures with an asterisk are estimated from size classes other than 1,000+.Footnote 80
It is safe to conclude from Table 2 that giant plants were less prevalent in Switzerland than in Russia, but a narrow range (10±5 percent of all manufacturing employees in giants) suggests some uniformity of global experience and small differences should not be over-interpreted.Footnote 81 One reason the gap between industrial leaders and followers was small or nonexistent was that the latter were growing fast, so a higher proportion of their factories were of recent vintage (which usually meant larger).Footnote 82 Tsarist Russia, though a follower, heads this table because it had recently invested massively in iron and steel, railway equipment, and textile plants to supply its increasingly protected markets. For example, the long-established Krähnholm cotton mill complex, powered by the waterfalls where the Narva entered the Baltic, had been completed around 1900 by the Knoop family of Bremen and Manchester, exclusive agents in Russia for the leading machinery makers, Platt Brothers.Footnote 83 In 1907 their 30 British expatriate staff supervised 8,353 employees, operating 460,358 spindles and 3,040 looms in four linked factories. However, Krähnholm had then already yielded its position as the world's largest textile complex to Amoskeag Manufacturing of Manchester NH. In 1905, this company had acquired two neighboring cotton and wool producers, thus consolidating on one combined site (powered from the Merrimack falls) even more looms and spindles. Amoskeag's workforce was to peak at more than 16,000 in 1914.Footnote 84 Neither the Russian colossus nor its American nemesis was typical: the average plant in most cotton manufacturing regions (including Bohemia, Bombay, Kansai, Lancashire, Massachusetts, and Saxony) was only a fraction of their size, with mills employing 500–1,500 benefiting from regional external economies and knowledge spillovers.Footnote 85 Amoskeag was not a representative mill but an isolated industrial freak, its quite exceptional scale driven by the distinctive economics of grouping mills using locally abundant waterpower. If the Amoskeag employees had been evenly distributed among the 30 separate mills actually agglomerated there, that alone would have lowered America's rating in the last column by one-fifth of a percentage point.Footnote 86 A wide-ranging search for general cultural reasons why Britain—ranked third—did not have as high a proportion of employees in giant plants as America may be premature, if a quarter of the gap is explained by the fact that the Mersey was not the Merrimack, yet British engineers had responded similarly on the Narva.Footnote 87
At the aggregate level, the notion that Europeans suffered disadvantages in plant scale relative to the United States is difficult to square with their having over half the world's giant plants—more than one might expect from Europe's relative market size—while the United States had less than a fifth.Footnote 88 Small European countries bring up the rear in the table, but small American states, such as California and Florida, were even more bereft of giant plants.Footnote 89 Belgium had a domestic market only 7 percent of the United States' size and ranks near the bottom of Table 2, but is more appropriately considered mildly inconvenienced, rather than suffocated, by this. It could not vie with the big powers in heavy armaments factories or shipyards, and the Solvays—Belgium's richest business family—had located most of their alkali plants (wholly owned or co-owned with foreign licensees) abroad: in Britain, France, Germany, Russia, and the United States. Yet it had multiple giant plants in steel, glass, railway equipment, and textiles and single giants making electrical equipment, small arms, zinc, and automobiles. With Antwerp challenging Hamburg as the continental mainland's busiest seaport, Brussels financiers driving development of Europe's electric tramways, Belgian glass production equaling that of Germany and France combined, the British building ships with Belgian steel, and the French designing fashionable kitchens using Belgian zinc, domestic market size was for many of its larger businesses irrelevant.
Some traditional national characterizations evaporate in this table. Krupp's Essen works—with 33,917 employees by 1909—was probably the largest, private manufacturing site by employment size anywhere.Footnote 90Table 2 shows the danger of extrapolating from that core of the Prussian military-industrial complex, for beyond Essen lay a diverse economy of smaller plants producing beer, cigars, children's toys, pianos, porcelain, sausages, and silverware.Footnote 91 The proportion of Germany's manufacturing workforce in giant plants was, in fact, a little below average for these countries. Nor is France's much-explained aversion to large plants evident. It is true that Germany employed more than twice as many in large factories as did France, but the balance of French choices, shown in the last column, is insignificantly different from the revealed plant size preferences of German businessmen. The reason that France had fewer giant factories was simply that a smaller proportion of the smaller French workforce was employed in manufacturing.Footnote 92
OLD AND NEW INDUSTRIES
Overwhelmingly, the giant U.S. plants in Table 2 were in the developed and densely settled northeast that most resembled northwest Europe: 85 percent were in the mid-Atlantic (178), New England (159), and east north central (115) regions. Half were in only six census categories: cotton goods (77), steelworks and rolling mills (57), construction and repair shops owned by steam railroads (44), foundry and machine shops (41), woolen textiles (24), and slaughtering and meatpacking (23).Footnote 93 European census categories differ somewhat, but the industrial distribution of giant plants appears broadly similar, meatpacking apart (Europeans killed their locally reared meat in small slaughterhouses or, for the chilled product, had their Australasian and River Plate cousins do the mass destruction job for them). In Germany, the industries with the most large plants are machinery and equipment (77 plants), rail and other vehicle building (39), textile weaving (34), iron and steel (31), and textile spinning (28).Footnote 94 At least in relatively mature industries with some evolutionary track record, the determinants of large scale—whether technological, managerial, or market access—appear to be operating worldwide in the same range of industries.
Few businesses were more dependent on global logistics than British cotton mills (they imported all their raw cotton and exported more than three-quarters of their output), but other cotton industries mainly served domestic markets. It was not primarily low logistics costs or especially extensive markets that drove large plants there. Clothing was a basic need and none of these countries was too small to have multiple textile factories, if labor costs were sufficiently low or tariffs sufficiently high to limit imports. The constraint on building more such plants for many follower countries was not domestic market size but organizational and technical capability or financial resources. Indeed, countries such as Japan, Italy, and India (like Russia, and—indeed—the American South) still required some assistance from nonlocal managers, technicians, machine-makers, and investors and sometimes built larger plants to economize on the use of such scarce resources.Footnote 95
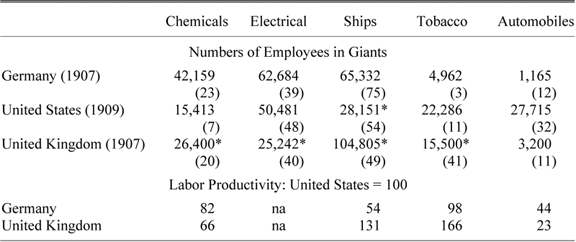
Most of these factories used technologies substantially developed before 1850, or, in the case of steel, in 1850–1880.Footnote 96 “Modern” industries of the second industrial revolution, though growing rapidly, still had few giant plants: sometimes none in the poorer economies and less than several dozen worldwide. However, as can be seen from their (bracketed) workforce shares in Table 3, giant units were more representative in these industries: plant concentration was particularly marked in shipbuilding and electrical manufacturing. Long-haul logistics and marketing at a distance naturally assumed wider importance for these industries, where local, regional, or the smaller national markets were too small, notably for their more specialist products; and protectionist sentiment was also initially weaker than in textiles. National variations were more evident in these industries: there were 20 giant German chemical plants, 19 in shipbuilding, and 15 in electrical, but in the United States (an economy twice Germany's size) only seven in chemicals and 11 each in shipbuilding and electrical. Contrariwise, in the, then most widespread, branded packaged product, America led with 13 giant tobacco factories, against Germany's three. In the most recent innovation—automobiles—America also led, with 15 giant plants, against Germany's one.Footnote 97Table 3 contains few surprises: some conventional stories—early twentieth-century British “backwardness” in electrical equipment, German “backwardness” in automobiles and tobacco, and American “backwardness” in ships—are confirmed.Footnote 98
EMPLOYMENT IN GIANT PLANTS (1,000+ EMPLOYEES) IN “MODERN” MANUFACTURES

* estimated (see notes 78, 98).
Note:
Numbers in parentheses are the percentage of employees in giants in each industry's employment.
Source:
Employment: as Table 2 (with U.S. wage-earners adjusted upwards for salaried employees by industry-specific ratios). Labor productivity: Broadberry, Productivity Race, pp. 164, 178 (chemicals—mean of oilseed, soap, and fertilizers for U.K./U.S. differential—and automobiles, 1907–1909); Dormois and Bardini, “La productivité,” p. 97 (U.K./German chemicals differential 1912–1913); Lorenz, “Evolutionary Explanation,” p. 915 (shipbuilding, 1900); and Hannah, “Whig Fable,” p. 59 (tobacco, 1912).
There is some arbitrariness in this categorization of “new” industries. The most expensive and sophisticated contemporary capital goods were warships and liners costing $5 million each: their turbine rooms alone were the size of a central power station and transatlantic liners were so large they could only dock in New York and half a dozen European ports.Footnote 99 Yet, small coasters and lighters cost no more than the $100,000 for a freight train: both were, in essence, low-tech metal tubs with steam engines attached. Finer classification would, however, leave rankings intact: considering only shipyards building state-of-the-art liners, the United States disappears from the table (Cramp's Philadelphia yard dropped out of contention when these ships became faster and larger after 1895): the top end of this market was confined to one French, three U.K., and three German yards.Footnote 100
Britain's commitment to large-scale in chemicals appears stronger than America's in Table 3, puzzlingly as the latter's chemical workforce at the dates shown (228,362) was clearly larger than either Germany's (184,482) or Britain's (127,700), but this industry encompassed a wide variety of products with different optimal plant sizes.Footnote 101 Germany focused on dyestuffs (where in 1907 BASF employed 8,877, Bayer 7,811, and Hoechst 6,000, in each case overwhelmingly at one central plant), Britain on alkalis and explosives (where the two large firms with one dominant site employed 8,000 and 4,000), and the United States on fertilizers (in which the 1909 census records the largest plant employing only 419 wage-earners), patent medicines, and drugs (in which the largest recorded U.S. chemical plant employed 1,789, but the next four only around 600 each).Footnote 102 Mixing water, alcohol, opium, and advertising (the main ingredients of contemporary patent medicines), though very profitable, simply required smaller, less capital-intensive plants than synthesizing dyestuffs or producing Solvay soda and dynamite. America also had many, modestly sized, chemical factories in laundry blue, soap, blacking, polishes, grease, tallow, and turpentine, so less than 7 percent of its chemical employment was in giant plants (making this one of America's least concentrated industries at the plant level), compared with 20 percent in Britain and 23 percent in Germany (among their modestly concentrated sectors).
National variations in investment in large plants in modern industries are prone to excite narrative historians of Whig disposition, but do not necessarily imply grave social or entrepreneurial failure. At the technological frontier, it may make perfectly good sense for advanced nations to specialize in pioneering breakthroughs and they may do so, willy-nilly, according to differentially lucky opening hands. At one level, it is not difficult to explain why Americans operated relatively few high-tech ships, and low British investment in electric tramways and lighting has been identically excused.Footnote 103 Trading internationally to obtain the market-constrained numbers of liners or streetcar drives that were required was not an inherently stupid activity. These industries were at an earlier evolutionary stage than the (more evenly spread) large plants in textiles, steel, and simpler engineering; emulation was therefore more difficult and needed more time: as is suggested by the, quite pervasive, later catch-up by initial laggards.Footnote 104 Later convergence, it is true, could be stymied if internal or external economies of scale or learning effects gave first movers an advantage that locked followers out (as is suggested by the United States and the United Kingdom later struggling to claw back their domestic dyestuffs markets, despite wartime expropriation of German patents and massively protective tariffs). However, widespread migration; capital and technology flows; interchanges within and among multinationals; global scientific, engineering, and business communities; reverse engineering; niche entry strategies; international licensing; short patent life; and gullible governments with handy subsidies made barriers to later entry somewhat less than universally binding.
Plant employment size is the only yardstick for which internationally comparable data are available for this period, but the relative output of plants is not captured by Table 2, especially in countries such as Japan and Russia, where giant powered plants were modern outposts in a dual economy, with many co-existing handworkers and unpowered manufacturing workshops.Footnote 105 American factories plausibly achieved higher productivity even than those in western Europe, because they used more power per worker.Footnote 106 Yet this applies to industry overall: productivity in giant factories was probably more evenly balanced.Footnote 107 Indeed, America's alleged productivity lead over Britain in cotton textiles, which accounted for 14 percent of U.S. giant plants, has been shown to be an artifact of quality mismeasurement.Footnote 108
Nor do productivity comparisons suggest a consistent American lead in newer industries. The proportion of all their employees in giant plants that were in the “modern” industries of Table 3 was actually higher in western Europe (Germany 25 percent, Britain 22 percent, France 20 percent) than in the United States (only 12 percent).Footnote 109 It is true that estimating the output of these “modern” giant plants from crude and incompatibly defined relative productivity measures (see the lower section of Table 3) would reduce Germany's share, but the same procedure would actually enhance the British lead over America in “modern” large-scale plants.Footnote 110
Although we cannot be certain how international comparisons of giant plants by output might differ, it is possible that the key differences in continental European industrial structure and productivity are in the smaller plants that (if we are to judge from Table 2) then accounted for 90 percent of the world's manufacturing employees. As Janice Kinghorn and John Nye have pointed out, the overall mean employee numbers in early-twentieth-century manufacturing plants were much the same in Britain (64) as in the United States (67), but rather smaller in France (26) and Germany (14).Footnote 111 Their results were largely unaffected by the top size range examined here, so clearly imply that plants with fewer than 1,000 employees were distinctly smaller in continental Europe. With lower wages, France and Germany simply had more small workshops and handicraft workers: it is conceivably this, rather than what was happening in their giant plants, that drives not only their middling rank in Table 2 but also their low overall labor productivity.Footnote 112
What is clearer is that, by 1912, giant industrial firms in Europe were less numerous and smaller than those in the United States (except in Britain, where they were still slightly larger).Footnote 113 Plants (the exclusive focus here) and firms are not the same, though both were growing. If the United States had any measurable scale advantage, it was in firm, rather than plant, size. The most obvious explanation is that it had more multiplant firms (a natural enough choice in an economy with expensive transport), but the contrasting results could derive from capital (rather than labor) rankings, sample truncation, the inclusion/exclusion of mining/state firms/overseas plants, or vertical integration induced by poorer U.S. logistics. What the present analysis suggests is that the focus of future research should only be on larger American markets or plants in the limited number of special cases where appropriate economic definitions of plants and markets suggest that actually applies. This was clearly the case for Ford, whose exceptionally scaleable product/process innovations were launched in 1909 on a society where demand for road transportation was—already—unusually high. Yet an exceptionally large domestic market was neither a necessary nor a sufficient condition for leadership in contemporary mass production industry. The U.S. domestic tobacco market was five times that of the United Kingdom—mainly because of low taxes—yet British plants achieved larger scale production and higher productivity by more thoroughgoing standardization and mechanization.Footnote 114
CONSEQUENCES
This statistical picture of the business world after the turn of the twentieth century is merely a snapshot—with a generous exposure time covering a decade or so of available data points—of a dynamic situation. Between 1914 and 1945, Europe changed, destroying people, property, institutions, trust, and trade, with a devastating cocktail of military conflicts, cold wars, revolutions, partitions, tariff escalations, corporate nostrifications, expropriations, dictatorships, monetary collapse, mass unemployment, and ethnic cleansing. Despite this tragically violent and destructive dismemberment of the cosmopolitan market space of the First European Integration, the first half of the twentieth century also saw momentous developments in knowledge generation, manufacturing, and logistics, driving a race to higher living standards. That race was decisively won by the United States, which, on its pathway to economic supremacy, developed larger plants and a much larger domestic market than its European competitors. It did so without the advantages over Europe at the outset with which it has been credited. We should not confuse the chicken with the egg, even if we have a well-founded suspicion that the two are critically and serially inter-related. If we are properly to evaluate the contribution to the economic outcomes of what Americans did right, or what Europeans did wrong, we should first recognize accurately the different, but more-or-less level, playing fields on which the New and Old Worlds—or at least their respective northeastern and northwestern segments—started the century. It is an open question whether the American Century was created by good fortune, Yankee ingenuity, European stupidity, or perhaps all three, but it was not pre-ordained by the manifest destiny of early-twentieth-century market scale.