Highlights
-
Current NHSN central line day counting methodology does not reflect the total volume of lines indwelling in patients, underestimating true infection exposure and disproportionately impacting higher-acuity hospitals.
-
Across four hospitals within a health system, indwelling central line days exceeded reported line days by 22,740 days over a single calendar year, with the proportion of reported line days differing significantly across hospitals (P <.001). The academic care center ICU was disproportionately impacted by the reporting guidelines, with 1 in every 3 lines uncounted.
-
When analyzing the impact of a quality improvement initiative, health systems should consider measuring all indwelling central lines to better assess any impacts masked by using reported line data alone.
Introduction
Health systems across the United States are subject to mandatory reporting requirements for healthcare-associated infections (HAIs). Central line–associated bloodstream infections (CLABSIs) are among the most closely monitored HAIs due to their association with patient harm, increased hospital length of stay (LOS), mortality, and healthcare costs. 1,Reference Stevens, Geiger, Concannon, Nelson, Brown and Dumyati2 Beyond patient safety implications, CLABSI rates are incorporated into public reporting and federal value-based purchasing programs, directly influencing hospital quality metrics and reimbursement.
The SENIC (Study on the Efficacy of Nosocomial Infection Control) study demonstrated that surveillance is a proven intervention to reduce infections and was followed by the NNIS (National Nosocomial Infections Surveillance system) which operationalized it to function at a national scale. Reference Haley, Culver and White3,Reference Emori, Culver and Horan4 The standards developed were intentional in utilizing simplified case and reporting definitions to promote standardized benchmarking and minimize reporting burden. The National Healthcare Safety Network (NHSN), administered by the Centers for Disease Control and Prevention, now serves as the national surveillance system for CLABSI reporting and continues to apply these simplified definitions. Reference Horan, Andrus and Dudeck5
Under current NHSN methodology, a central line day is counted when a patient has at least one central line accessed during a calendar day. If multiple central lines are indwelling simultaneously in a single patient on the same day, this is still only counted as one central line day. This counting approach assumes equivalent infection risk regardless of the number of concurrent central lines. However, multiple studies have shown that simultaneous central line use may be associated with increased CLABSI risk. Reference Concannon, van Wijngaarden, Stevens and Dumyati6–Reference Dube, Jacob and Zheng10 Aggregating multiple central lines to be counted as a single central line day potentially underestimates the denominator of exposure and artificially inflates the CLABSI rate. The potential resultant discrepancy would disproportionately affect hospitals caring for higher-acuity or more medically complex patients. This has implications for risk adjustment, inter-hospital benchmarking, and internal quality assessment. The differences in reported CLABSI rates may reflect discrepancies in denominator construction rather than true differences in performance. Reference Dube, Jacob and Zheng11,Reference Couk, Chernetsky Tejedor, Steinberg, Robichaux and Jacob12
We aimed to quantify the difference between reported and actual central line days across four hospitals, varying in patient complexity, within our integrated health system, and to evaluate the implications of this discrepancy on hospital quality improvement (QI) initiatives.
Methods
Setting
Our healthcare system includes ten diverse hospitals across the state of Minnesota. Utilizing Vizient (a national peer-group reporting platform) cohort definitions of performance, three adult hospitals were selected to reflect variation across cohort classifications. 13 Hospital 1 is a Comprehensive Academic Medical Center; Hospital 2 is a Large, Specialized Complex Care Medical Center; and Hospital 3 is a Community Hospital. Hospital 4 is a pediatric Hospital and is the only pediatric hospital within our system. The academic medical center has 63 intensive care unit (ICU) beds representing 3 specialty-specific ICUs (medical, surgical and neurological, and cardiovascular). Hospital 2 has a 23-bed mixed medical-surgical ICU, and Hospital 3 has a 12-bed mixed medical-surgical ICU. The pediatric hospital has a total of 99 neonatal and pediatric ICU beds.
Study population, data source, and design
Retrospective data from January 1, 2024, through December 31, 2024, as obtained from the electronic health records (EHR) for all inpatients at each of the 4 acute care facilities. Data collected included unique patient identifier, department and room, central line type, inclusion or exclusion determination, exclusion rationale, and dates and times for line placement, line accessed, last documentation, and line removal. NHSN defines a central line as a “intravascular catheter that terminates at, in, or close to the heart, or in one of the great vessels AND is used for infusion, withdrawal of blood, or hemodynamic monitoring. Reference Stevens, Geiger, Concannon, Nelson, Brown and Dumyati2 Lines were categorized as either a centrally inserted central catheter (CICC), peripherally inserted central catheter (PICC), port-a-cath, or other (umbilical, apheresis access, femoral, or not documented). Inclusion or exclusion determination designates whether a line was counted using NHSN criteria for a patient on a given day. If a line was not counted, exclusion reasons included: a central line was already counted, department not configured to report on central lines, no recent documentation, and no documented birth weight (NHSN stratifies central line risk in NICU by birth weight). Reference Stevens, Geiger, Concannon, Nelson, Brown and Dumyati2 For this analysis, a counted line is referred to as a “reported line day.” An “Actual line day” refers to all lines, excluded and counted. Of note, Emergency Departments (ED) are not required to report central line data and were therefore excluded from this analysis. Line accessed is the date and time of line insertion; last documented is the last data entry by staff into the EHR, and line removal is the date and time a line is discontinued.
Impact on a quality improvement initiative
To analyze the impact of NHSN line count criteria on a QI initiative, additional data was collected from the ICUs at the academic medical center from January 1, 2024, through July 31st, 2025. Beginning March 1st, 2025, a new standardized rounding checklist was implemented in all adult ICUs at the academic medical center for providers to complete during daily rounds. A physical whiteboard with the checklist was placed outside of each ICU room. The standardized checklist was designed to include a daily discussion of central line presence and necessity. No checklist or central line necessity assessment tool was in place prior to this intervention. Process audits performed during the first three months of implementation found >90% adherence to checklist use. The preintervention data period was from March 1, 2024, through March 1, 2025, and the postintervention data period was from March 2, 2025, until July 31, 2025. The impact of the checklist on both reported and actual central line counts was collected and compared as pre and postintervention.
Statistical analysis methodology
Our study team exported a randomized sample of 1% of patients and manually audited each patient and day for accuracy of indwelling lines, including date and time stamps. Any discrepancies in the data were reviewed by our study team members (ZG, CL, LW). Discrepancies included missing placement or removal dates, and lines excluded secondary due to duplicative charting. For the purposes of this study, if the line placement date and time was not recorded, the first accessed date and time was used as a surrogate. Likewise, the last documented clinical entry date and time was used as surrogate for missing removed date and time entries. Using the first accessed and last documented times as surrogates for these missing data points allowed for more complete data analysis while avoiding over-estimation of line days. Hypothesis testing on continuous variables included ANOVA, Two-sample Poisson, Two-sample T test, Mann-Whitney, and χ2 test. Hypothesis testing on categorical data included a Two-sample proportion, χ2 test for association and a Monte Carlo χ2 goodness-of-fit test with 10,000 simulated multinominal tables. Data preparation and analysis was completed using Python 3.11 within Jupyter Notebook, distributed via Anaconda; and Minitab. 14–17 Extracted data was certified to be within 5% accuracy per NHSN reporting standards. 18 The study was reviewed by the University of Minnesota Institutional Review Board and determined not to meet criteria for human subjects’ research given its quality improvement nature.
Results
Hospital comparison
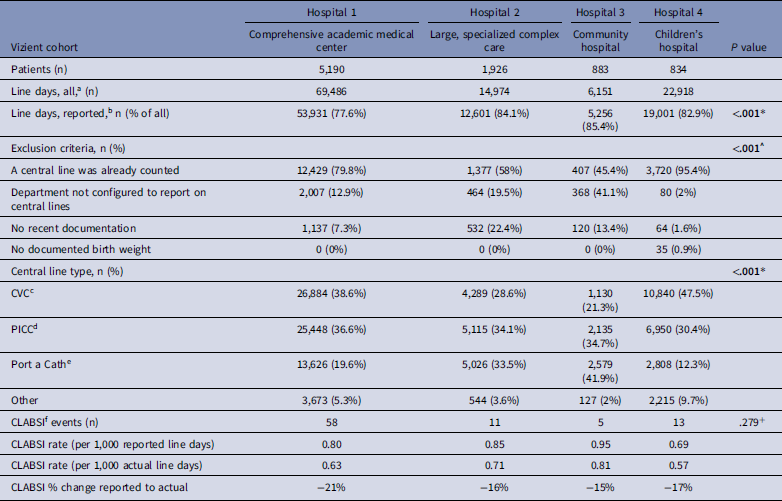
The final data set included 7,645 patients representing a total of 113,529 actual line days and 90,789 reported line days to NHSN. The proportion of actual versus reported line days varied significantly across hospitals (P < .001): Hospital 1 reported 78.9% of actual line days (53,391 of 69,486), Hospital 2 reported 84.1% (12,601 of 14,974), Hospital 3 reported 85.4% (5,256 of 6,151), and Hospital 4 reported 82.9% (19,001 of 22,918) (Table 1). CLABSI events totaled 58, 11, 5, and 13 at Hospitals 1 through 4, respectively. There were no differences in CLABSI event rate per 1,000 days found between hospital sites when using either reported or actual central line days as the event rate denominator (P = .279).
Summative data by hospital

Table 1. Long description
The table compares data across four hospitals: Hospital 1, Hospital 2, Hospital 3, and Hospital 4. It includes columns for patients, line days, reported line days, exclusion criteria, central line types, and CLABSI events. Row 1: Patients (n): Hospital 1, 5,190; Hospital 2, 1,926; Hospital 3, 883; Hospital 4, 834. Row 2: Line days, all, (n): Hospital 1, 69,486; Hospital 2, 14,974; Hospital 3, 6,151; Hospital 4, 22,918. Row 3: Line days, reported, (n (% of all)): Hospital 1, 53,931 (77.6%); Hospital 2, 12,601 (84.1%); Hospital 3, 5,256 (85.4%); Hospital 4, 19,001 (82.9%). Row 4: Exclusion criteria, n (%): Hospital 1, 12,429 (79.8%); Hospital 2, 1,377 (58%); Hospital 3, 407 (45.4%); Hospital 4, 3,720 (95.4%). Row 5: Department not configured to report on central lines: Hospital 1, 2,007 (12.9%); Hospital 2, 464 (19.5%); Hospital 3, 368 (41.1%); Hospital 4, 80 (2%). Row 6: No recent documentation: Hospital 1, 1,137 (7.3%); Hospital 2, 532 (22.4%); Hospital 3, 120 (13.4%); Hospital 4, 64 (1.6%). Row 7: No documented birth weight: Hospital 1, 0 (0%); Hospital 2, 0 (0%); Hospital 3, 0 (0%); Hospital 4, 35 (0.9%). Row 8: Central line type, n (%): CVC: Hospital 1, 26,884 (38.6%); Hospital 2, 4,289 (28.6%); Hospital 3, 1,130 (21.3%); Hospital 4, 10,840 (47.5%). Row 9: PICC: Hospital 1, 25,448 (36.6%); Hospital 2, 5,115 (34.1%); Hospital 3, 2,135 (34.7%); Hospital 4, 6,950 (30.4%). Row 10: Port a Cath: Hospital 1, 13,626 (19.6%); Hospital 2, 5,026 (33.5%); Hospital 3, 2,579 (41.9%); Hospital 4, 2,808 (12.3%). Row 11: Other: Hospital 1, 3,673 (5.3%); Hospital 2, 544 (3.6%); Hospital 3, 127 (2%); Hospital 4, 2,215 (9.7%). Row 12: CLABSI events (n): Hospital 1, 58; Hospital 2, 11; Hospital 3, 5; Hospital 4, 13. Row 13: CLABSI rate (per 1,000 reported line days): Hospital 1, 0.80; Hospital 2, 0.85; Hospital 3, 0.95; Hospital 4, 0.69. Row 14: CLABSI rate (per 1,000 actual line days): Hospital 1, 0.63; Hospital 2, 0.71; Hospital 3, 0.81; Hospital 4, 0.57. Row 15: CLABSI % change reported to actual: Hospital 1, -21%; Hospital 2, -16%; Hospital 3, -15%; Hospital 4, -17%.
Bold values indicate P < .05.
a All = Central lines present including excluded.
b Reported = only central lines counted.
* Chi-sq test for association.
^ Monte Carlo χ2 goodness-of-fit test with 10,000 simulations; tests whether events are equally distributed across hospital × ICU categories.
c CVC = Central Venous Catheter.
d PICC = Peripherally Inserted Central Catheter.
e Port-a-cath = implanted port.
f CLABSI = Central Line-Associated Bloodstream Infection.
+ Poisson Regression.
Central line type distribution differed significantly across hospitals (P < .001). CICCs were the most common line type in Hospital 1 and Hospital 4, while PICC lines were the most common in Hospital 2, and port-a-caths were the most common in Hospital 3.
Exclusion reason distribution varied significantly across hospitals (P < .001). At all four hospitals, the most common exclusion was “central line already counted,” ranging from 45.5% of excluded days at Hospital 3 to 95.4% at Hospital 4. “Department not configured to report” was the second most common exclusionary reason at Hospitals 1, 2, and 3, but the third most common at Hospital 4 (2.0%). “No documented birth weight” was exclusively observed at Hospital 4, accounting for 35-line days (0.9% of exclusions). Full exclusion counts and proportions by site are presented in Table 1.
National CLABSI rates are reported as CLABSI per 1,000-line days. When CLABSI rates were recalculated using actual rather than reported line days, all hospitals showed a reduction. Hospital 1 had the largest reduction (21%), followed by Hospital 4 (17%), Hospital 2 (16%), and Hospital 3 (15%).
Hospital and ICU comparison
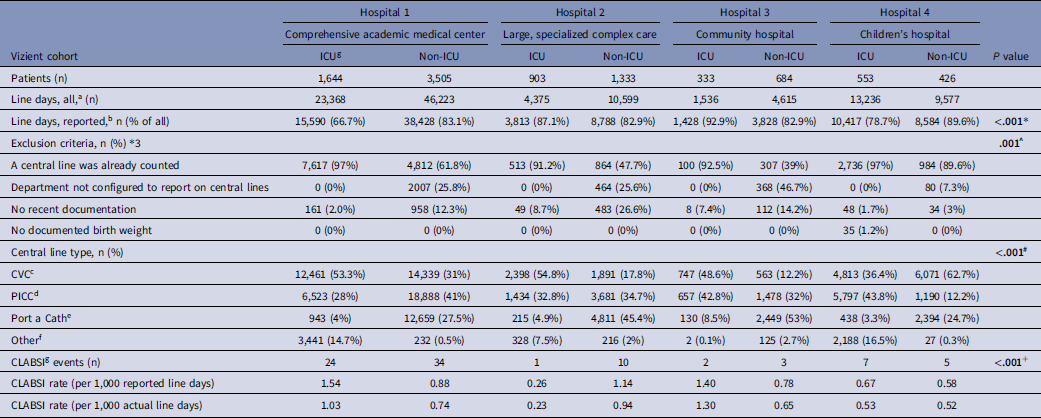
CLABSI rates and the magnitude of reduction when substituting actual for reported line days differed significantly across hospital and care settings (P < .001) (Table 2). Among ICUs, Hospital 1 had both the highest reported CLABSI rate (1.54 per 1,000 reported line days, 1.03 per actual line days; 33% reduction). Hospital 3 ICU had the smallest reduction (reported 1.40, actual 1.30; 7%), while Hospital 2 ICU (reported 0.26, actual 0.23; 13%) and Hospital 4 ICU (reported 0.67, actual 0.53; 21%) fell between. All adult non-ICU settings showed a 17% reduction in CLABSI rates using actual line days (Hospital 1: reported 0.70, actual 0.58; Hospital 2: reported 1.14, actual 0.94; Hospital 3: reported 0.78, actual 0.65). Hospital 4 non-ICU settings had a 10% reduction in CLABSI rates (reported 0.58, actual 0.52). The proportion of actual line days reported also differed significantly across ICU and non-ICU settings within each hospital (P < .001). Hospital 1 ICUs had the lowest proportion of reported line days at 66.7%, while Hospital 3 ICU had the highest at 92.9%.
Summative data by hospital and ICU v non-ICU

Table 2. Long description
The table presents data on CLABSI rates and line days across four hospitals, divided into ICU and non-ICU settings. It includes columns for each hospital and rows for various metrics such as patients, line days, exclusion criteria, central line types, and CLABSI events. Row 1: Patients (n): Hospital 1 ICU 1,644, Non-ICU 3,505; Hospital 2 ICU 903, Non-ICU 1,333; Hospital 3 ICU 333, Non-ICU 684; Hospital 4 ICU 553, Non-ICU 426. Row 2: Line days, all (n): Hospital 1 ICU 23,368, Non-ICU 46,223; Hospital 2 ICU 4,375, Non-ICU 10,599; Hospital 3 ICU 1,536, Non-ICU 4,615; Hospital 4 ICU 13,236, Non-ICU 9,577. Row 3: Line days, reported (n (% of all)): Hospital 1 ICU 15,590 (66.7 percent), Non-ICU 38,428 (83.1 percent); Hospital 2 ICU 3,813 (87.1 percent), Non-ICU 8,788 (82.9 percent); Hospital 3 ICU 1,428 (92.9 percent), Non-ICU 3,828 (82.9 percent); Hospital 4 ICU 10,417 (78.7 percent), Non-ICU 8,584 (89.6 percent). Row 4: Exclusion criteria, n (%): A central line was already counted, Department not configured to report on central lines, No recent documentation, No documented birth weight. Row 5: Central line type, n (%): CVC, PICC, Port a Cath, Other. Row 6: CLABSI events (n): Hospital 1 ICU 24, Non-ICU 34; Hospital 2 ICU 1, Non-ICU 10; Hospital 3 ICU 2, Non-ICU 3; Hospital 4 ICU 7, Non-ICU 5. Row 7: CLABSI rate (per 1,000 reported line days): Hospital 1 ICU 1.54, Non-ICU 0.88; Hospital 2 ICU 0.26, Non-ICU 1.14; Hospital 3 ICU 1.40, Non-ICU 0.78; Hospital 4 ICU 0.67, Non-ICU 0.58. Row 8: CLABSI rate (per 1,000 actual line days): Hospital 1 ICU 1.03, Non-ICU 0.74; Hospital 2 ICU 0.23, Non-ICU 0.94; Hospital 3 ICU 1.30, Non-ICU 0.65; Hospital 4 ICU 0.53, Non-ICU 0.52.
Bold values indicate P < .05.
a All = Central lines present including excluded.
b Reported = only central lines counted.
c CVC = Central Venous Catheter.
d PICC = Peripherally Inserted Central Catheter.
e Port-a-cath = implanted port.
f Other includes: Aphoresis lines, umbilical catheters, pulmonary artery catheters, and venous sheaths.
g ICU = Intensive Care Unit.
* Chi-sq % defective.
^ Monte Carlo χ2 goodness-of-fit test with 10,000 simulations; tests whether events are equally distributed across hospital × ICU categories.
# Chi-sq test for association.
+ Poisson Regression.
Exclusion reason distributions across ICU and non-ICU settings were also statistically different (P < .001). “Central line already counted” was the most frequent exclusion reason across nearly all care settings: Hospital 1 ICU 97%, non-ICU 61.8%; Hospital 2 ICU 91.2%, non-ICU 47.7%; Hospital 3 ICU 92.5%. The exception was Hospital 3 non-ICU settings, where “department not configured to report” was the most common exclusion (46.7%). The relative frequency of other common exclusions varied across hospitals and settings, although “no documented birth weight” was observed only at Hospital 4 ICU.
Plotting the percent of excluded lines by hospital and ICU by month we find Hospital 1 ICU experiences an exclusion rate above all other hospital and ICU combinations (Figure 1). The observed range for monthly rate at hospital 1 ICU was 31.1% to 41.7% while the range for all other hospital combinations was 2.6% to 25.7%. Hospital 1 ICU also maintains a patient population in which 33.4%–50.8% of patients had multiple concurrent central lines in any given month exceeding counts observed in any other hospital or care setting (Figure 2).
Time series plot of excluded lines by hospital and clinical setting.

Time series plot of patients with multiple lines by hospital and clinical setting.

Figure 2. Long description
A line graph titled ‘Time Series Plot of Average Patients with Multiple lines, Month’. The horizontal axis represents the months from January 2024 to December 2024. The vertical axis represents the percent of patients. The graph includes multiple lines representing different hospital units: Hospital 1 ICU, Hospital 1 Non-ICU, Hospital 2 ICU, Hospital 2 Non-ICU, Hospital 3 ICU, Hospital 3 Non-ICU, Hospital 4 ICU, and Hospital 4 Non-ICU. Each line shows the trend of average patients over the months. Hospital Care unit shows a peak in February 2024 and a general upward trend towards the end of the year. Other hospital units show varying trends with some peaks and troughs throughout the year.
Impact on QI initiative
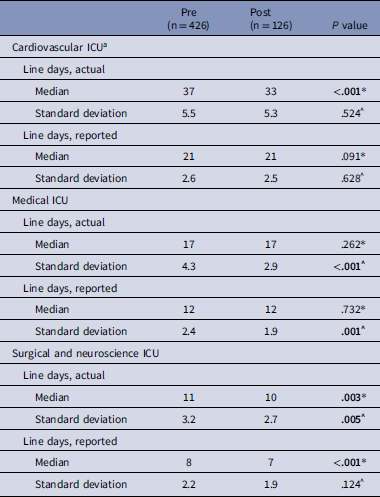
To assess the impact of the NHSN reporting methodology on the evaluation of a QI initiative, central line days were analyzed pre and postimplementation of a structured daily rounding checklist in Hospital 1 ICUs. The QI project focused on the utilization of a structured rounding tool that included a daily discussion of central line presence and necessity. Using the actual line days revealed significant improvement across all 3 ICUs, compared to only two with reported line data.
In the Cardiovascular ICU, no significant improvement in median lines per day was found when analyzing reported data. However, a significant reduction was detected when using actual line days (P < .001) (Table 3). No significant change was found in the standard deviation in either the actual or reported data set. In the Medical ICU, there was no difference in median line days in either data set. However, a significant reduction in standard deviation is noted in both actual (P < .001) and reported (P < .001) line days. The surgical and neuroscience ICU experienced a significant reduction in median line days in both the actual lines (P = .003) and the reported lines (P < .001), although only the actual count had a significant change in standard deviation (P = .005).
Impact of NHSN line reporting on quality improvement work

Table 3. Long description
A table with four rows and three columns comparing line days in different ICUs before and after a reporting intervention. The columns are labeled Pre (n = 426), Post (n = 126), and P value. The rows are grouped by ICU type: Cardiovascular ICU, Medical ICU, and Surgical and neuroscience ICU. Each group has sub-rows for actual and reported line days, with median and standard deviation values. Notable trends include significant reductions in median line days in the Cardiovascular ICU for actual line days and in the Surgical and neuroscience ICU for both actual and reported line days. Significant reductions in standard deviation are noted in the Medical ICU for both actual and reported line days and in the Surgical and neuroscience ICU for actual line days.
Bold values indicate P < .05.
a ICU = Intensive Care Unit.
* Mood’s Median.
^ Test and CI for two variances.
Discussion
NHSN central line day reporting methodology was designed to standardize surveillance across diverse clinical settings and minimize reporting and monitoring burden. 1,Reference Stevens, Geiger, Concannon, Nelson, Brown and Dumyati2 The one line per day rule developed through work by SENIC, NNIS, and NHSN reflects a pragmatic tradeoff between granularity and scalability and assumes that concurrent line frequency is standard across hospitals and care settings. Reference Haley, Culver and White3–Reference Horan, Andrus and Dudeck5 However, our findings suggest that the current reporting methodology systematically underestimates exposure in high acuity hospitals. Across four hospitals varying in size, acuity, and patient population, we found that actual central line days exceed reported line days at every site with the greatest magnitude of undercounting occurring in the highest acuity units. The exclusion rate was highest in the ICUs at Hospital 1, our Comprehensive Academic Medical Center, where 1 in every 3 lines went unreported. These findings suggest that current methodology disproportionately affects higher-acuity institutions, creating potential for misrepresentation of infection risk and inequity in inter-institutional benchmarking.
The primary driver of line day undercounting was the NHSN rule stipulating that multiple, simultaneous central lines are counted as single line day. Reference Stevens, Geiger, Concannon, Nelson, Brown and Dumyati2 This effect was most pronounced in ICU settings where greater than 90% of excluded line days across all sites were attributable to this criterion. In the Hospital 1 ICUs, between 31% and 41% of actual line days went unreported during the study period (Figure 1), corresponding to a patient population in which 33.4%–50.8% of patients had multiple concurrent central lines in any given month (Figure 2). Meanwhile, no other hospital or care setting in our study exceeded 28.2% of patients having multiple concurrent central lines in a month. Beyond the numbers, this discrepancy is also clinically meaningful. Multiple concurrent lines increase the number of lumens, hubs, and dressing change opportunities, each representing a potential port of entry for infection. Data from multiple studies have shown increased infection risk with multiple lumens. Reference Concannon, van Wijngaarden, Stevens and Dumyati6–Reference Dube, Jacob and Zheng10 In our study, when CLABSI rates were recalculated using actual line days, ICU and non-ICU departments across hospitals showed meaningful reductions in CLABSI rates. This is consistent with a study by Couk et al., which showed that using the actual line days instead of reported line days decreased CLABSI rates by 25% in ICUs. Reference Couk, Chernetsky Tejedor, Steinberg, Robichaux and Jacob12
Our QI analysis illustrates the practical consequences of these reporting gaps. Analysis of a structured daily rounding checklist using reported line data alone suggested improvement in 2 of 3 ICUs, with no differences detected in our Medical ICU. Re-evaluation of the data using actual line days revealed that significant improvements were actually present across all three ICUs. While reported line days remain the standardized metric for national benchmarking and regulatory reporting, using actual line days offers additional sensitivity for detecting change in concurrent line burden. This discordance illustrates the risk for institutions relying solely on central line data reported in accordance with NHSN guidelines. Under current reporting standards, a clinically meaningful improvement in central line burden would have gone undetected.
Our findings point to actionable opportunities for healthcare teams. Hospital systems investing in improvement metrics would benefit from tracking both reported and actual line days on internal dashboards. This will help to ensure that QI initiatives are evaluated against a denominator that adequately reflects the full scope of patient exposure. Recognizing that the development of these internal measures for tracking both types of line days is dependent upon structural data reporting and collection practices, coordination with information technology and analytics teams will be critical for success. While the development of internal dashboards was initially labor intensive, we found that identifying and measuring these data from the EMR was possible, and once created, internal dashboards could be sustained with minimal additional effort.
Limitations
This analysis has notable limitations. First, all data is from a single health system in the state of Minnesota. Data were analyzed from a single year, and any seasonal changes or year-specific events could influence findings. While significant effort was made to maintain data integrity, data on central lines is only as accurate as the EHR documentation and data pipelines used to retrieve and categorize it. The authors aimed to mitigate this risk with validity auditing and management of missing timestamps. Finally, no case-mix index or severity risk adjustment is performed across hospitals, which could confound comparisons. Without case-mix index or severity adjustment, authors cannot definitively attribute differences in line utilization patterns to patient acuity alone, and institutional or documentation practices may contribute.
Conclusions
Current NHSN reporting methodology systematically underestimates central line exposure at higher-acuity hospitals, impacting CLABSI benchmarking and obscuring quality improvement initiatives. Health systems should consider monitoring both reported and actual line days when evaluating performance or the impact of quality improvement initiatives.
Financial support
All authors have no financial interest to report.
Competing interests
All authors have no conflicts of interest to declare.