I. INTRODUCTION
Gold is the most malleable of metals. Besides chemical inertness, it is this property which allows for gold leaf production by hammering gold sheets into ultrathin films of only about 100 nm thickness. The process results in the development of a well-defined crystallographic texture even when using rather traditional materials and tools.Reference Kitagawa1 Gold-leaf production can serve as an example for complex plastic deformations which produce relatively simple and predictable structures in gold at the nanometer scale. In the course of this review, we describe how the development of crystalline structure in microscopic contacts determines microscopic processes of friction on gold surfaces.
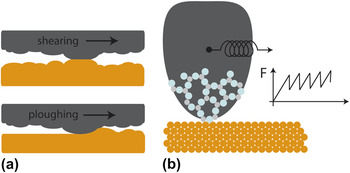
Two mechanisms are mostly considered when describing metal friction along the concepts of Bowden and TaborReference Bowden and Tabor2: shearing and ploughing as depicted in Fig. 1(a). Shearing describes the interfacial interactions when sliding two surfaces in contact. Thereby, the real area of contact consists of a multitude of microscopic contacts between asperities on the contacting surfaces. Ploughing describes the plastic deformation when an asperity of the harder metal cuts through the surface of the softer metal.
Schematic introduction to models in tribology and nanotribology. (a) The two contributions to friction on metals after Bowden and Tabor.Reference Bowden and Tabor2 Shearing refers to the interfacial interactions in sliding, ploughing refers to the plastic deformation of the softer metal by asperities of the harder metal. (b) Sketch of Prandtl–Tomlinson models of atomic friction (for a recent review see Ref. Reference Müser3): the combination of a periodic surface potential and a spring pulling the contact results in a stick–slip motion with the periodicity of the surface lattice.

Nanotribology is the science of sliding contacts with a radius on the nanometer scale. Two main motivations drive the progress in this field. One is the general interest in friction in smaller systems, where surface forces become more important than at larger length scales and eventually become comparable with externally applied forces. The other motivation is the crucial role of microscopic contacts between asperities for the description of macroscopic friction. By studying single asperity contacts, nanotribology aims to provide input to the fundamental understanding of friction. Friction force microscopy results for crystalline surfaces often include the so-called atomic stick–slip pattern. The friction force acting on the sliding asperity is modulated with the periodicity of the atomic surface lattice. This observation has been explained in models that follow suggestions by Tomlinson and Prandtl, for a recent review see Ref. 3. The idea is illustrated in Fig. 1(b): the asperity is pulled by a spring along the periodic surface potential, causing the contact to stick and slip and resulting in a saw-tooth-shaped modulation of the lateral force. In this paper, we will review results of nanotribological studies of gold and discuss microscopic mechanisms of friction, which go beyond the simplified picture of Prandtl–Tomlinson models. One particularly important mechanism is the formation of a metallic neck between the sliding asperity and the gold surface.
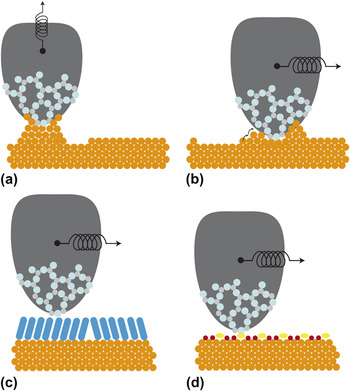
The four sections of the paper are summarized in Fig. 2. First we discuss evidence for the formation of necks between the tip and the gold surface and their signature in pull-off experiments. We then review single-asperity friction experiments on the clean gold surface with an emphasis on atomic stick–slip observations and the role of surface diffusion. A further section describes the friction reduction achieved by self-assembly of monolayers on gold surfaces. Finally, we summarize results for the changes in friction by electrochemical modification of gold surfaces.
Representation of the experimental approaches presented in this paper. (a) The formation of a metallic neck between the tip and the gold surface in contact leads to a characteristic adhesion behavior. (b) Single-asperity friction experiments on gold involve ploughing on atomic scale. Shearing is complemented by formation of a metallic neck between asperity and surface, therefore surface diffusion plays an important role in microscopic mechanisms of friction. (c) Gold surfaces can be passivated by alkanethiol self-assembled monolayers to promote low-friction regimes. Domain boundaries exhibit stronger friction than defect-free domains. (d) Friction on gold surfaces can be modified by electrochemical adsorption. One example is the friction reduction by a coadsorption of copper and sulfate ions.

II. NANOMETER-SCALE GOLD CONTACTS
Microscopic contacts of gold are among the best-known quantum objects as their quantum nature can be demonstrated in simple table-top experiments. For this demonstration, two crossed macroscopic wires a millimeter in diameter covered with gold are brought almost into contact, a voltage of 10 mV is applied, and the current across the contact is measured with adequate amplification. When tapping the table, the wires will oscillate, swinging in and out of contact, and in the course of breaking the macroscopic contact, a microscopic contact is formed which exhibits a quantized conductance.Reference Costakramer, Garcia, Garciamochales and Serena4 Beyond the quantization of the conductance, it is remarkable that the rather rough experiment results in the reproducible formation of microscopic contacts. For the purpose of this discussion of friction on gold, we note that microscopic contacts on gold form reliably on short time-scale for a wide range of normal forces.
The mechanical properties of microscopic gold contacts have received considerable attention since the tools for their study have become available. Extending the observation on gold leaf to lateral dimensions on the nanometer scale, mechanical annealing through repeated deformation and relaxation has been found to produce a reproducible texture in microscopic contacts.Reference Sabater, Untiedt, Palacios and Caturla5 Forces related to the rupture of single atomic bonds or to the nucleation of single dislocations can be estimated to be in the order of 1 eV bond energy per 0.1 nm distance, i.e., 1.6 nN. Such forces and even fractions thereof can be measured by means of atomic force microscopy (AFM). Force measurements on breaking gold contacts have revealed a step-wise force relaxation with each quantized step in conductance.Reference Rubio, Agrait and Vieira6 Structural transformations can be observed by means of in situ transmission electron microscopy (TEM) with a resolution of atomic gold wires.Reference Ohnishi, Kondo and Takayanagi7 Of particular interest for our review is the direct observation of cold welding at the nanometer scale. By bringing gold wires with arbitrary crystallographic orientation into contact at room temperature, one can stimulate the formation of a single crystalline contact.Reference Lu, Huang, Wang, Sun and Lou8
Research into the mechanical properties of microscopic gold contacts has been guided by atomistic simulations. The pioneering work of Landman et al.Reference Landman, Luedtke, Burnham and Colton9 showed that contact formation between a nickel tip and a gold surface occurs through transfer of atoms, plastic–elastic deformation during indentation, and neck formation upon retraction of the tip. Atomistic simulations have since then revealed atomic-scale mechanisms of contact formation for various materials. The interaction potentials used in atomistic simulations of mechanical properties have now reached a high degree of elemental specificity.Reference Sinnott and Brenner10 Unique to simulations, they can still be tuned to reveal the influence of interaction potentials on microscopic mechanisms. Song and Srolovitz demonstrated, e.g., that the relative importance of atom transfer and of plasticity in contact formation depends critically on the adhesion, which can be adjusted in simulations.Reference Song and Srolovitz11
In summary, experimental studies and atomistic simulations have provided a rich picture of the mechanical processes involved in the formation and breaking of microscopic gold contacts. Mechanisms like cold welding, atom transfer, or mechanical annealing are of great importance in the sliding friction on gold surfaces. Key signatures of gold contacts are the characteristic drops in adhesive force, which occur due to the neck deformation when contacting surfaces are separated. When retracting the tip of an AFM after performing friction experiments on clean gold surfaces, one observes these signatures force drops as will be discussed below [Fig. 4(b)]. Thus, the formation of gold necks between tip and surface plays an important role in the understanding of microscopic friction on gold.Reference Bennewitz, Broermann, Egberts, Gosvami, Hausen and Held12
III. SINGLE ASPERITY FRICTION EXPERIMENTS AND SIMULATIONS ON GOLD
For a general introduction into the field of single-asperity friction, the reader is referred to broader reviews with an emphasis on friction and wearReference Szlufarska, Chandross and Carpick13 or on the validity of Amontons’ Law at small scale.Reference Gao, Luedtke, Gourdon, Ruths, Israelachvili and Landman14
A. Friction force microscopy on gold
A pioneering experimental study by Polaczyk et al.Reference Polaczyk, Schneider, Schofer and Santner15 showed what happens if the oxidized silicon tip of an AFM slides over a clean reconstructed Au(100) surface in ultrahigh vacuum (UHV) environment. Topographic images revealed atomically flat terraces on the gold surface. The lateral force measurement was not calibrated, but lateral forces on atomically flat terraces were five times lower than on mica, measured with the same AFM tip. Polaczyk et al. excluded abrasive displacement of atoms as a major contribution to the lateral force acting on the tip based on the observation that scanned areas remain flat and are separated from surrounding untouched areas by not more than atomic-scale steps. A key experiment for the understanding of single-asperity friction is the determination of its load dependence. Polaczyk et al.Reference Johnson16 reported a nonlinear dependency, which agreed well with the predictions of the Johnson–Kendall–Roberts model for the load-dependence of the contact area between a ball and a flat surface, including adhesion. This result supports the idea that friction is the product of the contact area and a load-independent material parameter, the shear stress.
The wording of Polaczyk’s interpretation of the results is somewhat misleading, as they concluded that elastic deformation is the main dissipative contribution. However, we contend that the dissipative contribution is the interfacial friction, which is proportional to the contact area and therefore determined by elastic deformation.
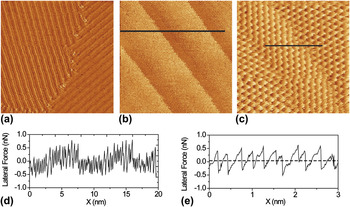
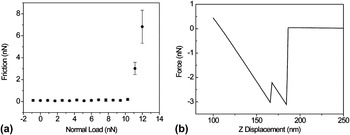
More recently, Gosvami et al.Reference Gosvami, Filleter, Egberts and Bennewitz17 performed high-resolution AFM friction experiments on Au(111) surfaces under UHV conditions using an oxidized silicon tip and reported unique friction versus load characteristics. Friction maps recorded on clean Au(111) surfaces were correlated with the well-known herringbone reconstruction as shown in Fig. 3. Very low average friction (<0.1 nN) was observed in connection with clear atomic stick–slip modulations of the lateral force [Figs. 3(d) and 3(e)]. Friction did not increase with increasing normal load and no wear of the surface was detected in this low-load regime [see Fig. 4(a)]. When the load was increased above a critical value of ∼11 nN, wear of the surface occurred and friction suddenly increased by more than one order of magnitude.
Lateral forces recorded in contact mode on the Au(111) surface showing the herringbone reconstruction. (a) Lateral force map (130 × 130 nm, normal load ∼0 nN). (b) Lateral force map (20 × 20 nm, normal load ∼8.0 nN). (c) Lateral force map (5 × 5 nm, normal load ∼8.0 nN). (d) Cross-section along the line indicated in (b). Atomic stick–slip and a modulation caused by the reconstruction can be recognized. (e) Cross-section along the line indicated in (c). Note that the average friction, indicated by a dashed line, is very small compared with the modulation of the lateral force. The value of the average force is calculated from full frames such as shown in (c) to average any effects of the reconstruction.

(a) Friction versus load curve recorded on the Au(111) surface. Each point is calculated as average of a lateral force map like the one in Fig. 3(c), the error bars indicate the standard deviation. Friction is negligible and does not change with load until a critical normal load of ∼11 nN, above which a sharp rise in friction is observed due to the onset of wear. (b) Pull-off force curve recorded after sliding on Au(111). The partial force release in the adhesive part is a key signature for plastic deformation of a gold neck between the tip and the sample. More details of the plastic deformation can be detected with stiffer force sensors,Reference Rubio, Agrait and Vieira6 which are however not sensitive enough for atomic friction experiments such as reported in Fig. 3.

A similar instance of a load-independent low-friction regime was reported previously by Socoliuc et al. for NaCl(100) surfaces, where smooth sliding of the tip occurs at very low loads with almost zero friction. Friction increases linearly above a critical load with the onset of atomic stick–slip.Reference Socoliuc, Bennewitz, Gnecco and Meyer18 The transition from load-independent smooth sliding to linear increase of stick–slip friction with load was explained by the Prandtl–Tomlinson model of a spring pulling the contact along a sinusoidal potential [see Fig. 1(b)]. In this model, larger amplitudes of the sinusoidal potential lead to instable configurations resulting in dissipative stick–slip. The results of Socoliuc’s study indicate that an increased load leads to larger amplitudes of the sliding potential, which may be the consequence of a decreased distance between the two sliding surfaces.
B. Neck formation between the tip and surface
In contrast to the experiments on NaCl(100) reported by Socoliuc et al., the peculiar load-independent low-friction regime on Au(111) surfaces exhibits clear atomic stick–slip. The observations suggest that the sliding Au contact cannot be explained by the simple atomic friction model. It is often assumed in the interpretation of single asperity friction experiments of ionic crystals or layered materials that within the elastic regime, there is no significant change in the atomic structure of surface and tip. However, the situation will be far more complex in case of metals, where surface diffusion of metal atoms is expected for clean surfaces in UHV.Reference Jaklevic and Elie19 Gold has been observed to diffuse and wet the counter surface in various experiments such as nanoindentationReference Thomas, Houston, Michalske and Crooks20 and in situ TEM–AFM experiments.Reference Merkle and Marks21 It was thus proposed that the diffusion of gold atoms around the contact zone leads to an equilibrium contact size, resulting in load-independent friction. The formation of a gold neck with finite diameter is confirmed by the observation of their experimental key signatures; the force drops due to the neck deformation when separating the surfaces in contact after the friction experiment [see Fig. 4(b)]. Note that the clear images of the surface reconstruction in Fig. 3 suggest that the actual glide plane between sliding tip and surface is still directly on top of the reconstructed surface despite the formation of a nanometer-scale neck.
The importance of diffusion of gold surface atoms at room temperature for the sliding process was further demonstrated by scanning the tip over the gold surface at increased load which produced atomic-layer deep wear scars. Subsequent imaging of the surface at low load revealed that within the next few minutes, the worn area was not only completely healed but also the surface reconstruction was fully restored.Reference Gosvami, Feldmann, Peguiron, Moseler, Schirmeisen and Bennewitz22 Values of the diffusion constant for self-diffusion on Au(111) vary significantly between calculations.Reference Antczak and Ehrlich23 Jaklevic et al.Reference Jaklevic and Elie19 report around 0.12 s for gold atoms to hop one atomic site, in agreement with our observation of healing of a nanometer-scale scratch within minutes. Sommerfeld et al.Reference Sommerfeld, Cambron and Beebe24 find a self-diffusion constant of the order of 10−18 cm2/s, suggesting thousands of seconds as healing time for a nanometer-sized scratch. However, we cannot exclude that the diffusion of atoms is strongly influenced by the ongoing scanning of the AFM tip.
C. Role of temperature
The crucial role of surface diffusion in steady-state friction on Au(111) has been confirmed by AFM experiments at varying temperatures.Reference Gosvami, Feldmann, Peguiron, Moseler, Schirmeisen and Bennewitz22 Reducing the temperature to a regime where the detachment–attachment mechanisms of gold intralayer diffusion on Au(111) are frozen in,Reference Bracco and Cavanna25 the characteristics of single-asperity friction changes dramatically. Rather than sliding in a steady state and showing regular atomic stick–slip, friction increases with time at temperatures below 170 K, indicating the growth of the contact area during sliding. At low temperatures, sliding results in an ever growing contact and wear of the surface. The mechanisms of self-healing and the equilibrium contact size are not operating because of the lack of diffusion. The increasing area of the contact can be further confirmed by pulling the tip out of contact after scanning for several minutes. As expected for a growing contact, adhesion increases significantly while scanning at low temperature. A strong drop in friction and adhesion was reproducibly observed when a new contact was reestablished after the pull-off experiment, just to start growing again upon scanning.
It was also observed that at low temperatures, the friction loop did not exhibit the regular straight saw-tooth shape of Fig. 3(e), but a strong hysteresis between scanning forward and backward and a distortion of the stick–slip pattern. Molecular dynamics (MD) simulations confirmed that the distorted friction loops are the result of plastic deformation in an extended gold neck between the tip and the gold surface rather than of stick–slip sliding. The straight friction loops with regular atomic stick–slip could only be reproduced in simulations when the initial setup comprised a harder AFM tip, implemented as Ni tip. Unfortunately, the limits on simulated time prohibit the inclusion of surface diffusion effects in friction simulations.
Nevertheless, atomistic simulations do allow for an understanding of the stick–slip dynamics in contacts between materials where no atoms are transferred. Li et al.Reference Li, Dong, Perez, Martini and Carpick26 reported a direct comparison between experiment and simulations for a Pt tip sliding on Au(111) surfaces. The experiment was carried out in a nitrogen environment and neck formation was less often observed compared with vacuum experiments. The focus of the study was the velocity dependence of atomic friction on gold, matching experiment, and accelerated MD simulations as closely as possible. The logarithmic velocity dependence of atomic friction, found in experiment and simulation, was interpreted as a result of a thermal activation of the stick–slip process. Analyzing their results within the Prandtl–Tomlinson model,Reference Müser3 the authors found a close match between experiment and simulation with respect to the relevant parameters of the Prandtl–Tomlinson model. The matching results suggest that simulations based on pair potentials can be reliably used to interpret experimental results. In particular, details of the atomic dynamics in the sliding contact can be analyzed, which are not accessible to experiments.
D. Comparison with other metals
It is interesting to compare the results discussed so far with single asperity friction on other clean metal surfaces. Bennewitz et al.Reference Bennewitz, Gyalog, Guggisberg, Bammerlin, Meyer and Guntherodt27 studied clean Cu(111) surfaces under UHV conditions using an electrically conductive but oxidized silicon tip. In this experiment I(V)-curves were also recorded, which showed typical nonlinear characteristic of a metal-oxide-semiconductor junction. The current flow through the contact junction, which can be related to the contact area,Reference Jarvis, Lantz, Ogiso, Tokumoto and Durig28 did not change with load. It was concluded that for copper, a metallic neck forms between tip and surface with a load-independent diameter, in agreement with the observations on gold. Similar results are also found for the load dependence of atomic friction for copper.Reference Gosvami, Filleter, Egberts and Bennewitz17
Enachescu et al.Reference Enachescu, Carpick, Ogletree and Salmeron29 performed single asperity friction studies on Pt(111) surfaces under UHV conditions and found that it is impossible to establish a stable sliding contact when the tip as well as the substrate were carefully cleaned. The adhesion was very high in such situations. The lack of success in establishing stable stick–slip sliding may be related to the fact that self-diffusion on Pt(111) is expected to be significantly slower than on Au(111).Reference Sommerfeld, Cambron and Beebe24 Possible contamination of the contact was probed with an electrically conducting tungsten carbide-coated silicon tip. Passivation by contamination of either tip or substrate led to stable sliding and observation of regular atomic stick–slip.
E. Application of nanoscale gold contacts
The noble metal gold with its excellent electrical properties is an ideal candidate for key engineering applications such as sliding electrical contacts in micro- and nano-electromechanical systems (MEMS and NEMS).Reference Chen, Lee, Guo, McGruer, Gilbert, Mall, Leedy and Adams30 The results introduced in the previous sections provide microscopic details of the sliding mechanisms and indicate that surface diffusion, cold welding, and material transfer have to be considered in the design of such contacts. The AFM technique not only provides mechanical characteristics of nanoscopic gold contacts but also allows for their electrical characterization. Various studies have investigated the electrical properties of nanoscale metal contacts under controlled load,Reference Gosvami, Sinha, Hofbauer and O'Shea31,Reference Gosvami, Sinha and O'Shea32 however, a recurring problem is the performance of the tip as an electrical probe. Microfabricated AFM tips are usually nonmetallic, and the metal-coated silicon or silicon nitride tips often used for electrical measurements easily wear due to the high contact pressure (∼several GPa) acting at the tip apex or due to the cold welding.Reference Lantz, O'Shea and Welland33 Other tip materials have been explored to provide more robust mechanical and electrical measurements of metal substrates such as heavily doped diamond and platinum silicide (PtSi) tips.Reference Bhaskaran, Sebastian and Despont34 Diamond coating provides good wear protection but the electrical properties are not satisfactory, whereas PtSi tips seem to perform well in terms of conductivity when sufficient load (>40 nN) is applied. This minimum load is required to remove contaminants at the apex left behind from the microfabrication process. Recently, Koelmans et al.Reference Koelmans, Sebastian, Abelmann, Despont and Pozidis35 reported improvement in the quality of electrical contacts and a reduction of wear by means of a force modulation technique. These examples show that there is a need for more progress in the development of suitable tip materials and in strategies for the mechanical design of future microscale devices involving sliding electrical contacts on gold.
In summary, various single-asperity friction studies on clean metal surfaces have indicated complex behavior as a result of surface diffusion and transfer of material to the tip. In situ TEM has helped to directly observe a strong diffusion-assisted formation of a neck between the sliding tip and the metal surface. Further experiments are needed to clarify the role of temperature and materials in the microscopic mechanisms of single-asperity friction.
IV. FRICTION AND MOLECULAR LAYERS ON GOLD
The tribological properties of gold surfaces can be tuned by deposition of molecular films. In particular, alkanethiol films have been extensively studied in the past as they chemically adsorb and self-assemble into highly crystalline structures.Reference Ulman, Eilers and Tillman36 These molecular films find tribological applications as boundary lubricants, particularly in MEMS devices where conventional oil-based lubricants cannot be used as the viscous drag forces, and capillary-induced adhesion become too large.Reference Maboudian and Carraro37 Friction and adhesion of these films can be controlled by varying the molecular architecture such as chain length, functional groups, degree of saturation, and cross-linking.Reference Szlufarska, Chandross and Carpick13 In a pioneering study, Thomas et al.Reference Thomas, Houston, Michalske and Crooks20 showed that alkanethiol films can passivate gold surfaces in nanoindentation experiments such that cold welding of tip and sample, which poses serious problems in the interpretation of indentation plasticity, is eliminated.
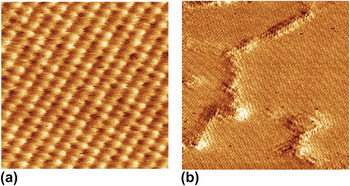
Alkanethiol films on gold surfaces have been studied in great detail using AFM in ambient and vacuum environments. In our own experiments performed on a defect-free domain using oxidized silicon tips, we found an ultra-low friction regime with friction <4 pN at low loads with smooth sliding of the tip over the molecular surface. As the load was increased, a regular molecular stick–slip friction was detected even revealing the c(4 × 2) reconstruction of monolayer, see Fig. 5(a). Details of the experimental procedure are provided in Ref. Reference Gosvami, Egberts and Bennewitz38. These observations resemble the results by Socoliuc et al.Reference Socoliuc, Bennewitz, Gnecco and Meyer18 described above on NaCl(001) and thus provide direct evidence that well-ordered self-assembled monolayers support a sliding tip like a crystalline solid.
(a) Lateral force map (10 × 10 nm) of a defect-free domain of a decanethiol self-assembled monolayer (SAM) on Au(111). The molecular-scale stik–slip patterns corresponds to the c(4 × 2) superstructure of the SAM. A normal force of −0.5 nN was applied, balancing the tip and the sample adhesion. (b) Lateral force map (75 × 75 nm, 0 nN applied normal force) of a decanethiol SAM on Au(111). Highly ordered domains with different molecular orientations are separated by domain boundaries which exhibit higher friction (brighter color).

The density of defects in the molecular films has been identified as most important for their frictional response. The defect density can be varied, e.g., by varying the chain length of the alkanethiol molecules. Lio et al.Reference Lio, Charych and Salmeron39 showed that films of longer chain length have lower friction and attributed this finding to the observation that higher cohesive forces between longer chains reduce the defect creation by a sliding sharp asperity. Zuo et al.Reference Zuo, Xiong, Xie and Xiao40 investigated the effect of disorder in the films on friction by self-assembly of mixed alkanethiol molecules with different chain lengths. Gauche defects in such mixed monolayers were found to decrease friction possibly due to the suppression of other dissipation channels. A direct proof for the importance of defects is the comparison between friction on well-ordered regions and on regions containing a domain boundary shown in Fig. 5(b). Friction on the less-ordered domain boundary was one order of magnitude higher than on defect-free domains.Reference Gosvami, Egberts and Bennewitz38
Another important factor for the frictional response of alkanethiol monolayers is the nature of the terminal group of the molecules. The conformation of the terminal C–C bond is different for odd or even numbers of carbon atoms in the molecular chain, resulting in a different resistance to gauche defect formation under load as discovered in atomistic simulations.Reference Mikulski, Herman and Harrison41,Reference Ramin and Jabbarzadeh42 Friction is also affected by chemical modification of the terminal group. Fluorinated alkanethiol films (–CF3) show much lower friction than –CH3-terminated alkanethiol films, which has been suggested to be the result of higher packing density in the fluorinated films.Reference Park, Lorenz, Chandross, Stevens, Grest and Borodin43 Various simulation studies have complemented experimental observations and provided a deeper understanding of the microscopic details underlying the friction and wear mechanisms in alkanethiol-covered gold surfaces.Reference Szlufarska, Chandross and Carpick13
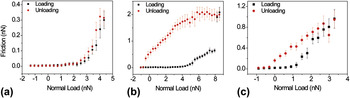
Mechanical experiments on alkanethiol films on gold using an interfacial force microscope have been reported by Kiely et al.Reference Kiely, Houston, Mulder, Hsung and Zhu44 who found a perfectly elastic response and correspondingly low friction on freshly prepared films at low loads. Above a critical load of a few microNewtons, friction increased probably as result of significant penetration of the probe into the monolayer film. A similar observation can also be made with the sharper tips of an AFM. Figure 6 shows the load dependence of friction in different experimental situations. If the load is always kept below the threshold for the onset of wear [Fig. 6(a)], the surface deformation is fully elastic and one can reversibly switch between the constant low-friction regime at below 2 nN load and the linear friction regime above 2 nN load. Once the wear threshold at 8 nN is exceeded [Fig. 6(b)], friction suddenly increases by a factor of three and no low-friction is recovered when the load is lowered; the SAM is permanently damaged.
Average friction as a function of applied normal load recorded on decanethiol SAMs for three different situations: (a) on a defect-free domain staying below the wear threshold, (b) on an initially defect-free domain exceeding the wear threshold at 8 nN, and (c) on a domain boundary. All measurements have been performed with the same oxidized silicon tip.

The frictional response is different on a less-ordered domain boundary [Fig. 6(c)]. Friction increases due to wear of the SAM at a lower normal load of 1 nN. However, the deformation of the SAM is partially reversible by lowering the normal load and the low-friction regime is recovered at low loads. We have observed that the domain boundary is slightly shifted in position after this type of experiment.Reference Gosvami, Egberts and Bennewitz38 It is assumed that the lower density and the order of molecules allows for a reorganization of the SAM once the load on the tip is reduced.
V. ELECTROCHEMICAL CONTROL OF FRICTION ON GOLD
Gold electrodes in aqueous and ionic liquids electrolytes are among the best-characterized electrochemical surface systems. Surface reconstruction, anion and cation adsorption, and oxidation state can be reversibly modified by varying the electrochemical potential. All these modifications have a significant influence on single-asperity friction on Au(111) and Au(100) surfaces.Reference Hausen, Gosvami and Bennewitz45–Reference Labuda, Hausen, Gosvami, Grutter, Lennox and Bennewitz48 Dedicated instrumentation allows atomic stick–slip phenomena to be resolved, which give insight into the atomic structure of the relevant glide plane in the contact. For example, atomic friction experiments on a layer of copper cations deposited on Au(111) in under-potential conditions reveal that the relevant glide plane is a CuCl layer which forms by adsorption of chloride from the electrolyte. Friction on this CuCl layer is increased by a factor of five as compared with the Au(111) surface.Reference Labuda, Paul, Pietrobon, Lennox, Grutter and Bennewitz47
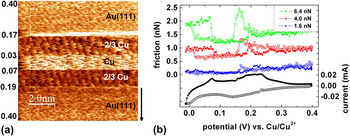
An example for electrochemically induced changes in friction is presented in Fig. 7. Copper was deposited onto Au(111) from a sulfuric acid electrolyte containing CuSO4, but no chloride. The electrochemical deposition is monitored by cyclic voltammogram, and its effects on friction are simultaneously measured by means of AFM. Starting from a potential of 0.4 V, the Au(111) is observed as regular stick–slip patterns in the lateral force map. At a potential of 0.17 V, two-thirds of a monolayer of copper are co-adsorbed with SO42− ions which form a √3 × √3R30° superstructure.Reference Toney, Howard, Richer, Borges, Gordon and Melroy49 The stick–slip pattern in the lateral force map changes to reflect this superstructure, and the average friction decreases as compared with the pristine Au(111) surface. At a potential of 0.03 V, the adsorbed layer changes into a full monolayer of copper, reflected in a change in the stick–slip pattern and a significant increase in the average friction. These transitions are reversible, as observed during the reverse sweep. The transitions from the copper monolayer coverage to the two-third coverage and further to the clean Au(111) occur at slightly higher potentials in the reverse sweep, but the corresponding peaks in the cyclic voltammogram and the changes in friction always coincide. Comparing the load dependence of friction for the different adsorption states of the surface, a clear tendency is observed. Friction on Au(111) is about double that on the surface with two-third copper coverage, and friction on a full monolayer of copper is about double the friction on Au(111). The initial deposition of copper on Au(111) and its final dissolution are both accompanied by a temporary maximum in friction.
(a) Lateral force map recorded on Au(111) in a sulfuric acid electrolyte containing CuSO4. The electrochemical potential was swept from 0.4 to −0.01 V and back to 0.4 V, whereas the image was recorded from top to bottom. Brighter color corresponds to higher lateral forces. The distinct atomic-scale stick–slip patterns correspond to the Au(111) surface, a surface covered by two-third of a monolayer copper and coadsorbed with SO42− ions, and a full monolayer of copper, respectively. (b) Cyclic voltammogram (black curves) recorded while sweeping the potential from 0.4 to −0.01 V (empty symbols) and from −0.01 to 0.4 V (full symbols) at a sweep rate of 10 mV/s. Simultaneously recorded friction curves are plotted for three different loads in the upper part. The curves for 4.0 nN and for 6.4 nN load are offset by 0.5 and 1 nN, respectively, for better readability. Each data point corresponds to the average lateral force along one line in a scan frame as shown in (a). Note that changes in friction coincide with peaks in the cyclic voltammogram.

As a general observation, friction on flat gold surfaces increases with increasing atomic scale-roughness of various reconstructions: from the herringbone reconstruction of the Au(111) surfaceReference Labuda, Hausen, Gosvami, Grutter, Lennox and Bennewitz48 over the wavy hexagonal reconstruction of the Au(100) surface, the cubic Au(100)(1 × 1) surface,Reference Hausen, Zimmet and Bennewitz46 ordered layers of specifically adsorbed sulfate anions on Au(111),Reference Hausen, Gosvami and Bennewitz45 up to the oxidized Au(111) and Au(100) surfaces with their nanometer-scale roughness.Reference Hausen, Zimmet and Bennewitz46,Reference Labuda, Hausen, Gosvami, Grutter, Lennox and Bennewitz48 We have as yet no explanation as to why the coadsorption of copper and sulfate results in a lower friction than on pristine Au(111), while the copper monolayer exhibits higher friction than Au(111). Strain induced roughening may play an important role in the effects observed in Fig. 7.
The reversibility even of the oxidation of gold surfaces allows friction to be switched between a low and a high state by changing the electrochemical potential. Such electrochemical switching of friction has recently been demonstrated also on a larger scale for copper.Reference Argibay and Sawyer50 The decrease of friction upon reduction of oxidized gold surfaces follows a healing of their crystalline structure, requiring significant mobility of gold atoms. Therefore, diffusion of surface atoms plays a similarly significant role for nanometer-scale friction on gold surfaces in an electrochemical environment as under UHV conditions. Traces of chloride in the electrolytes significantly increase this mobility and enable switching of friction within tens of milliseconds.Reference Labuda, Hausen, Gosvami, Grutter, Lennox and Bennewitz48 However, even in clean sulfuric acid solutions, the mobility is high enough to let monolayer islands decay within minutes after they are formed in the lifting of the herringbone reconstruction.Reference Hausen, Gosvami and Bennewitz45 Pulling the tip out of contact after friction experiments in electrolytes reveals weaker adhesion (typically <1 nN) compared with UHV experiments and no signatures for plastic deformation of a gold neck. We assume that the tendency to form a gold neck between tip and sample is weaker in electrolytes. Although we do not know the exact reason for the difference, it has been observed that surface diffusion of gold varies between vacuum and electrolyte environments,Reference Alonso, Salvarezza, Vara, Arvia, Vazquez, Bartolome and Baro51 the same can be expected for surface energies.
Quite recently, the electrochemical control of friction on gold surfaces has been realized using an ionic liquid, 1-butyl-1-methylpyrrolidinium tris(pentafluoroethyl) trifluorophosphate ([Py1,4]FAP), as an electrolyte.Reference Sweeney, Hausen, Hayes, Webber, Endres, Rutland, Bennewitz and Atkin52 In this case, friction is controlled by electrochemical variation of the ionic layer confined between sliding tip and sample. The replacement of aqueous electrolytes by ionic liquid electrolytes will widen the accessible window for electrochemical potentials and eventually allow to extend the electrochemical control of friction to less noble metals.
VI. SUMMARY
Friction force microscopy experiments on clean gold surfaces often reveal the atomic structure of the actual glide plane, including subtle reconstructions. Depending on the exact conditions—such as tip material and the environment—gold has the tendency to form a neck between tip and surface, which can carry some load and results in very low friction. The surface diffusion of gold atoms plays an important role in sustaining this dynamic low-friction regime. For increasing load on the contact, the neck and surface will eventually yield at which point friction becomes significant.
Stable low-friction behavior without neck formation can be achieved by passivation of the gold surfaces with self-assembled monolayers. Nanotribological experiments and simulations show how structural defects in the monolayer films limit their lubrication efficiency. An interesting option for the control of friction is the electrochemical modification of gold surfaces. Reversible changes in reconstruction, adsorption, and oxidation have a significant influence, where increased roughness of the atomic surface structure results in increasing friction.
Now that nanometer-scale experiments aiming at an understanding of fundamental mechanisms of friction and wear on gold surfaces are established, they may also contribute to the study of gold-based materials with dedicated tribological function. Such materials include, e.g., the “chameleon” coatings developed for space applications,Reference Voevodin and Zabinski53 tribologically optimized electrode materials,Reference Stoyanov, Gupta, Chromik and Lince54 or gold alloys for dental applications, which show interesting qualities in the reduction of friction and wear.Reference Wang, Liu, Si, Feng, Tao and Ma55
ACKNOWLEDGMENTS
The continuing support of this project by Eduard Arzt is gratefully acknowledged. The study has been financially supported by the Deutsche Forschungsgemeinschaft.