

In December 2014, Justin Welby, archbishop of Canterbury, made national headlines when he expressed his concern at the growing resort in Britain to charitably run food banks which he took to be symptomatic of the mounting hunger crisis facing many of the country's poorest families.Footnote 1 He confessed that he was unsurprised by the hunger omnipresent in the desperately poor countries of sub-Saharan Africa but shocked to find it in as developed and rich a country as Britain. This is because hunger in modern Britain arises not from any deficiency of food availability but from the lack by some people of the financial means of obtaining it. Apart from the homeless and the heavily indebted, those most likely to be in this predicament are people on low incomes with poor job security and, especially, unemployed people experiencing delays or reductions in welfare payments.Footnote 2 That is what makes this a hunger crisis and not a food crisis, for, historically, food crises have entailed a failure of both food availability and food entitlements, as commonly manifest in a sharp inflation of food prices.Footnote 3 Susceptibility to periodic food crises was and remains the lot of most societies at relatively low levels of economic development, including Britain prior to its industrial revolution and the onset of modern economic growth. In the most extreme cases, food scarcities have escalated into famines when starvation and starvation-related diseases elevated deaths above births.Footnote 4 Precipitating factors typically included weather-induced harvest failure, diseases of crops and livestock, war and the dislocation of trade.
Prices can be used to track England's own slow and belated escape from serious national food crises. The single longest and most robust price series is for wheat, since it was the most commercialised and universally traded foodstuff. Although wheat scarcely featured in the bare-bones basket of consumables upon which the poorest agricultural, artisanal and labouring households typically subsisted, its price powerfully influenced those of other grains and therefore may be taken as broadly representative of the costs of satisfying basic subsistence.Footnote 5 As a general rule, years when wheat prices were high were years when the living standards of the poor were under most pressure. Purchase prices of wheat are recorded in the Exchequer Pipe Rolls from the mid-1160s, sale prices in the Winchester Pipe Rolls from 1209 and then in a growing number of manorial accounts from the 1230s.Footnote 6 This information becomes virtually continuous from 1241, thereby providing an annual record of the price of this staple foodstuff spanning seven centuries.Footnote 7
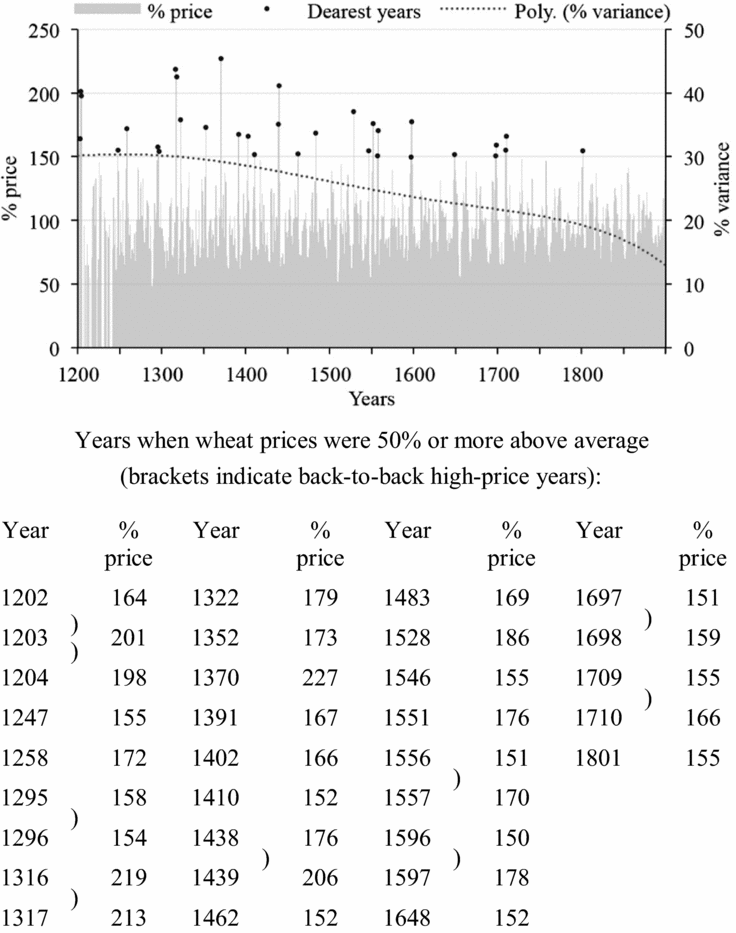
Since prices reflect money supply as well as market conditions, Figure 1 expresses the price of wheat as a percentage of the twenty-five-year moving average.Footnote 8 Price variations within two standard deviations of the mean were common, those in excess of that represent an extreme that only occasionally occurred. These were the crisis years when prices were inflated by 51 per cent or more. Rises of this magnitude were experienced on at least thirty-two occasions between 1200 and 1900 and in the five worst of these years – 1203, 1316–17, 1370 and 1439 – prices were more than double the average. More challenging still for consumers were back-to-back years of high prices, of which, following the double back-to-back crisis of 1202–4, there were seven: 1295–6, 1316–17, 1438–9, 1556–7, 1596–7, 1697–98 and 1709–10.Footnote 9 These include several of the most notorious food crises on English historical record, of which none was worse than the Great Northern European Famine of 1316–17 when prices more than doubled for two consecutive years, the daily and annual real wage rates of male agricultural and building labourers sank to their respective historical nadirs, and there was heavy excess mortality.Footnote 10 Real wage rates were also hit hard during the late Elizabethan crisis of 1596–7, although the associated price inflation was less pronounced and the demographic penalty was less punitive.Footnote 11
Seven centuries of English wheat prices, 1200–1900 (annual wheat price as a percentage of the twenty-five-year moving average)

It was the 1596–7 crisis that galvanised government into enacting a national Poor Law which thereafter guaranteed the basic food entitlement of many of those most vulnerable to scarcity.Footnote 12 Once the Poor Law was in place, the incidence of serious food crises appears to have abated and levels of price inflation moderated. There were only six seriously dear years after 1601, compared with twenty-six before, and in none of them did prices rise by more than two-thirds (Figure 1). On this measure of hardship, 1801 was the last significant national food crisis, when a bad harvest coincided with a national military emergency at a time of rapid demographic and economic change.Footnote 13 No subsequent scarcity has been as severe, not least because shortfalls in domestic agricultural output have increasingly been made good by significant food imports.Footnote 14
Over the course of these seven centuries from 1200 to 1900, the variance of these annual wheat-price variations subsided from a peak of over 30 per cent during the worst years of the thirteenth and fourteenth centuries to less than 13 per cent at the close of the nineteenth century (Figure 1). That decline first becomes apparent towards the end of the fourteenth century, as shrinking population and monetary deflation together initially took the pressure off prices, but thereafter became a firmly established trend which grew in momentum from the end of the eighteenth century. Driving this trend were the growing effectiveness of market arbitrage, improved institutional responses to scarcity and high prices, provision of a welfare safety net to protect the purchasing power of the poor, higher agricultural productivity and, eventually, the internationalisation of food supplies.Footnote 15
During the centuries prior to the Poor Law high-price years occurred with such frequency that most people will have experienced at least one during their lives. The longest interval between two such dear years was the sequence of forty-five years between 1483 and 1528, whereas until then food crises had occurred at intervals of between five and thirty years. Scarcity, in fact, was commonplace and, since England was poor, under-developed and heavily dependent upon the current year's harvest, this must always have been the case.
Among the many crisis years of dear food identified by Figure 1, there is nothing ostensibly about that of 1258 to invite closer inspection: other crises were longer, more acute and greater in their demographic impact. Nevertheless, it merits attention as the earliest food crisis upon which significant historical light can be shed, from recorded prices and harvests, the comments of contemporary chroniclers, excavated skeletal remains and an array of palaeo-climatic proxies, especially precisely dated dendrochronologies.Footnote 16 It also occurred at a critical juncture, as the established momentum of demographic and economic expansion began to falter and male daily real wage rates and GDP per head both began to trend down.Footnote 17 This meant that it was the augury of worse to come, in 1295–6 and particularly 1316–17.Footnote 18 Strikingly, it accompanied, and was overshadowed by, a famous political crisis between Henry III and his barons at a formative stage in the evolution of parliamentary institutions.Footnote 19 And most intriguingly of all, it coincided with global fallout from the mega-eruption of Samalas Volcano, Indonesia, the previous year, about which sensational claims have been made.Footnote 20
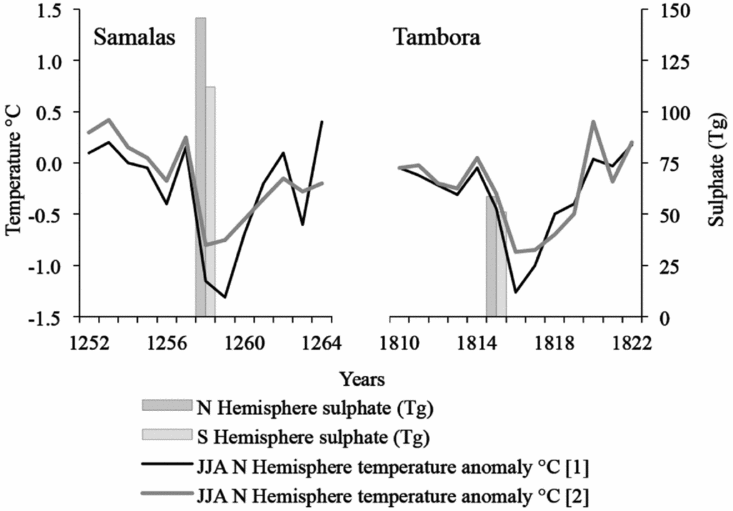
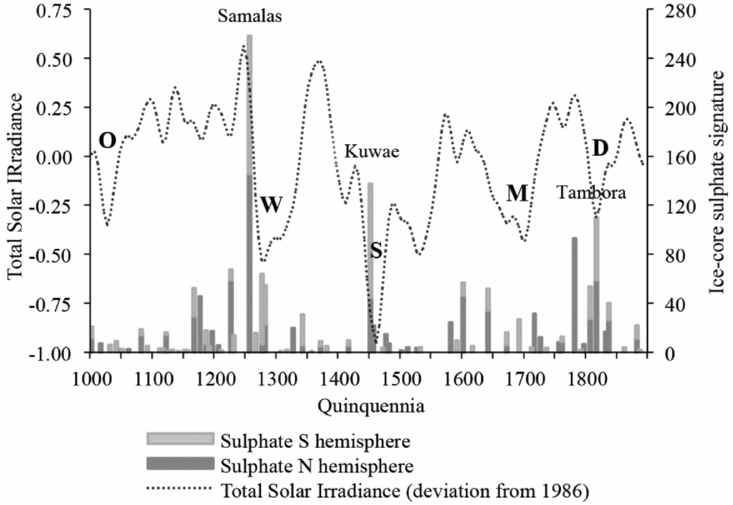
Since 1999, when Richard Stothers first drew attention to a massive mystery eruption in c. 1258, scientific interest in what has now been identified as the Samalas eruption has been high.Footnote 21 Comparison is made with the Volcanic Explosivity Index (VEI) 6.9 mega-eruption of Mount Tambora on the neighbouring Indonesian island of Sumbawa on 10 April 1815 and the poor weather and inferior harvests during the following ‘year without a summer’ for which it was responsible (Figure 2).Footnote 22 It is presumed that the Samalas eruption likely had similarly serious human consequences on a global scale. In fact, for scientists interested in volcanic forcing of global climates, the 1257/8 mega-eruption stands out as potentially one of the most dramatic events of the entire Holocene.Footnote 23 The possibility that this catastrophic eruption triggered the abnormal weather that ruined harvests and precipitated the serious food crisis in England, thereby heightening latent political tensions, provides a story almost too compelling to resist telling. Whether this presumed historical chain of events fits the available evidence is another matter.
Comparison of the sulphate signatures and temperature impacts of the Indonesian mega-eruptions of Samalas in 1257/8 and Tambora on 10 April 1815

I The chronology of the crisis: prices, harvests and oak growth
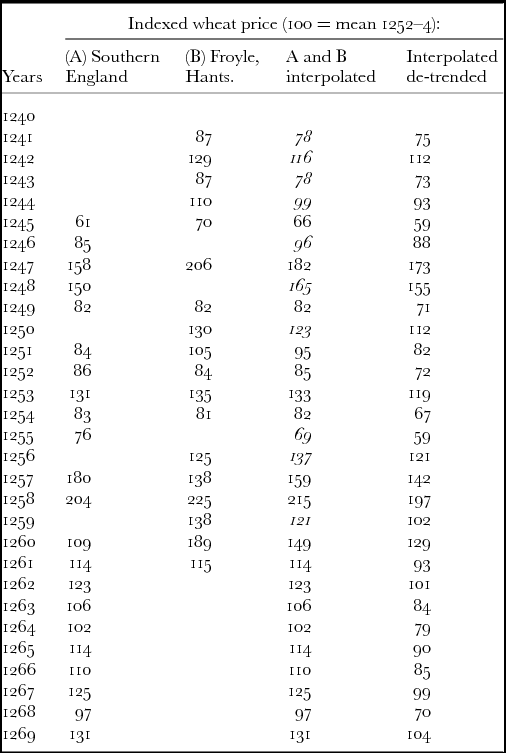
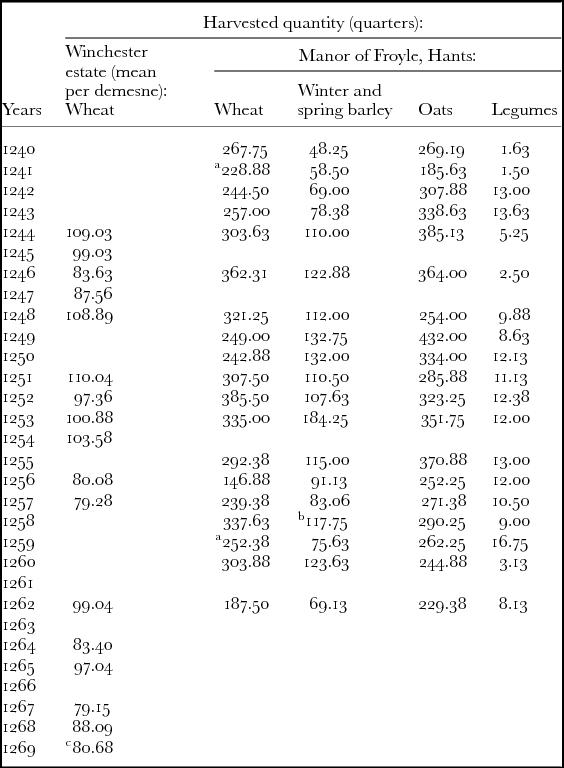
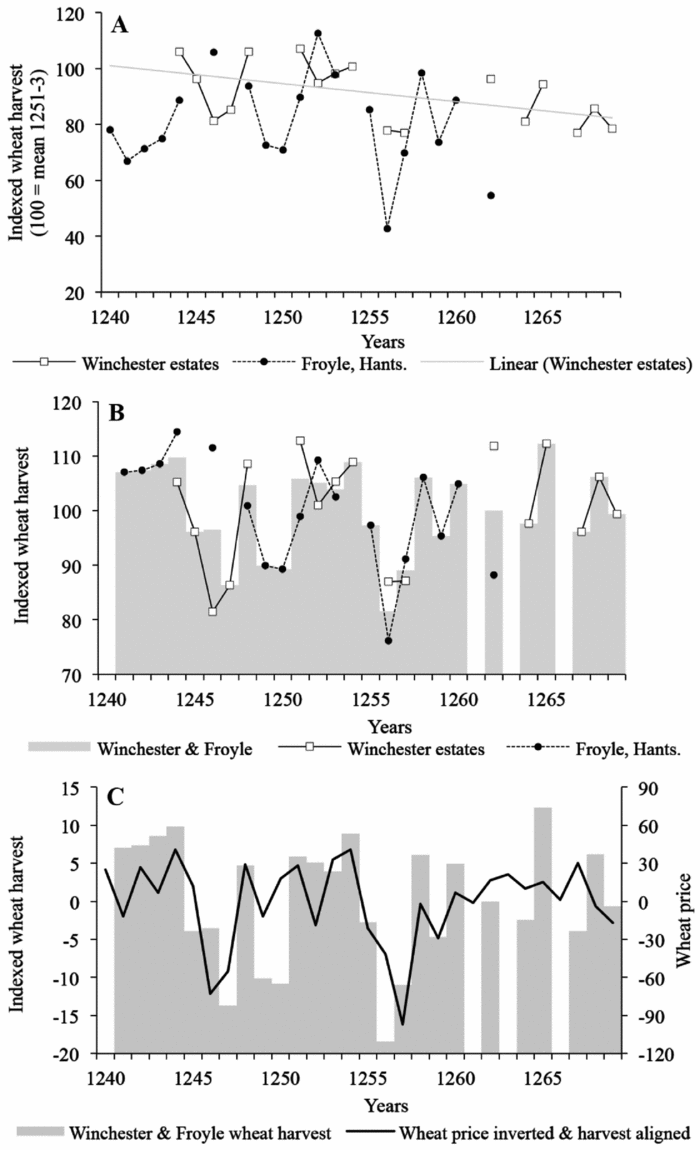
Direct evidence of the harvest shortfalls responsible for the food crisis of 1258 comes from recorded grain prices, principally wheat, and the harvest receipts of demesne producers. The prime extant sources for both are the celebrated Winchester Pipe Rolls, the manorial accounts of Froyle in north-east Hampshire (a property of St Mary's nunnery, Winchester) and a scatter of other early accounts.Footnote 24 The Froyle accounts are crucial to establishing what happened to prices (Table 1) and harvests (Table 2) from the 1240s through to the early 1260s because they alone provide almost uninterrupted annual coverage of this period. Harvest information is lacking solely for 1245, 1247, 1254 and 1261 (Table 2). Paul Harvey has deciphered the dating of these rolls, which are obscurely dated by year of abbess, and the chronologies of prices and harvests obtained from them correlate exactly with those obtained from the securely dated neighbouring estates of the bishops of Winchester (Figures 3 and 4A).Footnote 25
Southern English wheat prices 1241–69

Sources: Southern England: G. Clark, English Prices and Wages 1209–1914, Global Price and Income History Group (2009); Froyle, Hants.: British Library Additional Charters 17,459–78, 13,338–9; Hampshire Record Office, Winchester, 123M88W/1.
Quantities harvested on the Winchester estates and the manor of Froyle, Hampshire, 1240–69

Sources and notes:
a Includes small quantities of rye and maslin.
b Includes 28 quarters of dredge.
c 3 demesnes only (37 in all other years).
Winchester estates: Hampshire Record Office, Winchester (HRO), 97097 Titow Research Papers 97M97/B. Froyle, Hants.: British Library Additional Charters 17,459–78, 13,338–9; HRO 123M88W/1.
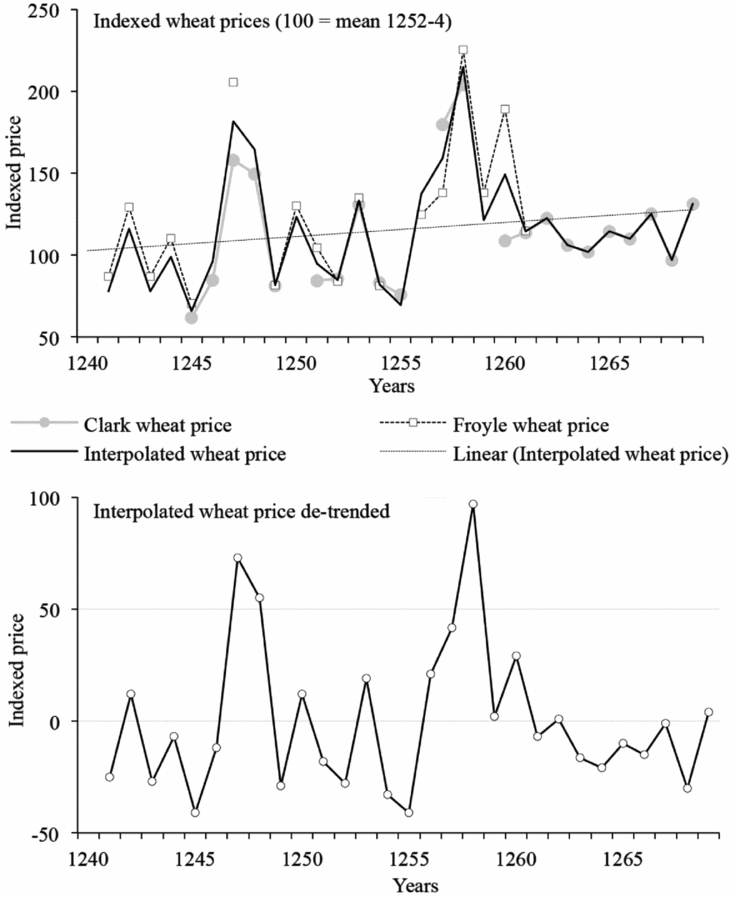
Indexed southern English wheat prices, 1241–69 (100 = mean 1252–4)

Wheat harvests on the Winchester estates and the manor of Froyle, Hampshire, 1240–69

The Winchester Pipe Rolls are far more voluminous, extending to enrolled accounts for upwards of three dozen manors in any given year. The bishops’ estates were spread across southern England, from Buckinghamshire to Somerset, but with a strong focus on Hampshire.Footnote 26 Relevant harvest information for all manors on the estate has been extracted by J. Z. Titow.Footnote 27 Unfortunately, the Pipe Rolls are less than continuous during the critical decades of the 1240s, 1250s and 1260s. In particular, there is no harvest information for 1250, 1255, 1258–61 – disappointingly – and 1263 (Table 2). The Froyle accounts are therefore invaluable for plugging these gaps, with 1261, 1263 and 1266 the only years lacking harvest information from either source (Table 2).
For the sale price of grain, there is no more abundant source of information during the thirteenth century than the Winchester Pipe Rolls, hence David Farmer drew extensively on this source for his reconstructed wheat-price series.Footnote 28 Farmer's price data have in turn been re-analysed by Gregory Clark and augmented with additional information from other sources to provide the master grain-price series running from 1209 to 1914 hosted on the Global Prices and Incomes website.Footnote 29 These are the prices tabulated in Table 1 and plotted in Figure 3A for the years 1240–69. Note the steady annual inflation rate of 1.7 per cent across this thirty-year period stoked by the expanding money supply. Annual price variations were, however, largely the result of fluctuations in harvest output, with prices in year x typically reflecting the harvest in year x-1. Although they do not measure output directly, prices have the great merit of reflecting supply conditions over an area far more extensive than a single manor. This means that wheat prices recorded in the Froyle accounts can be used to fill many of the gaps in Clark's master wheat-price series (Table 1 and Figure 3A). On the evidence of the wheat-price series interpolated from this raw information, prices were low in 1254 and 1255, rose steeply in 1256, rose again in 1257 and then soared in 1258 – the year of the national food crisis – before falling back in 1259. The next year, 1260, brought a rebound before prices finally subsided and stabilised.
Stripping out the effects of inflation brings these annual price fluctuations into sharper focus (Figure 3B). This identifies 1247 and 1248 as conspicuously high-price years, when prices were inflated by over 50 per cent, with the implication that harvests had been poor in 1246 and 1247. A run of otherwise low-price years followed, to which 1253 was the sole exception, culminating in 1254 and 1255 when, presumably because of bumper harvests, prices were 33 per cent and 41 per cent below trend. In 1256, 1257 and 1258, prices then rose progressively, until they were almost double their normal level. At the peak of this inflationary spike in June and July 1258, chroniclers reported that wheat was selling at 15 shillings a quarter in London and 20 shillings in Northampton.Footnote 30 This compares with an average sale price of a little over 3 shillings in 1254–5.Footnote 31 Prices fell back sharply in 1259, as the supply situation briefly improved, but then rose again with the return of grain shortage in 1260 to 29 per cent above trend. This was the last of five consecutive years when prices were consistently above normal. The price evidence implies that there were significant harvest shortfalls in 1255, 1256 and 1257, an adequate harvest in 1258 and then a final poor harvest in 1259. The food crisis of 1258 was therefore the product of a back-to-back supply-side failure during the previous two years.
Corroboration of this price chronology is provided by recorded harvested volumes on the thirty-seven demesnes of the Winchester estate and that at Froyle, as tabulated in Table 2 and plotted in Figure 4A. Note that on the Winchester estates annual variations were superimposed upon a downward output trend, as the bishops scaled down direct management on their demesnes from its peak in the 1230s.Footnote 32 Figure 4B therefore re-plots the same information de-trended. On the St Mary Abbey demesne at Froyle, in contrast, output rose steadily to a peak in the early 1250s, before contracting. In Figure 4B, therefore, this output information is re-plotted as a percentage of the mean of the previous seven years. Interpolation between these two de-trended series then gives a single indexed output series for the entire period 1240–69 with gaps only in 1261, 1263 and 1266 (Figures 4B and C).
On the Winchester estates, but not at Froyle, the poor harvests of 1246 and 1247 that preceded the high prices of 1247 and 1248 stand out clearly. The same applies to the dismal harvests of 1256 and 1257 responsible for the high prices of 1257 and 1258. In 1256 and 1257, wheat harvests on the Winchester estates were 22–3 per cent below the average of 1251–4, while at Froyle the harvest of 1256 was less than half that of 1250–3 and the 1257 harvest fell short by 25 per cent. These were very substantial shortfalls and, at Froyle, were compounded by oats harvests deficient by 22 per cent and 16 per cent, which must have hit the budgets and diets of the poor hard, since oats were a staple component of the bare-bones basket of consumables.Footnote 33 Thus far, the price and harvest information accord well. Prices imply that the 1258 harvest was not particularly defective, and that was certainly the case at Froyle although there is unfortunately no corresponding information for the Winchester estates. The one exception is Highclere, for which harvest information for 1258 and 1259 does survive, and in neither year was there a shortfall.Footnote 34 Complete Pipe Rolls are missing for 1258–61 but in 1262, when the next Pipe Roll survives, output of wheat across the estate was back to normal and the crisis had evidently passed.
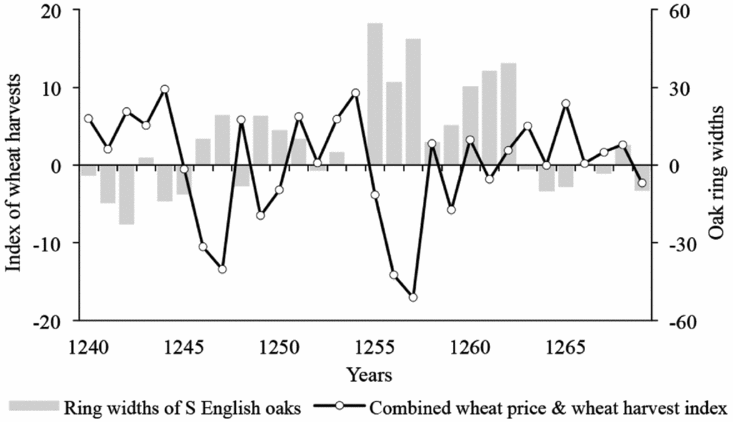
The available price and harvest information from southern England thus concur in identifying the 1256 and 1257 harvests as a major back-to-back failure, responsible for the acute scarcity and massively inflated food prices of 1258. This was the second and more serious of two back-to-back harvest shortfalls to have occurred within the space of a dozen years. Not until the early 1260s did grain output and prices return to their pre-crisis levels. The close fit between harvests and prices is readily apparent from Figure 4C, where wheat prices in year x + 1 have been inverted and moved back a year to align with the harvest information in year x. Combining these two time series maximises use of the available information and yields the index of wheat harvests plotted in Figure 5. The significant double shortfall of 1246–7 emerges clearly but is eclipsed by the greater reduction that evidently began in 1255 but was at its most pronounced in 1256–7. The 1259 harvest was also indifferent and it was not until 1262 and 1263 that output was restored to its former level.
Combined price and harvest index of wheat harvests and the ring widths of southern English oaks, 1240–69

Since the growing conditions that favoured oaks were more or less the opposite of those that suited grain (oaks thriving on cool and wet, and grain on hot and dry, summers), for comparison the ring widths of southern English oaks are also plotted in Figure 5.Footnote 35 The correlation between the two series is a strongly negative -0.59. Oaks put on wider than average growth rings in 1246 and 1247, which implies that the poor harvests of these two years were due to cool and wet summer (i.e. June, July and August) weather. Oaks then put on far wider rings in 1255–7 – some of the widest, in fact, on record – which indicates that abnormal weather conditions prevailed at that time, boosting oak growth but devastating grain crops. This wide-ring phenomenon also shows up in a master chronology of British Isles oaks and an oak chronology for northern France.Footnote 36 The following year proved to be as unexceptional for oaks as it was for grain, but from 1259 to 1262 oak growth increased again, at a time when grain was yielding indifferently, possibly due to the growth stimulus induced by additional diffuse radiation caused by lingering stratospheric volcanic aerosol clouds from the 1257 mega-eruption.Footnote 37 This sustained wide-ring episode then ended abruptly in 1263.
Taken together, the index of wheat harvests and chronology of oak ring widths indicate a major eight-year growth anomaly from 1255 to 1262, divided into two phases pivoting on 1258. The first, from 1255 to 1257, was the most pronounced and led to the food crisis of 1258. The second, following the 1257 mega-eruption, was more muted and lasted from 1259 to 1262. This bears out Derek Keene's observation that ‘the poor harvest of 1255 [sic] and even that of 1257 may have arisen from a “normal” pattern of bad weather and the successive atmospheric events of 1258–60 from a single eruption in 1257’.Footnote 38
II The chronology of the crisis: chronicles and climate reconstructions
Contemporary chroniclers had a good deal to say about the weather and abundance or otherwise of harvests during these years, and their qualitative observations can be matched against reconstructions of spring and early summer (March to July) precipitation (Figure 6A) and summer (June, July, August) temperatures (Figure 6B) derived from the precisely dated growth rings of trees.Footnote 39 Further amplification of this picture is provided by (i) an annually resolved multi-proxy reconstruction of the North Atlantic Oscillation, which determined pressure gradients and thereby drove winter circulation patterns over Europe, and (ii) a tree-ring-based annual reconstruction of summer (June/July/August) wetness/dryness across the Old World.Footnote 40 Matching these reconstructions against the comments of contemporary chroniclers is especially revealing, for the latter shed light on the timing of meteorological events and their effects on agricultural activities and give information about weather conditions during the winter months when trees were dormant.
Index of wheat harvests in southern England, March–July precipitation in southern England and East Anglia, the North Atlantic Oscillation and European summer (June, July, August) temperatures, 1240–69
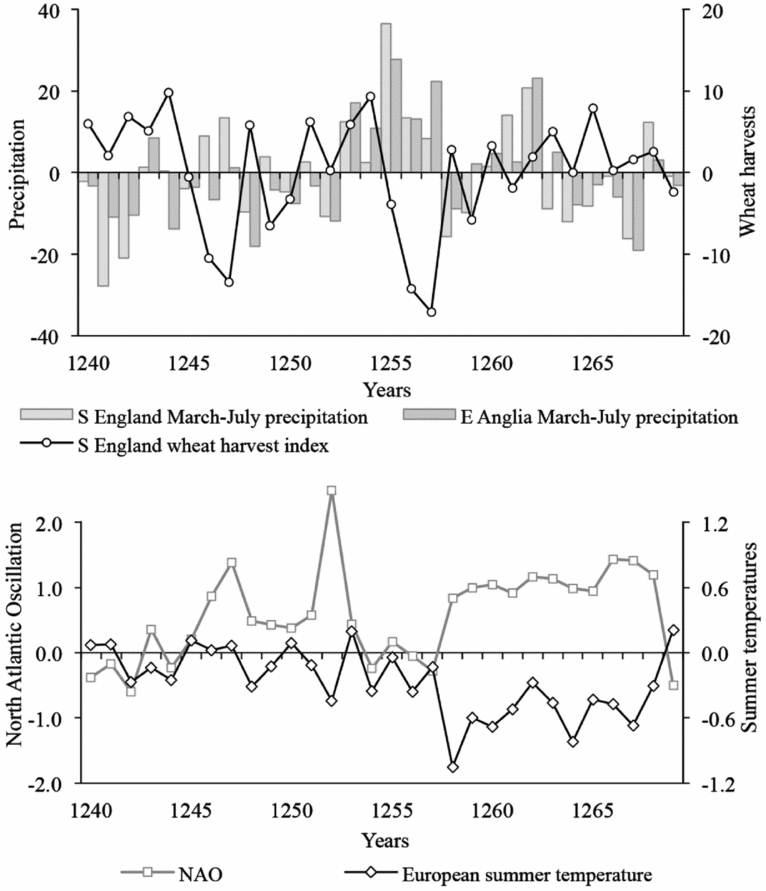
The thirteenth century has been described as ‘the golden age of the monastic historians’ and the available chronicle information is particularly rich for the eventful 1250s.Footnote 41 Care nevertheless needs to be exercised in distinguishing between first-hand observations and those reported at second hand and not always in the year in which they occurred. Dating can therefore be a problem. Of contemporary chroniclers, Matthew Paris, a monk at the Benedictine Abbey of St Alban's in Hertfordshire, twenty-five miles to the north of London, made a particular point of commenting upon weather conditions and unusual environmental events either during the course of the year or in his annual summary of each year's more notable events.Footnote 42 For example, over the course of 1251 he reports on serious sea flooding in Friesland, a terrible storm on St Dunstan's Day (19 May) at Windsor and St Alban's, extensive coastal flooding in England in September and then sums up the year as ‘stormy, turbulent, and awful, with lightning’ but also ‘productive of corn and fruit in sufficiency, even to abundance’, a verdict that is corroborated by the index of wheat harvests (Figure 6A).Footnote 43 Unfortunately, his unusually informative record of weather conditions ends prematurely with his death in 1259, at the very point when climatic fallout from the 1257 eruption of Samalas Volcano is an issue.
The sea flooding and turbulent weather of 1251 were precursors of worse to come the following year when, according to a recent multi-proxy reconstruction at annual resolution, the North Atlantic Oscillation was more strongly positive than at any time in the previous 200 years (Figure 6B). This accounts for the powerful south-westerly gales which Matthew Paris described ‘blowing with a dreadful roaring and with fierce violence’ at the start of the year. These gave way in March to four months of ‘intolerable heat and drought’ unrelieved by ‘any fall of rain or dew‘ that lasted until well into July. The Tewkesbury and Welsh annalists comment on the same phenomenon.Footnote 44 These contemporary descriptions are consistent with the below average rainfall registered by the tree-ring-based indexes of precipitation in southern England and East Anglia (Figure 6A) and corresponding reconstruction of drought conditions prevailing that summer right across Europe from Iberia and Ireland in the west to Romania in the east.Footnote 45 The upshot in England was an indifferent wheat harvest (Figure 6) and poor barley and oats harvests, which, on the testimony of the Dunstable annalist, gave rise the following year to ‘a dearth of corn in England’.Footnote 46 When rain finally came in September, it was incessant and was accompanied by a ‘deadly disease amongst the cattle’, which had gorged themselves on the sudden flush of grass growth.Footnote 47 Matthew Paris summed up the year as ‘one of trouble to the whole of mankind’ and in the palaeo-environmental record it stands out as a year of climate extremes right across the northern hemisphere. There is a clear implication that climate forcing of some sort was very strong at this time.
The next two years brought a significant amelioration of these conditions. The North Atlantic Oscillation weakened, spring and summer precipitation over southern England and a broad swathe of Europe returned to slightly above normal and the English wheat harvest was average or better (Figure 6A). Matthew Paris notes more heavy rain in 1253 and some serious river and sea flooding but not enough to prevent the year from delivering such an ‘abundance of corn and fruit, that the price of a measure of corn fell to thirty pence’.Footnote 48 Partly because the North Atlantic Oscillation had turned negative and anti-cyclonic conditions had set in, the winter of 1253–4 was long and hard and 1254 brought very unsettled weather, such that ‘from Ascension-day (25 May) till that of All Saints (1 November), scarcely two or three days passed undisturbed by some commotion of the elements’.Footnote 49 Yet, notwithstanding these unsettled conditions, Matthew Paris reported that ‘this year throughout was abundantly productive in fruit and corn, so that the price of a measure of corn fell to two shillings; and in like proportion oats, and all other kinds of corn and pulse fell in price, to the benefit of the poor’.Footnote 50 Prices remained low until well into the following year, making 1254 and 1255 two cheap years in a row and possibly lulling producers and consumers into a false sense of security (Figures 3A and 6A).
According to tree-ring-based climate reconstructions, the spring and early summer of 1255 proved to be exceptionally wet across southern England and East Anglia (Figure 6A), and June, July and August then brought heavy rain to Ireland, England and much of France.Footnote 51 Matthew Paris, in contrast, while confirming the general wetness of February and early March, dwells upon the persistent dry northerly winds that prevailed from the middle of March to the beginning of June, which dried up the atmosphere and lent it a citron-like hue.Footnote 52 Timely rain then rescued the situation and produced a good harvest.Footnote 53 Provisions therefore continued cheap, although at Froyle, possibly because of the summer rain, less wheat was harvested than in previous years (Figure 4). In contrast, growing conditions proved ideal for southern English oaks, which put on some of the widest growth rings on record (Figure 5).
Rainfall then remained well above average for the next two years. Oaks continued to grow vigorously in 1256 and 1257 (Figure 5), precipitation levels across southern England and East Anglia as reconstructed remained elevated (Figure 6A), and in 1256 much of Europe experienced another unusually wet summer.Footnote 54 In June, following a succession of storms, the River Ouse burst its banks and swept away houses at Bedford and the year ended with torrential rain and serious flooding in the north of England, where houses, mills and seven bridges were destroyed.Footnote 55 Matthew Paris leaves no doubt that in 1256 the weather had taken a turn for the worse. He reports that ‘from the day of the Assumption of the Blessed Virgin [15 August] to the anniversary of her Purification [2 February], the rain ceased not to fall daily in deluges, which rendered the roads impassable and the fields barren’.Footnote 56 His observation that by ‘the end of harvest the corn was rotted in the ear’ is borne out by a slump in the amounts of wheat harvested on the Winchester estates and at Froyle and a sharp rise in the prices of staple foodstuffs (Figures 3 and 4B).Footnote 57 This would prove to be the first of two consecutive bad harvests.
The following winter was mild but overcast without a single frosty or fine day and the ensuing year ‘beyond measure stormy and rainy’.Footnote 58 The continuing inclement weather hit the winter-sown crops especially hard:
from the first day of February up to. . .the beginning of May the air was disturbed by storms of wind and rain, which rendered England like a muddy marsh. The furrows bore the appearance of ditches; the ditches were like marshes; and the rivers seemed to be arms of the sea. Thus a period of three months rendered the earth barren and fruitless, so that many farmers sowed fresh seed in their land.Footnote 59
It is therefore no surprise that 1257 delivered another deficient wheat harvest (Figure 4B), but this was then compounded by renewed heavy rain at harvest time, which threatened as well the yields of spring-sown oats and barley.Footnote 60 East Anglian chroniclers John of Oxnead and John de Taxter both mention that heavy rain in mid-July flooded land, bore away bridges, houses and mills, rendered roads impassable, ruined the hay meadows and destroyed crops.Footnote 61 Fear of a second harvest failure prompted fasting, prayer and religious processions but these pious acts proved incapable of converting scarcity into abundance.Footnote 62 The upshot was that ‘whatever had been sown in winter, had budded in spring, and grown ripe in summer, was stifled and destroyed by the autumnal inundations’.Footnote 63
By autumn 1257, the damage had been done, the grain harvest had fallen seriously short for two years in succession and the next year, 1258, bar large-scale food imports, an escalating national food crisis was unavoidable. Grain already scarce and dear had become scarcer and dearer. By the year's close, wheat had risen sharply in price to 10 shillings a quarter, fruit was scarce, ‘land lay uncultivated’ and ‘great numbers of people’ were dying from ‘starvation’.Footnote 64 This, of course, had been the year when, sometime in late spring or summer (and certainly no earlier than May), the Samalas Volcano erupted in Indonesia but as far as the English wheat harvest was concerned, the disaster had already been set in train by the floods and inundations of the previous winter.Footnote 65 The one hint that by the end of the year England may have been experiencing fallout from a major stratospheric sulphate injection is Matthew Paris's mention that chronic breathing difficulties were troubling numbers of people.Footnote 66 Climate reconstructions nevertheless demonstrate that there was a lag of approximately a year before the eruption's main forcing effects were felt (Figure 2). These show up in a sudden drop in European summer temperatures and marked strengthening of the North Atlantic Oscillation in 1258 (Figure 6B). As Matthew Paris cryptically observed, ‘this year throughout was very dissimilar to all previous ones, bringing disease and death, and heavy storms of wind and rain’.Footnote 67 The unusual weather and atmospheric conditions provided the context rather than the cause of both the food crisis and the political row between Henry III and his barons which separately now came to a head.
III The chronology of the crisis: the crisis breaks
Details of the human tragedy that began in 1257 and then became greatly magnified over the course of the following year are given in most of the English chronicles. John de Taxter, the Bury St Edmund's annalist, makes the key point that ‘there was a great shortage of everything because of the floods of the previous year [emphasis added]’.Footnote 68 After two deficient harvests, the inflated price of staple foodstuffs provoked considerable comment, with wheat, which as recently as 1254 had sold for as little as 2 shillings, costing at its peak as much as 15–20 shillings a quarter.Footnote 69 Unable to afford grain, those on the lowest incomes desperately made shift with such alternative foodstuffs as ‘horsemeat, the bark of trees and even more unpleasant things’.Footnote 70 The Tewkesbury and London chroniclers plus Matthew Paris, Matthew of Westminster and John de Taxter all concur that it was the poor who bore the brunt of the crisis and succumbed in greatest numbers to starvation and famine-related diseases.Footnote 71 To add to their misery, after an unusually mild start to the winter, from February a bitter northerly wind ‘blew without intermission, a continued frost prevailed, accompanied by snow and such unendurable cold, that it bound up the face of the earth, sorely afflicted the poor, suspended all cultivation, and killed. . .the ewes and lambs’.Footnote 72 Harsh weather continued through to June and then in July was followed by heavy rain, which, by delaying and damaging the next harvest, both heightened and prolonged the food crisis, prompting further religious processions and prayers for deliverance from the persistent bad weather and accompanying state of famine.Footnote 73 To contemporaries, it must have looked as if harvests were about to fail for the third consecutive year.
For those bereft of material support, confronted by destitution and driven by hunger, London, with the greatest concentrations of wealth and charitable institutions in the realm, was a magnet, especially once it became known that in March the city had taken delivery of fifty shiploads of relief food supplies from Germany.Footnote 74 The city, however, lacked the welfare and financial resources necessary to cope with the influx of famine refugees.Footnote 75 As the Chronicles of the Mayors and Sheriffs of London reported, ‘the people from the villages resorted to the City for food; and there, upon the famine waxing still greater, many thousand persons perished’.Footnote 76 By May 1258, when the crisis was approaching its peak, Matthew Paris put the number of dead at 15,000 and later the Tewkesbury annalist cites a death toll of 20,000, a majority of them, presumably, non-Londoners.Footnote 77 The metropolis, in effect, was drawing to itself the excess mortality of its hungry hinterland. The scenes which there resulted were harrowing and anticipated those in 1943 in Bengal which inspired Amartya Sen's analysis of famine as an entitlements failure, whereby those who starved and died had in one way or another forfeited their economic entitlement to food.Footnote 78 Matthew Paris describes how the bodies of those who perished ‘were found in all directions, swollen and livid through hunger, lying by fives and sixes in pigsties, on dunghills, and in the muddy streets, their bodies woefully and mortally wasted’.Footnote 79 The city authorities gathered up their corpses and gave them Christian burial, often in mass graves dug for the purpose, in the city's cemeteries.
The graveyard of the hospital of St Mary Spital, located on the north-east outskirts of the city, was one such repository. Here, a major excavation by Museum of London Archaeology, directed between November 1988 and August 2001 by Christopher Thomas, revealed what are very likely some of these 1258 mass graves. Of 10,516 skeletons excavated, over half of those carbon14-dated to the thirteenth century were interred in mass graves of eight or more individuals. The earliest of these mass graves, dug before c. 1250, typically contained eight to twenty bodies. Subsequent graves, dug after a short interval and sometimes inter-cutting the earlier pits, were larger and contained from twenty to forty bodies in stacked layers. Both sets of pits have been dated to c. 1235–55 and together they contained c. 2,300 of the skeletons that were analysed. The earlier mass burials have been attributed to the drought-induced dearth of 1252/3, although the subsistence crisis of 1247–8 seems a more likely cause, and the later and larger number of burials to the more serious food crisis of 1257–8, as is consistent with the description provided by Matthew Paris.Footnote 80
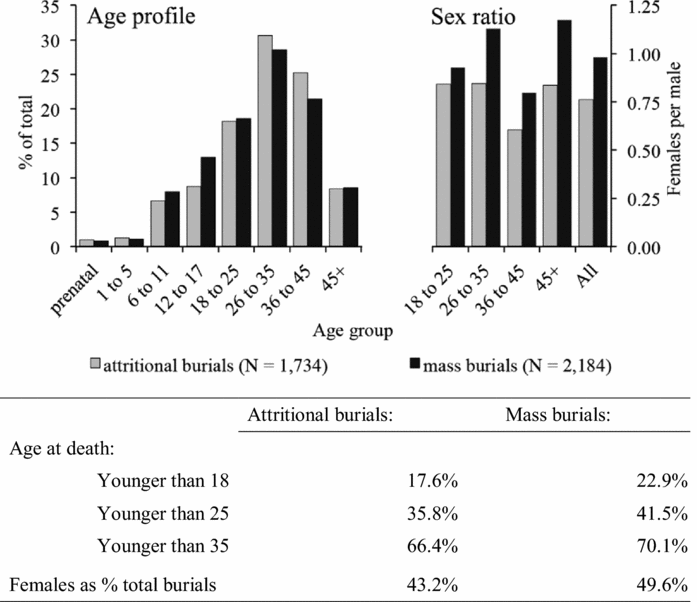
The age and sex profiles of those interred in these mass graves, compared with those given more individual (i.e. attritional) burials, reveal much about the demographically selective nature of this crisis (Figure 7). The nature and location of St Mary Spital as an institution meant that even at the best of times its graveyard was the repository of those who were socially marginalised and economically disadvantaged and whose health, stature and life expectancy were diminished by poor nutrition, hard physical toil and unhealthy living and working environments.Footnote 81 At normal times, two-thirds of those whose skeletons can be allocated an age were younger than thirty-five at death and more than a third were younger than twenty-five, with females accounting for 43 per cent of adults whose bodies can be sexed. During the crisis years that gave rise to the mass burials, the bias towards younger adults became more pronounced, with the proportion younger than twenty-five rising from 36 per cent to 42 per cent and of those younger than thirty-five from 66 per cent to 70 per cent. Among adults, the proportion of females also rose, to half, reflecting the fact that single women were economically more deprived and vulnerable than almost any other demographic group other than orphaned children.Footnote 82 Some of the individuals buried in these mass graves may have expired while seeking succour from the hospital; most, however, as Matthew Paris, describes, had suffered forlorn deaths in the back lanes and alleys of the city.Footnote 83 Parentless, landless, jobless, single and/or female, they lacked the family support and economic resources required to survive the food crisis and as such exemplify the socially and demographically selective nature of all famine mortality.Footnote 84
Age and sex profiles of those buried at St Mary Spital, London, 1200–1400

IV A global catastrophe?
Was a tropical mega-eruption ultimately responsible for the food crisis in England? In 2011, Keene speculated that ‘the crisis of 1258 appears to have arisen from a worldwide climatic disaster, caused by the effects of an immense volcanic explosion’, and on 6 August 2012, the Museum of London Archaeologists responsible for the St Mary Spital excavation issued a press release claiming that a ‘cataclysmic volcano wreaked havoc on medieval Britain’, a claim taken up and repeated in the press.Footnote 85 At the time, there was intense scientific interest in the identity of a mystery eruption responsible for ‘the largest sulfur signature of any eruption in the Holocene’ in both the Greenland and Antarctic ice cores and dated to c. 1258.Footnote 86 Given that sulphate was deposited at both poles (Figure 9), an equatorial source was suspected, probably somewhere in the Pacific Ring of Fire.Footnote 87 It took until 2013, however, before a French-led international team was convincingly able to demonstrate that the culprit was Samalas Volcano, Indonesia, a mere 170 kilometres west of Tambora.Footnote 88 Frank Lavigne and his team estimate that the eruption had a VEI of at least 7. Such was its explosive force that its eruption column reached an altitude of up to 43 kilometres and at least 40 cubic kilometres (dense-rock equivalent) of tephra were ejected. Crucially, the glass geochemistry of the associated pumice deposits closely matches that found in both the Greenland and Antarctic ice cores and provisionally dated to 1258/9 ce. Radiocarbon dates of tree trunks carbonised by the eruption are also consistent with a mid-thirteenth-century date of c. 1257. Further confirmation that the eruption occurred sometime between May 1257 and November 1258 is provided by the dark total lunar eclipse reported at Genoa on 12 November 1258, with the balance of palaeo-environmental evidence favouring 1257 over 1258.Footnote 89 Of course, once the volcano exploded some weeks and probably months will then have elapsed before fallout from it began to affect the weather almost 60° of latitude to the north and 12,600 kilometres to the north-west over England.
The analogue mega-eruption for which good scientific observations are available is that of Mount Pinatubo in the Philippines on 15 June 1991.Footnote 90 It was smaller, with a VEI of 6.1, and released 18 megatonnes of sulphur dioxide into the upper atmosphere. Within twenty-two days, its volcanic dust cloud had encircled the globe and spectacular solar, lunar and other optical effects resulted. In due course, the screening out of solar radiation lowered global temperatures by 0.5° centigrade. The implication is that a similar dust veil must have been created following the VEI7 Samalas eruption in May, June or July 1257 with corresponding optical and climatic effects. Some scientists, most notably Michael E. Mann, impressed by the unparalleled size of the polar sulphate deposits, have inferred that subsequent forcing of global climates must have been on an almost unparalleled scale, resulting in climate cooling of about 2° centigrade.Footnote 91 This, however, is at variance with tree-ring-based reconstructions of the eruption's temperature effects, which imply that the volume of sulphate ejected by the eruption was disproportionate to its more modest climate impact.Footnote 92
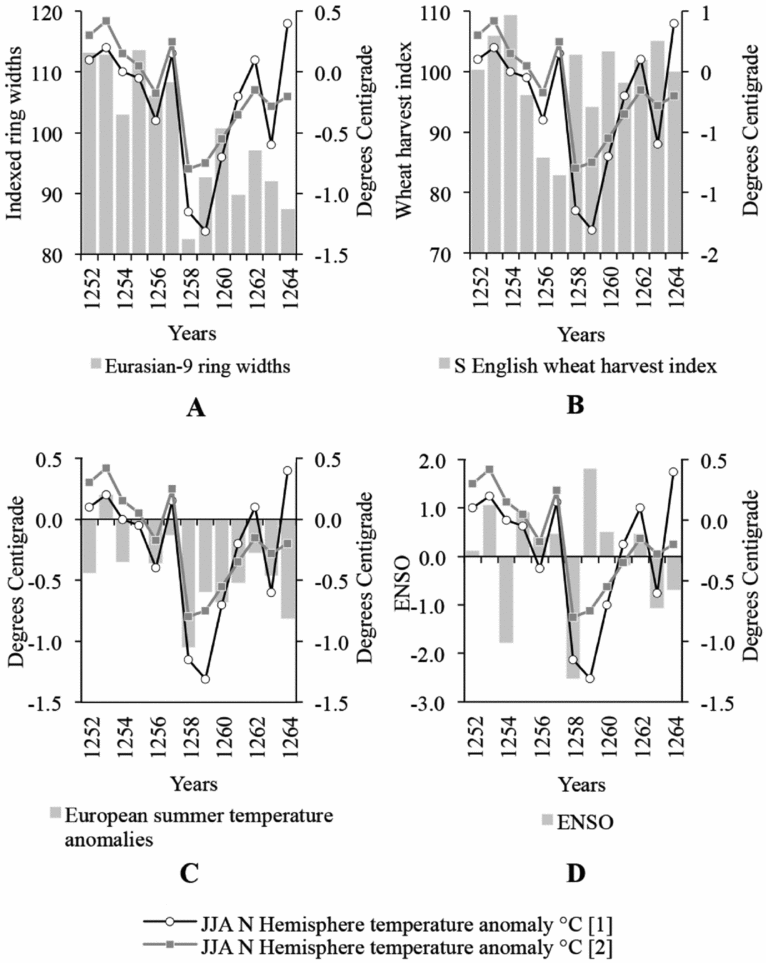
Most recently, a sub-set of the Lavigne team, led by Markus Stoffel, has demonstrated that maximum cooling of global temperatures typically occurs in the first and second years following an eruption, with the precise scale of that impact depending upon the season of the eruption, the injection height of the sulphate plume, the mass of sulphur dioxide (SO2) released and the size of the ejected aerosol particles. Taking these factors into account, they argue that although the Samalas eruption was a major climatic event, with optical effects visible around the world soon afterwards and significant physical effects then felt in 1258 and 1259 and for sometime thereafter, the eruptions of Ilopango (El Salvador) in c. 535, Kuwae (Vanuatu) in c. 1453, Huaynaputina (Peru) on 19 February 1600, Mount Parker (Philippines) in c. 1641, Laki (Iceland) in June 1783 and Tambora (Indonesia) on 10 April 1815 all had greater negative forcing effects upon global temperatures.Footnote 93 Yet, although the Samalas eruption's impact on climate was smaller than once thought, it nonetheless was globally significant. It had an immediate negative effect upon temperate tree growth across Eurasia, European summer temperatures and the El Niño Southern Oscillation, and a positive effect upon the North Atlantic Oscillation (Figures 6 and 8). Six years after the eruption northern hemisphere temperatures had still not fully recovered.
The 1257 Samalas eruption and reconstructed northern hemisphere temperatures, 1252–64, and (A) ring widths of Eurasian trees, (B) southern English wheat harvests, (C) European summer temperatures and (D) the El Niño Southern Oscillation.

Chronologically, however, the eruption occurred too late to account for the bad weather that ruined the southern English grain harvests in both 1256 and 1257 (Figure 8). Instead, by depressing temperatures and greatly delaying the harvest in 1258, it compounded and prolonged the hardship arising from the earlier back-to-back shortfall.Footnote 94 It was the sting in the tail of a food crisis which had arisen from other causes. In that respect, the population was doubly unlucky. It could, however, have been worse. Had volcanic forcing caused harvests to fail for the third year running, the situation in 1259 would have been perilous in the extreme. Instead, ongoing distortion of normal weather patterns meant that agricultural producers were hampered in their efforts to restore output to pre-1255 levels. Scarcity and high prices returned in 1260, leading to bans on the shipping of grain from the ports of East Anglia and the south-east, except to London, and in June causing the eyre to be prorogued until after the harvest.Footnote 95 Not until 1261 did wheat prices settle back at a level close to normal (Figure 3A), signalling that the food crisis was effectively at an end. As the Oseney Abbey annalist laconically reported, ‘the fruits of the earth ended the famine which had prevailed in England for the last several years’.Footnote 96 It had been a crisis of almost Biblical duration.
If eruption of the Samalas Volcano in spring or early summer of 1257 was not responsible for the initial harvest failures that precipitated the food crisis, what was? Or was the unseasonably wet weather that began in late 1255 and extended through 1256 and 1257 merely a random occurrence? In fact, the run of unusual weather had begun even earlier, with the wet weather that boosted oak growth and depressed grain yields in 1246–7 (Figure 6) and, more particularly, the ‘intolerable heat and drought’ of spring and early summer 1252, of which Matthew Paris and the Tewkesbury and Welsh chroniclers make such explicit report. Significantly, these twin setbacks occurred at the culmination of an exceptional period of 200 years of sustained high solar irradiance, which peaked in the late 1240s at levels unparalleled since the opening of the fourth century ce and not since equalled (Figure 9). Evidently, the problematic weather experienced by England in the late 1240s and early 1250s coincided with strong solar forcing of the global climate system. At that time, La Niña conditions predominated in the Pacific, the Pacific-west of the Americas was in the grip of mega-drought, the Asian monsoon was at near maximum strength and the North Atlantic Oscillation was strongly positive.Footnote 97 It was as these extreme conditions eased abruptly in the mid-1250s that the unstable and unseasonable weather set in over Europe and England that is chronicled by Matthew Paris and his contemporaries, documented by recorded wheat prices and harvests and enshrined in the growth rings of oak trees (Figures 3–5).
Total solar irradiance and volcanic sulphate deposits in the Greenland (northern hemisphere) and Antarctic (southern hemisphere) ice cores, 1000–1899 ce

Dramatic explosion of the Samalas Volcano occurred in the immediate aftermath of this strong solar-generated global climate perturbation, and that VEI7 eruption's spectacular sulphate signature has diverted scientific attention from the climatic context within which it occurred and caused other potentially important climatic developments to be overlooked. The power of the countervailing solar forcing is one reason why negative volcanic forcing of global and hemispherical temperatures was not greater, in contrast to the eruptions of Kuwae in the 1450s and Tambora in 1815 whose effects were probably amplified by their concurrence, respectively, with the Spörer and Dalton solar minima (Figure 9).Footnote 98 In fact, Samalas erupted just after output of solar irradiance began to decline and it was this double development which shaped the weather patterns that first created and then prolonged the 1258 English food crisis and transformed it from a three-year to a seven-year phenomenon.Footnote 99 For those caught up in the unfolding scenario, this was no ordinary run of bad weather, for unbeknown to them the effects of the climate perturbation were felt around the globe. Confronted by powerful environmental forces far beyond their comprehension, they prayed for divine intervention to halt the rain and save the harvest.
V Hunger and high politics in spring/summer 1258
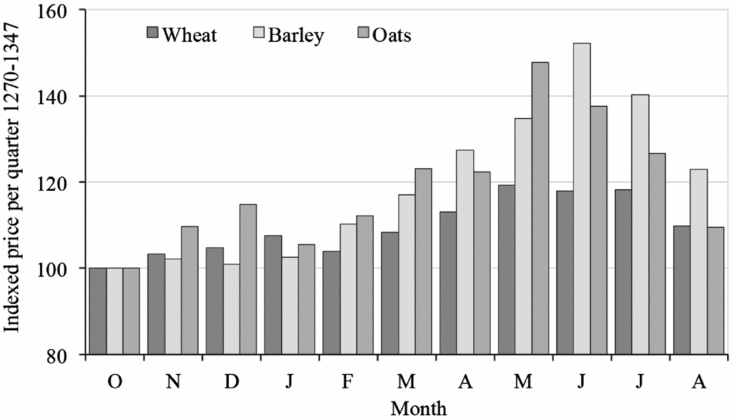
Meanwhile, a quite different and wholly independent set of forces was brewing up a political storm in England. In spring and summer of 1258, as the food crisis came to a head and the weather turned first cold and then wet, the tragedy engulfing the poor provided the context for eruption of the long-impending power struggle between Henry III and his magnates. At issue were dissatisfaction with the king's personal rule, favouritism towards his half-brothers, the Poitevins, and the cost of his misguided enterprise at the initiative of the pope to secure the kingdom of Sicily to his younger son, Edmund Crouchback.Footnote 100 Open political conflict between the king and his barons ignited in March when Pope Alexander IV's envoy delivered a fresh ultimatum respecting the financial and military obligations entered into by the king respecting the crown of Sicily. This placed Henry in dire financial difficulty from which only the grant of an aid by his magnates could rescue him. Given the immiserated state of the country, with food scarce and prices rising steeply (Figure 10), the timing of this request could hardly have been less propitious. At the end of April, the barons responded and presented their own demands to the king, who had little choice but to acquiesce. In early May, as the food crisis grew steadily worse and with little respite in the bitter weather, Henry III granted significant political concessions and in return the barons reluctantly agreed to expedite the grant of an aid. On 10 and 11 June, parliament, meeting in Oxford, ratified the reforms, which required the king to rule with a council of twenty-four appointed in part by the barons. Henry's personal rule was ended and the hated Poitevins were expelled. Finally, on 23 July, the City of London – swamped with starving famine refugees and with heavy rain making a grim situation worse – signed up to the agreed political reforms.Footnote 101
Mean monthly prices of wheat, barley and oats, 1270–1347

In one important respect, the unfolding political crisis helped relieve the food crisis. In March 1258, to ease mounting pressure on his beleaguered half-brother, Henry III, and relieve the provisioning situation in the capital, Richard of Cornwall, newly elected king of the Germans, sent fifty shiploads of food aid to London. As Matthew Paris recorded, ‘any three counties of England united had not produced so much corn as was brought by these vessels; but. . .although it in some slight degree mitigated the effects of the famine, which was general throughout England, it did not entirely do away with them’.Footnote 102 In fact, the arrival of food aid proved double-edged, since it attracted further migration by famine-stricken refugees to London and thereby magnified the problems of public order, health and disposal of the dead faced by the metropolis. Overwhelmed by these challenges and distracted by fast-moving political events, London's own administration proved impotent and neglected even to enforce the assize of bread, as would normally have been the case at a time of soaring grain prices.Footnote 103
Conceivably, reluctance to tax a famine-stricken countryside may have stoked baronial resistance to the king's frantic requests for an aid to help buy off the papacy. Certainly, those attending parliament in Oxford in early June, when food prices very likely reached their absolute peak (Figure 10), can have had no illusions about the scarcity and costs of provisions. Moreover, Oxford, with parliament sitting and many great men and their retinues in attendance, must also have been inundated by a flood of hungry vagrants. Yet, although the hardship endured by many of the common people will have been plain for all to see, the government, locked in constitutional conflict, was in no position to relieve the food crisis even if it had been inclined so to do.Footnote 104 The unfolding political drama claimed everyone's attention, with chroniclers, including Matthew Paris, increasingly devoting far more space to it than either the adverse weather or the desperate plight of the poor. Eventually, as the food crisis eased, interest in it appears to have lapsed altogether with the result that there is a significant falling off in the amount and quality of annalistic information about the weather, harvests and prices. Concern and compassion for those facing starvation had evidently worn thin. In contrast, the baronial reform movement escalated into civil war and many dramatic reversals of fortune ensued before Simon de Montfort and the baronial cause that he led were routed at the Battle of Evesham on 4 August 1265. That reform movement, its flawed leader and his eventual defeat have fascinated historians ever since, to the neglect, until recently, of the concurrent food crisis and the exceptional environmental events responsible for the precipitating harvest failures.Footnote 105 This is unfortunate, for climate change, extreme weather, food crises, hunger and the plight of the poor are subjects no less worthy of scholarly attention.Footnote 106 After all, they are issues that still confront us today.Footnote 107