Introduction and background
Fiscal policy has significant effects on social policy since it affects the economic and social dimensions of welfare and sustainability. Many strands of literature study the impact of taxation and direct spending on the behaviour of economic agents with a particular focus on social policy. Tax incidence literature is a case in point. The extent to which the final tax burden is shifted to different taxpayers has a direct distributional impact, and thus significant repercussions for social policy. At the same time, the role of different transfer programs in protecting vulnerable households, including those in the informal sector and poorer regions during economic crises has recently re-gained interest in the wake of the COVID-19 pandemic as well as the energy crisis triggered by the Russian-Ukraine war (Gentilini, Reference Gentilini2022; Hemmerlé et al., Reference Hemmerlé, Castle, Sarcina, Sunel, d’Arcangelo, Kruse, Haugh, Pina and Pisu2023; Béland et al., Reference Béland, Cantillon, Greve, Hick and Moreira2024).
Yet, whereas a myriad of actors scrutinise taxation as well as direct spending, a key feature of fiscal policy – tax expenditures (TEs) – has only partially hit the radar screens in the social policy literature. TEs are benefits granted through preferential tax treatment that lower governments’ revenues as well as the tax liability of the beneficiary taxpayer.
The TE concept was introduced by Surrey in the 1960s, who highlighted the fact that government support for specific groups or activities is often granted through tax privileges on top of direct spending. In 1973, Surrey made the case for cutting the use of TEs in his book titled Pathways to Tax Reform (Surrey, Reference Surrey1973). A year later, the US Budget Reform Act provided a formal definition of TEs as ‘those revenue losses attributable to provisions of the Federal tax laws which allow a special exclusion, exemption, or deduction from gross income or which provide a special credit, a preferential rate of tax, or a deferral of tax liability…’ (Surrey and McDaniel, Reference Surrey and McDaniel1979: 231). OECD (2010) is one the first studies providing a detailed analysis of TEs across countries although, probably because of the striking lack of TE data at that time, the book only focused on ten OECD economies.
Nowadays, TEs are used widely by governments across the world to pursue different public policy goals, including boosting innovation and research and development (R&D), job creation, and greening the economy. They are also used widely for social purposes, e.g. to mitigate inequality, to promote saving for retirement and tackle poverty. Yet, besides their stated goals, which are often aligned with a sustainability agenda, TEs are often opaque and costly and, when ill-designed, they can also be highly ineffective, and trigger undesired effects or externalities.
According to the Global Tax Expenditures Dataset (GTED), the global average revenue forgone stemming for the use of TEs has remained stable over the last thirty years, at around 4 per cent of GDP and slightly below one quarter of tax revenue (von Haldenwang et al., Reference von Haldenwang, Redonda and Aliu2023). Nonetheless, there is a lot of variation between countries on the reported size of TEs. On average, low-income countries (LICs) forgo just above 2 per cent of GDP in tax revenue through TEs, while for high-income countries (HICs), this figure is close to 5 per cent. In some countries such as Czechia, Finland, Jordan, Puerto Rico, the Netherlands and Russia, revenue forgone as a share of GDP can be as high as 9 or even 15 per cent.
The number of countries reporting on TEs has been increasing steadily over time, from 5 countries in the early 1990s to 105 in 2022.Footnote 1 All this said, the overall opacity in the TE field is still striking, with more than 50 per cent of all countries still classified as non-reporting, i.e. they have never released an official TE report since 1990, the first year for which the GTED gathers data. This said, the lack of transparency goes beyond the large number of non-reporting countries. The recently launched Global Tax Expenditures Transparency Index (GTETI) is the first comparative assessment of TE reporting, covering countries worldwide and providing a systematic framework to rank countries according to the regularity, quality, and scope of their TE reports (Redonda et al., Reference Redonda, Millan, von Haldenwang and Aliu2023a). The first version of the GTETI shows that the lack of transparency in TE reporting is a major issue in all assessed countries. The average overall GTETI score obtained by the 104 assessed countries stands at a forty seven point four three out of a maximum possible of 100 points (where 100 equals full transparency). Whereas no country scores twenty or lower, even the best performing countries score below seventy five points (von Haldenwang et al., Reference von Haldenwang, Redonda and Aliu2023).
The opacity in the TE field not only hinders transparency and accountability but also makes evidence-based tax policy making very difficult . A recent International Monetary Fund (IMF) Staff Discussion Note shows that, on average, LICs can raise their tax-to-GDP ratio by 6.7 percentage points by reforming their tax policies, given current institutions and economic structures. According to the authors, TE reform should be at the heart of the needed policy changes as “this revenue increase requires strengthening the design of core taxes—VAT (Value Added Tax) and excises and personal and corporate income taxes. The focus should be on tax base broadening through reforming ineffective tax expenditures, more neutral taxation of capital income, and better use of real property taxes—thus accounting for both efficiency and equity considerations (Benitez et al., Reference Benitez, Mansour, Pecho and Vellutini2023).
In addition, besides the mechanical effect that reforming TE regimes can have on tax-to-GDP ratios, assessing the effectiveness of TEs can significantly contribute to better aligning TE regimes with governments’ growth and development strategies. The case of social tax expenditures (STEs) – social spending delivered through the tax system – is a case in point. The relationship and interaction between TEs and social policy has been studied by a number of scholars. Titmuss introduced the concept of Fiscal Welfare back in the 1950s (Titmuss, Reference Titmuss1958). As discussed by Sinfield, the TE concept introduced by Surrey is somehow broader than the fiscal welfare one introduced by Titmuss since the latter used ‘fiscal welfare’ in the context of the debate about redistribution and the welfare state, while Surrey’s TE concept included industrial and other TEs as well as welfare ones (see, for example, Sinfield Reference Sinfield and Powell2007 and Reference Sinfield, Lymer, May and sinfield2023). Several authors took this up during the 1990s and produced relevant analyses of TEs for social purposes. Howard’s seminal book provides a deep discussion focusing ‘… on the American welfare state by examining a powerful but poorly understood tool of social policy: tax expenditures’ (Howard, Reference Howard1997, p 3). Mitchell was among the first scholars to use microdata to compare income transfers (including both social security transfers as well as income taxes) across countries. She used these data to compare Australia and a group of nine selected countries finding both similarities but also differences in terms of the implemented policies and outcomes across countries (Mitchell, Reference Mitchell1990). Greve (Reference Greve1994) provides a cross-country comparative analysis of the use of TEs within social policy, and warns against the potential regressive or upside-down effect of TEs, i.e. highest income earners benefitting most from TE provisions. Yet, to the best of our knowledge, the first author to explicitly use the ‘Social Tax Expenditure’ concept was Toder. In his 1998 paper, the author assesses the evolution in the composition of TEs over the 1980–1999 period, and finds that whereas STEs have increased as a share of GDP, business-related TEs (tax benefits to promote investment or to assist selected industries) declined (Toder, Reference Toder1998). Spies-Butcher and Stebbing (Reference Spies-Butcher and Stebbing2010) discusses the rise of the use of STEs in the context of the Australian welfare state, and explores a number of potential drivers behind this evolution; including fiscal austerity, the privatisation agenda of neo-liberalism and the rise of ‘aspirational’ politics. STEs keep being studied based on country-specific cases (see, for example, Collins and Hughes (Reference Collins and Hughes2017) on Ireland, Morel et al., (Reference Morel, Touzet and Zemmour2019) on France, Sinfield (Reference Sinfield, Lymer, May and sinfield2023) on the UK, and Ellis and Faricy (Reference Ellis and Faricy2021) on the US) as well as to provide a cross-country perspective (Avram, (Reference Avram2017), Morel et al., (Reference Morel, Touzet and Zemmour2018) and Barrios et al., (Reference Barrios, Coda Moscarola, Figari, Gandullia and Riscado2020)).
Whereas the STE concept has been re-gaining interest, the empirical literature assessing the effectiveness of specific STEs is significantly more limited. The US Earned Income Tax Credit (EITC), which has been vastly researched, is a notable exception. The EITC, a refundable tax credit that requires that recipients are employed, is one of the largest TEs in the US and has been proven to be an effective policy to support low-earning households at relatively low cost (Bastian and Jones, Reference Bastian and Jones2018). Interestingly, whereas its refundability component makes it, up to a certain extent, akin to a direct expenditure provision; it is also one the key drivers of its effectiveness in supporting low-earning households (Prasad, Reference Prasad2011).Footnote 2 At the same time, the EITC triggers positive externalities, especially for women, by: increasing employment (Eissa and Liebman, Reference Eissa and Liebman1996; Meyer and Rosenbaum, Reference Meyer and Rosenbaum2001; Bastian, Reference Bastian2020), increasing wages (Dahl et al., Reference Dahl, DeLeire and Schwabish2009), and reducing poverty (Hoynes and Patel, Reference Hoynes and Patel2015). For children in lower-income families, the EITC improves health (Hoynes et al., Reference Hoynes, Miller and Simon2015; Averett and Wang, Reference Averett and Wang2015), improves test scores (Chetty et al., Reference Chetty, Friedman and Rockoff2011; Dahl and Lochner, Reference Dahl and Lochner2012), and increases educational attainment (Manoli and Turner, Reference Manoli and Turner2018). Moreover, the positive effects on educational attainment and employment outcomes hold in the long-run, even after children living in recipient households grow up and are in their mid-twenties (Bastian and Michelmore, Reference Bastian and Michelmore2018). Besides, the EITC and other specific cases, the existing literature assessing the impact of other types of STEs is rare, less conclusive, and can often show negative results. Using microsimulation modelling, Avram et al. (Reference Avram, Levy and Sutherland2014) examine TEs in six European countries to assess the prevalence and distributional effects of legal provisions that lower taxable income (tax allowances) or the final tax liability (tax credits) for specific groups of taxpayers. With the exception of Denmark, those in the bottom 20 per cent of the income distribution were significantly less likely to benefit from these tax allowances and tax credits compared to the rest of the population. Moreover, the value of these tax advantages tended to rise with income, hence exacerbating inequality. VAT-related TEs are another policy instrument often used to support the worse off for which the existing evidence shows rather negative results in terms of their effectiveness. The main reasons include poor targeting of the beneficiaries, market structure features affecting the pass through of the tax cuts to final consumers (Benzarti and Carloni, Reference Benzarti and Carloni2019, and de la Feria and Walpole, Reference De la Feria and Walpole2020), among others.
As mentioned by Morel et al. (Reference Morel, Touzet and Zemmour2019), ‘one reason so little attention has been paid to fiscal welfare has to do with the lack of available or reliable data, which contributes to the invisibility of these tax instruments and their distributive outcomes’. Against this backdrop, shedding light on the use of TEs as a part of government social spending is crucial. This article does just that by providing the first data-driven assessment on the size and patterns of use of social tax expenditure (STEs) around the world. It also looks in more depth at a selected group of countries and compares the figures on STEs to direct spending on social policies. The article is structured as follows: it first offers insights into the methodology used to identify STEs from the larger pool of TE provisions in the GTED, it then provides some key findings relating to the usage of STEs around the world, it describes some of the most common methodological challenges when working with cross-country TE data and, finally, offers some conclusions regarding future directions for research and policy on STEs.
Methodology and data
The basis for this article is a dataset of STEs from 105 countries with information including the names and descriptions of STEs, the tax from which the TE comes from (e.g. personal income tax [PIT], VAT, etc.) the type of TE employed (e.g. exemption, deduction, tax credit, etc.), the targeted beneficiaries (e.g. businesses or households), policy objectives (e.g. promote investment or support poor households), government function (e.g. education or health) and, importantly, estimates of revenue forgone due to each individual TE provision.Footnote 3 To compile our dataset, we utilised the GTED version 1.2.1 (Redonda et al., Reference Redonda, von Haldenwang and Aliu2023b), which gathers all existing official and publicly available information on TEs released by governments worldwide. Our approach involved categorising all 25,208 GTED TE provisions into two categories: ‘social’ or ‘not social’. To achieve this, we utilised the Roberta Natural Language Processing (NLP) artificial intelligence (AI) model, recognised for its advanced text classification capabilities.
The Roberta NLP model, based on the BERT (Bidirectional Encoder Representations from Transformers) architecture, effectively considers the context of words within text by examining the surrounding terms. This feature allows the model to conduct intricate text classification tasks, such as categorising TE provisions into economic and social categories. To adapt the model for our specific task, we conducted a fine-tuning process as described below.
Training details
Data preprocessing
To provide Roberta NLP with as much information as possible, we carried out data preprocessing by joining available TE provision names with supplementary details (descriptions, policy objectives, targeted beneficiaries, and functional categories) when possible.
Training dataset creation
We began the categorisation process by training the Roberta NLP model using a carefully selected subset of our data. This subset primarily included provisions from TE reports of Canada, which employs the OECD’s Classification of the Functions of Government (COFOG) categorisations for its TEs, and Germany, which provides detailed ‘Functions’ for its TE provisions. We also manually categorised some provisions from other countries with rich data to diversify the training dataset. In total, we categorised 797 provisions into ‘social’ or ‘not social’ categories to create the training dataset.
Training the model
We used 509 provisions from this dataset to train the Roberta NLP model, reserving the remaining provisions for validation and testing.
Model deployment and validation
We deployed the fine-tuned model to categorise the remaining 25,411 provisions in the GTED. After categorisation, we conducted spot-checks to ensure data accuracy and made minor adjustments where necessary to maintain data integrity and precision. This process identified 6,047 entries (out of 25,208 in total in the GTED) as ‘social’ provisions.
Definition of social provisions
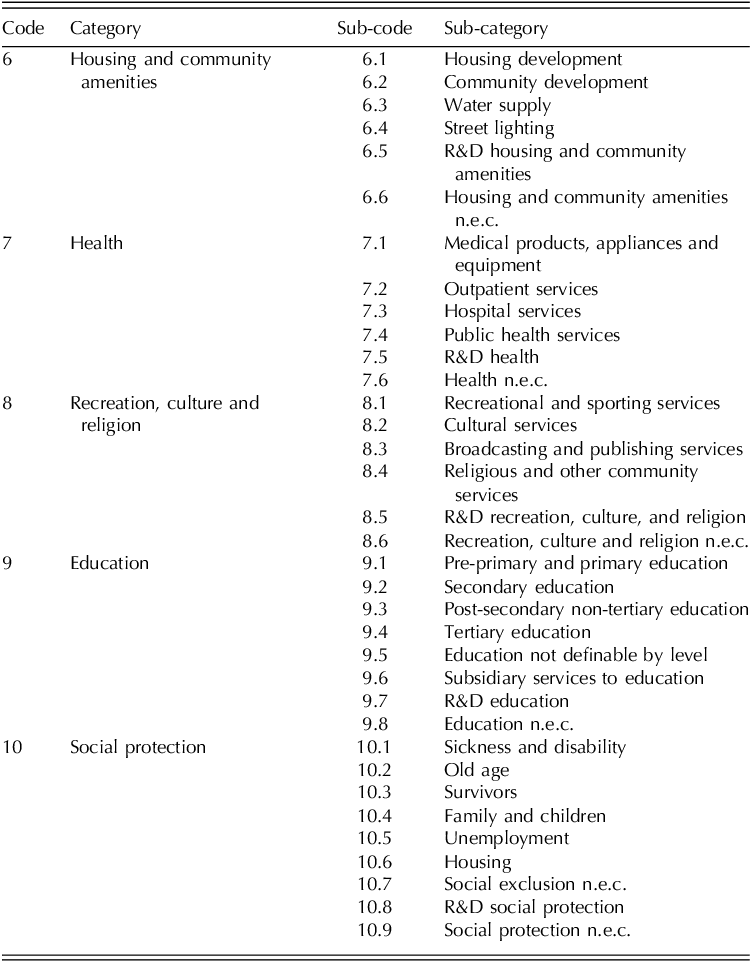
In our study, the classification of STEs is based on the OECD’s and United Nations’ COFOG classifications (UN, 2000; OECD, 2011). In summary, STEs encompass categories 6 to 10 according to COFOG. These categories include functions related to housing and community amenities (COFOG 6), health (COFOG 7), recreation, culture, and religion (COFOG 8), education (COFOG 9), and social protection (COFOG 10). The specific functions within each category range from housing development, medical products, and educational services to social protection against sickness, unemployment, and old age (see Table A1 in Appendix 1). COFOG categories 6, 7, 9, and 10 include spending areas which are typically described as ‘social’ and are also covered by the OECD’s Social Expenditure Database. Areas covered by COFOG 8, particularly recreation and culture, are also designated as ‘social’ by some countries (e.g. Czechia, Italy, or Mexico) and are included in the OECD’s data on tax breaks for social purposes (OECD, 2023). That category is, therefore, also included in our STE dataset. Footnote 4
Provisions in these categories are considered ‘social’ because they align with policy goals aimed at improving quality of life. Our approach includes TE provisions with demonstrated social impacts, recognising that what is deemed ‘social’ can vary across countries. This necessary simplification facilitates cross-country comparisons but also highlights the challenges and potential drawbacks of our classification system due to variations in national definitions and implementations of social policies. Additionally, our approach does not consider the effectiveness or efficiency of STE provisions or their direct spending counterparts in achieving their goals, as determining such factors would require a separate evaluation for each policy. For example, while direct subsidies or tax breaks for housing improvements aim to enhance living conditions, they may also inadvertently benefit wealthier segments of the population. Addressing these complexities and evaluating the full spectrum of STEs would require more detailed and context-specific research, and hence goes beyond of the scope of this paper.
We assigned each STE provision to one of these categories using keyword filtering and by manually reviewing all entries. For the purposes of this article, we did not assign sub-categories to our data (but we used descriptions of sub-categories to identify precise keywords to use in the categorisation process mentioned above).
Main results
Our analysis provides new insights on the size and patterns of use of STEs. First, the data shows that STEs are prevalent in almost all 105 countries. In fact, we were not able to identify social spending through the TE system in only five countries included in the GTED. All five cases were countries which only report aggregated TE information (e.g. only providing the total revenue forgone from VAT or PIT, instead of listing and costing the individual provisions within each tax type), making it impossible to dig deeper into the data. The number of STE provisions identified in each country is substantial, with the figure lying around eighty four STEs on average and ranging from only five in North Macedonia to more than 400 in Burkina Faso or around 300 in France and Italy. Unfortunately, not all these identified STE provisions have available revenue forgone figures. Indeed, close to 22 per cent of STEs identified in the GTED (1,312 out of the 6,047 provisions) do not have any revenue forgone estimates.
Despite incomplete cost data, our analysis finds that governments forgo significant amounts of tax revenue through the implementation of STEs. On average, the revenue forgone lies around 1.1 per cent of GDP, 6.3 per cent of tax revenue, and 27.0 per cent of total revenue forgone. As shown by Figure 1, these figures are significantly higher for HICs, where the ratios are 2.0, 10.3, and 45.8 per cent, respectively. In some HICs such as the US, the Netherlands, or Finland these figures can go close to 6 per cent of GDP, and in some emerging economies such as India or Jordan, revenue forgone from STEs can reach around 3 per cent of GDP.
Average Revenue Forgone on Social TE provisions by country income group

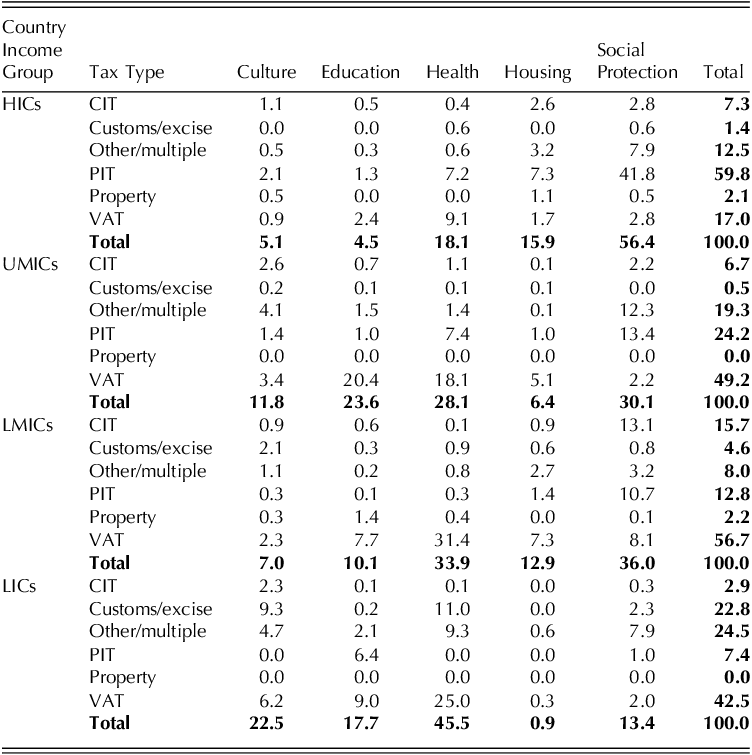
Additionally, we find that patterns of TE use differ significantly across groups of countries both in categories targeted by STEs but also the tax types through which those STEs are granted. As it can be observed in Table 1, for example, high income countries tend to use more PIT-related STEs, where they account for roughly 60 per cent of the total. STEs related to social protection (e.g. tax credits for families and children or pension-related TEs) are particularly popular in the PIT systems of HICs. In LICs, instead, the prevalence of PIT-related STEs is negligible (roughly 7.5 per cent) since the PIT base is often very narrow. The reduced size of the PIT base in LICs is not only due to the relatively smaller share of the workforce that is required to pay PITs, but also because of higher levels of informality. STEs related to social protection are also uncommon in LICs because such programs are often in their infancy or completely absent in this group of countries. Similarly, housing related STEs make up a sizable portion of the revenue forgone in HICs, while they are almost inexistent in LICs.
Matrix of average share of total STE revenue forgone by category and tax type

On the other hand, HICs tend to rely significantly less than all other income country groups on STEs granted through VAT. This is not surprising since they collect a smaller share of tax revenues through this tax. The share of VAT-related STEs is only 17.0 per cent in HICs, compared to 49.2 in UMICs, 56.7 LMICs, and 42.5 per cent in LICs, with the largest shares being spent on STEs for Education and Health. Most provisions of this nature exempt or zero-rate certain goods (e.g. mosquito nets in Rwanda and many other countries, coloured pencils in Pakistan, or respirators in Slovakia) from VAT.
Interestingly, while Corporate Income Tax (CIT) related STEs are not common in most countries, in LMICs, they make up a relatively large proportion of revenue forgone from STEs – around 15 per cent, on average. Most of this revenue forgone comes in the form of exemptions for charitable organisations or deductions for firms providing certain employee benefits (mostly falling under the social protection category). Similarly, while STEs falling under the recreation, culture, and religion category are relatively uncommon, they make up more than 22 per cent of revenue forgone from STEs in LICs, on average. Most of this revenue forgone comes from customs or VAT provisions on cultural or religious goods that are imported or sold in these countries.
Countries also differ in what TE types they use to pursue social policy through the tax system (Figure 2). This choice of mechanism is particularly important since it can influence both the effectiveness and the efficiency of STEs, e.g. by triggering social or economic externalities. Deductions, for example, are very popular in HICs and UMICs despite widespread evidence about their regressivity and other externalities such as gender imbalances of benefits provided (Avram et al., Reference Avram, Levy and Sutherland2014; Sommer and Sullivan, Reference Sommer and Sullivan2018; Collins, Reference Collins2020). Such mechanisms are commonly used to pursue housing (e.g. mortgage interest deductions) or aging-related objectives (e.g. deductions of pension contributions) in many HICs and UMICs. Tax credits are rarely used outside of HICs, despite evidence of their progressivity and effectiveness in tackling many social issues such as health, employment, or poverty (Eissa and Liebman, Reference Eissa and Liebman1996; Meyer and Rosenbaum, Reference Meyer and Rosenbaum2001; Bastian, 2018; Hick and Lanau, Reference Hick and Lanau2019). Even in HICs, only around 15 per cent of STEs take the form of tax credits. VAT exemptions – the most popular STE mechanism in LMICs and LICs – tend to also perform poorly with regards to beneficiary targeting and pass-through rates to final consumers (Benzarti and Carloni, Reference Benzarti and Carloni2019; de la Feria and Walpole, Reference De la Feria and Walpole2020).
Average share of STE by TE mechanism

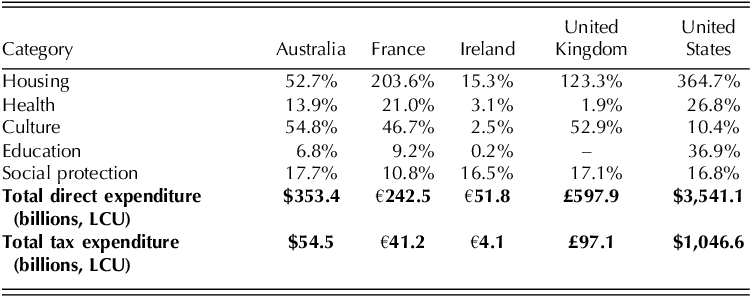
Ensuring STEs are designed to maximise effectiveness and efficiency and minimise externalities is particularly important since in some cases, for some categories, STEs are the leading form of social spending. For example, looking at some selected HICs where detailed data is more readily available (Table 2) we find that in France, the UK, and the US, for instance, the central government spends more on housing through STEs than through direct spending. Footnote 5 In the US and France the ratio spent on housing through STEs is exceptionally large, reaching almost 365 per cent in the former and more than 203 per cent in the latter. In the US, housing-related provisions such as the exclusion of net imputed rental income and the capital gains exclusion on home sales are the second and seventh largest STE provisions, respectively, while France has three housing related provisions in their top ten.
STEs as a share of Social Direct Expenditure for select countries (2016-2021 Average)

In Australia, France, and the UK, STE spending on recreation, culture, and religion is also substantial, being around half the size of direct spending. Much of this spending comes in the form of PIT deductions for charitable donations. However, in the UK, the VAT zero-rate for printed matter and e-publications is also sizable (tenth largest STE provision, overall). Interestingly, while being the largest STE category in most HICs and UMICs, STE spending on social protection is equal to only around 15 per cent of direct spending on the same category. This is because many countries also have large direct spending programmes that fall under this category, such as direct transfers to poor households or child benefit payments (e.g. Supplemental Nutrition Assistance Program in the US or the Kindergeld in Germany).
Except for the US, where STEs for education account for roughly 37 per cent of direct spending and are the second largest item (after housing), whereas the rest of the countries spend relatively little on education through the tax system. However, as will be discussed in the next section, some countries classify part of the education-related provisions under the ‘structural reliefs’ category.
Navigating the complexity of tax expenditure data
Our article provides a heretofore absent data-driven cross-country comparison between direct spending and TE for social policy. Yet, whereas direct spending data is usually available in a way that allows for a certain level of comparability both across countries, but also over time; working with TE data can be significantly more challenging. Issues regarding benchmarking as well as under-reporting are inherent issues for any study using TE data. At the same time, information on TEs is often limited and of poor quality, which can also affect our sample.
Benchmarking
As mentioned in Section 1, Surrey was the first to formally identify the use of TEs as an alternative to direct spending in the 1960s. Later, Surrey and McDaniel (Reference Surrey and McDaniel1976) moved one step further in the definition of the TE concept by highlighting that taxation consists of two components: (i) the general provisions of the tax system, and (ii) exemptions from those provisions in favour of a particular industry, activity, or group. Nowadays, the broadly accepted definition of TEs follows the so-called ‘indirect’ approach, according to which TEs are identified as departures from the normal or benchmark tax structure, which is very much in line with the second component in Surrey and McDaniel’s description.
Yet, where the conceptual debate about the TE concept seems to be set, the debate on what should be considered a TE and what should be part of the benchmark tax system is still an open and challenging one.
Between Countries: Very often different countries apply different criteria when it comes to the definition of their benchmark tax systems (and, hence, of their TE regimes). These differences can make cross-country comparability in the TE field a challenging task.
First, countries’ tax structures can vary considerably, which can have a significant impact on the number of existing TEs as well as on their magnitude in terms of revenue forgone. If a given country has a carbon tax in place and, as often the case, grants a number of exemptions or reduced rates to energy intensive and trade-exposed sectors or businesses, those provisions would be classified as TEs and add to the revenue the government is forgoing. In contrast, in a country that does not tax carbon emissions at all, such TEs will not exist.
Second, even when the tax structure is the same (or similar), standard tax rates can vary significantly. For instance, whereas the standard VAT tax rate in Switzerland is 8 per cent, the standard rates in its three largest neighbours are 22 per cent in Italy, 20 per cent in France, and 19 per cent in Germany. Comparing VAT-related TEs across countries necessarily needs to take into consideration the different standard tax rates against which TEs are computed.
Third, some countries have different criteria to define what measures are structural tax measures and which ones are non-structural ones or TEs. In Canada, structural tax reliefs are defined as tax measures ‘whose main objective is internal to the tax system’ (Department of Finance Canada, 2023). Yet, the criteria used by governments is often based on less technical grounds. For example, unlike most of the countries, France and Germany consider lower VAT rates for food stuff to be part of benchmark tax system because these countries view these provisions as fundamental features of their tax system based on a general and redistributive logic. As a result, the TE reports in these countries do not include these provisions (nor their costs). Yet, other VAT-related TEs such as lower VAT rates for cultural activities are classified as a TE and hence reported together with the revenue forgone, they generate. Likewise, in the UK, ‘2,600 (for profit and charitable) private schools benefit from a myriad of tax reliefs, including an exemption from VAT. Additionally, the 1,300 schools with charitable status pay no corporation tax, capital gains tax, or stamp duty. They also benefit from capital gains and inheritance tax relief, and gift aid on donations. Charitable schools also benefit from a minimum 80 per cent rebate on business rates in England.’ (Boden, Reference Boden2023). Interestingly though, the UK government classifies all these measures as structural tax reliefs and, hence, the UK reports no STE for education (Table 2).
Fourth, some countries can have different criteria when it comes to the classification of different types of TEs. Whereas most of the countries classify tax deferrals as TEs, the Argentinian government uses a TE definition that only includes provisions which create a permanent revenue loss. In that context, and disregarding the loss in the net present value of deferred revenues, Argentina does not consider tax deferrals as TEs (MECON, 2022).
Within Countries: The issues mentioned before arise from the fact that benchmarking is country-specific. Yet, benchmarking comparability can also be an issue within countries since governments tend to change their benchmark definitions. In the Netherlands, a change in the benchmark definition with major implications for revenue forgone estimation was made from 2018 (Ministerie van Financiën, Reference van Financiën2018). Until 2017, the TE report included only those provisions that met the strict definition of a ‘tax expenditure’. As of 2018, the term ‘ax expenditure’ was dropped. This decision was made on the grounds of a 2016 report by the Fiscal Space Study Group that recommended no distinction between TEs and other provisions triggering revenue forgone. Footnote 6 More specifically, the Group recommended that the definition of the ‘tax expenditure’ concept should not be what matters to include a TE in the Budget Memorandum, but rather its budgetary and policy relevance (Studiegroep Begrotingsruimte, Reference Begrotingsruimte2016). As a consequence, the Budget Memorandum 2017 included, in a separate table, more than twenty additional provisions that met the criteria of budgetary and policy relevance but had not been included before. The 2018 Budget Memorandum added a similar number of provisions and, as of 2018, all those provisions were integrated in the report together with the rest of the TEs. Also, as of 2018, TEs that are mandatory under European laws and regulations, or those having a fiscal cost of less than five million Euros are no longer reported. However, for the sake of comparability, the latter keep being included in the ‘Explanatory Notes on Fiscal Regulations’ annex to the Budget Memorandum. In addition, in the open-data section of the Ministry of Finance’s website, time series for all TEs for the 2004-2024 period are disclosed, including the ones that were not reported before 2017/2018.
More recently, the French government decided to change the estimation method of VAT-related TEs and disregard around 50 per cent of their cost (roughly ten billion Euros) on the grounds that the government transfers half of VAT revenues to social and local administrations and, hence, that the cost of these TEs corresponds only to the share borne by the government, i.e. 50 per cent of the total. As discussed by Ecalle (Reference Ecalle2023), this change is controversial for some major reasons. First, the real cost of VAT-related TEs for the public administration as a whole is still twenty billion Euros, and hence this is the cost that should have been included in the 2024 budget proposal. Second, this new method is not applied consistently to other taxes whose revenues are also partially transferred to local authorities. Lastly, as the Ministry of Finance does not publish a series of TE figures for previous years estimated using this new method, the figures included in the 2024 Budget are not comparable with those in previous years.
Benchmarking definitions can have significant implications for the definition, classification, and estimation of TEs. This is particularly challenging in the context of this article since the GTED gathers all existing TE data, as reported by governments based on their own-defined benchmarks. Hence, any interpretation of our results, and of any other study using TE data, needs to keep this in mind.
Under reporting and absence of key information
Under-reporting is one of the key drivers of the lack of transparency in the TE field, and hence one area of potential concern for our analysis. There exist some key sources of under-reporting. First, since the GTED only inputs official (and publicly available) TE data, the 113 non-reporting countries in the GTED (i.e. countries that have never issued a single TE report since 1990, the first year covered by the GTED) are excluded from our sample. Second, even in the case of the 105 reporting countries, the quality and scope of the information provided is often poor and incomplete, and highly heterogeneous. Some countries simply report information on a subset of TEs. For instance, the official TE report published by the US Treasury only includes income (personal and corporate) related TEs. Likewise, the Philippines only report on tax incentives for investment and not on the entire tax expenditure regime. Finally, many countries list a large number of TE provisions, but only report revenue forgone estimates for a share of them.
The difference between the number of TEs that a report lists and those for which it provides estimates for revenue losses can be considerable (Redonda and Neubig, Reference Redonda and Neubig2018). In France, the 2024 Projet de Loi de Finances (the budget proposal by the executive) lists 467 TEs and only provides a revenue forgone estimate for 403, out of which 129 are only reported as an order of magnitude. Likewise, in the UK, there are 1,180 tax reliefs, but estimated costs are published for only 365, leaving 815 uncosted (House of Commons, 2023a). This estimation-gap can be explained by different factors, including confidentiality issues, lack of data, and disproportionate estimation costs, among others. According to the Treasury, the majority of reliefs in the UK (841 of 1,180) are structural – establishing the scope/base of a tax (e.g. income tax personal allowance). ‘For most reliefs where HMRC does not publish an estimated cost, the information required to do so is not available. In large part, this is because many reliefs are specifically designed so that people who do not owe any tax are not required to engage with the tax system to claim the relief’ (House of Commons, 2023b). More specifically, 252 of the 339 non-structural reliefs (those with a specific behavioural policy aim) have been reported with a fiscal cost attached and, of the remainder, ‘revenue forgone estimates for twenty-two reliefs could not be published as data is not available, while publishing data for twenty seven would be trigger confidentiality issues’ (House of Commons, 2023b).
Besides non-reporting countries and the estimation gap between listed and estimated TEs, the information that governments provide, even for TE provisions including revenue forgone estimates, is often very poor and crucial information such as the targeted beneficiaries, legal references, and policy objectives is missing from many reports. Information on policy objectives and the number of beneficiaries is particularly important to link the revenue forgone from TEs to the expected benefits and is one of the main pieces of information needed for any cost-benefit analysis of TE provisions. Yet, as illustrated by Indicator 4.1 Policy Objective of the Global Tax Expenditures Transparency Index (GTETI), which assesses the extent (share of total revenue forgone) that TE policy objectives are disclosed, 69 per cent of the countries are classified as performing poorly. This means that 69 per cent of countries only disclose the policy objective of some provisions or they only disclose broad policy objectives for all TEs, without going into detail for individual provisions (Redonda et al., Reference Redonda, Millan, von Haldenwang and Aliu2023a).
Another issue linked to the quality of the data included in the TE reports regards the level of aggregation of such data. Ideally, TE reports should provide revenue forgone estimates as well as all the relevant companion information such as policy objectives, beneficiaries and legal reference at the individual TE provision level. This is crucial for evidence-based policy making purposes since providing aggregated data does not allow to disentangle the fiscal cost of each TE. Equally important, aggregated data does not allow to identify which TEs are value for money and which ones are not cost-effective. According to GTETI Indicator 5.1 Disaggregation of Revenue Forgone Estimates assessing the share of total revenue forgone estimates provided at the individual TE provision level, 25 per cent of countries provide only aggregate revenue forgone estimates (usually by type of tax and/or type of TE).
Conclusions
Based on new data from the GTED, our article provides a number of new insights into the role that STEs play in the way social policy is implemented across the globe. First, it shows that STEs are present in almost all countries, although not always acknowledged. Second, it shows that STEs are costly – averaging more than 1 per cent of GDP, 6 per cent of tax revenue, and 27 per cent of total revenue forgone from TEs, and reaching as high as 6 per cent of GDP in some countries. Overall, direct spending is larger than TE. Yet, in some countries, the central government spends more on specific functions through STEs than through direct spending; a feature that may be driven by choices regarding the nature and extent to the welfare state in these countries. Similarly, the article shows that different countries use STEs differently. For example, HICs focus more on social protection through the PIT system, while LICs and LMICs mostly make use of their VAT systems to provide relief for goods and services related to health or education. This said, as with any cross-country analysis using TE data, comparisons between countries and also within countries (over time) should be done cautiously. Consequently, we provide a discussion of key issues regarding benchmarking and under-reporting that can hinder cross country comparability and should hence be taken into consideration. This discussion should be seen as an attempt to shed further light on cross-country comparability issues when it comes to TE and revenue forgone data. While the issues and challenges discussed in the article are not meant to provide an exhaustive list, they should assist in encouraging further national and comparative work on STE and their, somewhat underappreciated, important role in the social policy landscape.
Given the importance of STEs in social spending, our article also argues that the design and monitoring of STEs is crucial. Particular attention should be given to ensuring that STEs are designed to serve their intended purposes most effectively while minimising negative externalities from such interventions. This can only be done through frequent evaluations of individual STE policies. Lastly, our article also shows that publicly available information on STEs is still scarce, and more work is needed by governments to improve their transparency. Whereas the literature around STEs has been growing since Titmuss and others first introduced the concept of fiscal welfare, empirical evaluations assessing their effectiveness are still an exception rather than the rule. Consequently, researchers and governments worldwide should significantly increase their efforts to better understand which TEs are, indeed, contributing to tacking inequality and poverty and which ones are not. Ideally, the outcomes of these evaluations should be a key input for evidence-based policy making.
Finally, and equally important, having a clearer picture of the cost of TEs and the goals they pursue would also substantially contribute to providing a holistic picture of government spending policies, including both direct spending as well as TE. Ideally, to ensure policy coherence, TEs should be incorporated in the budget cycle as well as in medium term strategies. Revenue forgone estimates for each TE should be included in these documents together with the description of the provision, information on the policy objectives, the beneficiaries and the classification in terms of functions of government. The latter is crucial to allow TEs to be classified in a consistent way with respect to direct spending entitlements. Two indicators in the GTETI capture this perspective (Indicator 2.4 Budget Cycle Integration and Indicator 2.5 Medium-term Strategy Integration) and it finds that the overall performance across the assessed countries is relatively poor, with roughly 50 per cent of the countries falling into the lowest score bracket.
Increasing transparency in the TE field should be seen as a goal per se, as a way to increase transparency and accountability. At the same time, evaluations are a necessary input for evidence-based policy making. More and better data on TEs is key as an input to conduct STE evaluations that are, in turn, crucial to identify those STEs that are worth maintaining (or even expanding) and those that should be reformed or simply eliminated. Possessing a better understanding of these measures, and their performance, is also an important contribution to enhancing our understanding of the way many social policy initiatives are being designed and delivered by societies; perspectives that merit greater attention as the tax and social policy literature develops.